Introduction
Sunflower belongs to the genus Helianthus of the family Asteraceae, which is a diverse and large family of flowering plants. Sunflower, Helianthus annus L., is an important agricultural crop in most sunflower growing countries that produces edible oils, that is estimated as a12% of global oil production of vegetable oils worldwide. It takes position four after palm oil, soybean and canola in vegetable oil production (Rauf et al., 2017). Oil from sunflower is considered a healthy option to vegetable oils, because it has high content of polyunsaturated fatty acids with 55-60 percent of linoleic acids and 25-30 percent of oleic acids, which helps in reduction of cardiac related problems.
The sunflower plant is a major oil crop and belongs in a crop rotation system in South-West Kenya due to growing well under drought condition compared with other crops in tropical semi arable condition. The sunflower crop has various varieties, but two main types are exists as tall and dwarf in Kenya. The tall varieties are open pollination as a landrace or inbred line and can grow to 1.5-2.4 m. The most grown tall varieties are Hungarian white, Kenya fedha, Kenya shaba, Record and Grey stripped. The most commonly local dwarf varieties are normally hybrids and grow to 1.2m with smaller head. The efficiency of hybrid breeding programs could be augmented, if the inbred lines could be assessed and superior crosses predicted before field evaluation (Melchinger et al., 1991). Open-pollinated and composite populations and inbred lines are main resources for sunflower breeding programs in Kenya. Therefore,
Assessment of Genetic Diversity and Population Structure on Kenyan Sunflower ( Helianthus annus L.) Breeding Lines by SSR Markers
Esther W. Mwangi
1, Salem Marzougui
2, Jung Suk Sung
3, Ernest C.Bwalya
4, Yu-Mi Choi
3and Myung-Chul Lee
3*
1
Researcher, Food Crops Research Institute, Kenya Agricultural & Livestock Research Organization P.O.
Private Bag Njoro-20107, Republic of Kenya
2
Researcher, Institution de la Recherche et de l'Enseignement Supérieur Agricoles,
National Agricultural Research Institute, Compexe Universitaire, Boulifa, ElEkf 7100, Republic of Tunisia
3
Senior Researcher, National Agrobiodiversity Center, National Institute of Agricultural Sciences RDA, 370 Duckjin-gu, Jeonju-si, Jeollabuk-do, 54874, Korea
4
Researcher, Zambia Agricultural Research Institute, P/Bag 7 Mt. Makulu Rd, Chilanga, Republic of Zambia
Abstract - In crop breeding program, information about genetic dissimilarity on breeding resources is very important to corroborate genealogical relationships and to predict the most heterozygotic hybrid combinations and inbred breeding. This study aimed to evaluate the genetic variation in Kenyan sunflower breeding lines based on simple sequence repeat (SSR). A total of 83 alleles were detected at 32 SSR loci. The allele number per locus ranged from 2 to 7 with an average of 2.7 alleles per locus detected from the 24 sunflower accessions and the average value of polymorphic information contents (PIC) were 0.384. A cluster analysis based on the genetic similarity coefficients was conducted and the 24 sunflower breeding resources were classified into three groups. The principal coordinates (PCoA) revealed 34% and 13.38% respectively, and 47.38% of total variation. It was found that the genetic diversity within the Kenyan sunflower breeding resources was narrower than that in other sunflower germplasm resources, suggesting the importance and feasibility of introducing elite genotypes from different origins for selection of breeding lines with broader genetic base in Kenyan sunflower breeding program.
Key words – EST-SSR, Genetic diversity, Population structure, Sunflower
*Corresponding author. E-mail : [email protected] Tel. +82-63-238-4900
ⓒ 2019 by The Plant Resources Society of Korea
Original Research Article
evaluation of genetic diversity of such parental lines using molecular markers is important in sunflower breeding for successful exploration, genetic stability and enhanced heterotic effect in the available germplasm, because morphological characters are limited in number and unstable (Sahranavard et al., 2015).
Molecular markers play a major role in identifying variation in genomic DNA sequences. Polymorphism at molecular level in different species has played a major role in the analysis of genetic diversity, identification of phylo- genetic relationships and also in transfer of target traits to elite germplasm using molecular linkage map in the aim of improving breeding activities. Different molecular markers have been used in mapping genes leading to development of sunflower linkage maps resulting in studies revealing genetic diversity in the genus Helianthus. Among The first molecular linkage maps was developed using Random Amplified Polymorphic DNA (RAPD) markers on wild sunflower (Rieseberg et al., 1993). There after other markers were generated and published using PCR based Restriction Fragment Length Polymorphic (RFLP) markers (Berry et al., 1995; Gentzbitel et al., 1995; Jan et al., 1998). Most of the sunflower linkage maps reported 17 linkage groups which represent the number of haploid chromosomes present in sunflower. Simple sequence repeats (SSR) marker resources have been developed for sunflower (Paniego et al, 2002; Yu et al., 2002; Gandhi et al., 2005; Pashley et al., 2006) and these markers were used to make new linkage maps (Tang et al., 2003a,b; Dehmer and Fried, 2006) and expressed sequence tags (EST) - SSR, INDELS and single nucleotide polymorphism (SNP) markers were added on the already existing sunflower maps (Heesacker et al., 2008, Carla et al 2015). Recently, Badouin et al. (2017) published draft genome sequence of sunflower.
In case of genetic diversity analysis of crops, genomic- SSRs are more popularly used than EST-SSR markers due to the availability of markers, but the current trend towards the use of functional markers. ESTs derived markers have several fundamental advantages over genomic-SSRs according to embed in transcribed gene sequences. EST-SSR markers can be increase the efficiency to direct gene tagging for agronomical important traits by quantitative trait locus
mapping and show a higher level of transferability to closely related species than genomic SSR markers (Gupta et al., 2003, Bhat et al., 2005). EST-SSR markers have been used in several studies, such as evaluation of genetic diversity in little millet (Ali et al., 2017), foxtail millet (Ali et al., 2016) and perilla (Song et al., 2015). Furthermore, if the hybrid inbred lines per se could be screened by molecular marker based genetic distance, prediction of heterosis can be possible to make superior crossing before field evaluation in sunflower breeding.
In Kenya, sunflower crop is more important in semi-dried area according to climate changes, because profits from growing sunflower with three months harvesting period are higher than those from traditional crops such as maize, sorghum and tobacco. Therefore, molecular characterization and estimation of the genetic diversity of genotypes that used in breeding are required to further improve the breeding programs. The present study was designed to estimate the level of genetic diversity in newly introduced sunflower lines through SSR markers.
Materials and Methods
Plant material and DNA extraction
Twenty four accessions, which consists of six landraces, two modern cultiva, ten restorers, four male sterilities and two female lines, were obtained from Kenya agricultural and livestock research organization (Table 1) and analyzed for genetic diversity using 32 EST-SSR and genomic-SSR markers (Table 2) that reported by Heesacker et al. (2008). Ten seeds of each accession were germinated and grown in the green house. The leaves were harvested at four-leaf stage after 10 days of planting and genomic DNA was extracted according to NucleoSpin Plant II Kit protocol (Macherey-Nagel, Germany). DNA quality and quantity were determined using a UV-Vis spectrophotometer micro plate reader (Biotech instrument, USA Ltd.) and visual comparison of 1% agarose gel electrophoresis. The extracted DNA was adjusted con- centration at 50 ng/μL and stored at -20℃ for further use.
PCR amplification
Thirty two SSR markers (Table 2) that reported earlier by
Heesacker et al. (2008) were used in this study to amplified the template DNA. The SSR primers were amplified in a 20 µL total volume containing 50 ng of genomic DNA, 2 µL of each SSR primers (10 pmol), 4 µL of 5x reaction Buffer (Inclone Co, Korea), 1 U of Taq DNA polymerase (Inclone Co, Korea), 1.6 µL of dNTP (2.5 mM), and 11 µL nuclease- free water. DNA amplifications were performed in PTC-100 thermal controller (MJ Research Watertown, MA, USA). The PCR profile was: initial denaturation of 3 min at 94℃, followed by 35 cycles of 45s at 50-55℃ and 45s at 72℃, and a final extension of 10 min at 72℃. PCR products of clear, stable and specific bands with and expected length (100-250 bp) were considered as successful PCR amplifications. All the amplifications were separated by capillary electrophoresis using Fragment Analyzer
TM96-capillary Automated CE System using DNF-900 double stranded DNA Reagent Kit
(Advanced analytical, USA) according to the manufacturer’s instruction. SSR alleles were visualized and scored using PROSize 2.0 software version 1.2.1.1 Kit (Advanced analy- tical, USA).
Data analysis of genetic diversity and population structure Analysis for different parameters of variability such as number of observed alleles (N
A), expected homozygosity (H
O), expected heterozygosity (H
E), and polymorphism information content (PIC) were calculated by Cervus 3.0 software (Araneda et al., 2004; Kalinowski et al., 2007). An unweighed pair group method with arithmetic mean (UPGMA) hierarchal clustering were carried using DARWin 6.0 (Perrier and Jaccquemond-Collet, 2006) to analyze the cluster.
Among clustering method algorithms, neighbors-joining method (Saitou and Nei, 1987) was used to clustering.
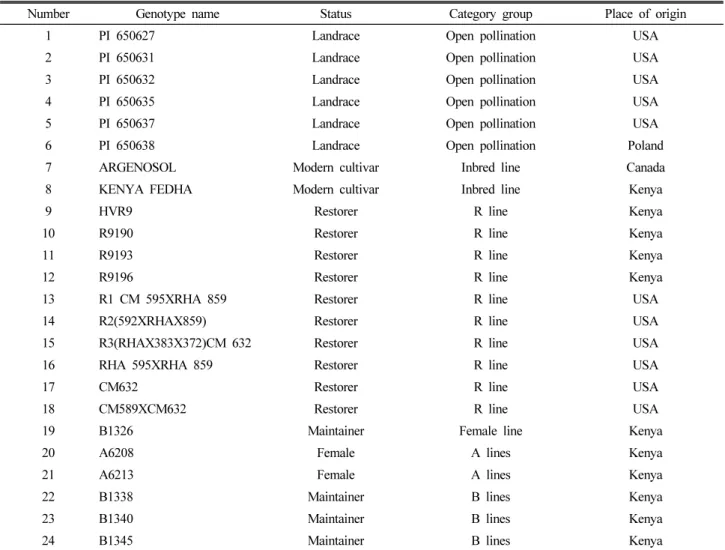
Table 1. A List of 24 sunflower inbred lines, restorer and Maintainers genotypes used in this study
Number Genotype name Status Category group Place of origin
1 PI 650627 Landrace Open pollination USA
2 PI 650631 Landrace Open pollination USA
3 PI 650632 Landrace Open pollination USA
4 PI 650635 Landrace Open pollination USA
5 PI 650637 Landrace Open pollination USA
6 PI 650638 Landrace Open pollination Poland
7 ARGENOSOL Modern cultivar Inbred line Canada
8 KENYA FEDHA Modern cultivar Inbred line Kenya
9 HVR9 Restorer R line Kenya
10 R9190 Restorer R line Kenya
11 R9193 Restorer R line Kenya
12 R9196 Restorer R line Kenya
13 R1 CM 595XRHA 859 Restorer R line USA
14 R2(592XRHAX859) Restorer R line USA
15 R3(RHAX383X372)CM 632 Restorer R line USA
16 RHA 595XRHA 859 Restorer R line USA
17 CM632 Restorer R line USA
18 CM589XCM632 Restorer R line USA
19 B1326 Maintainer Female line Kenya
20 A6208 Female A lines Kenya
21 A6213 Female A lines Kenya
22 B1338 Maintainer B lines Kenya
23 B1340 Maintainer B lines Kenya
24 B1345 Maintainer B lines Kenya
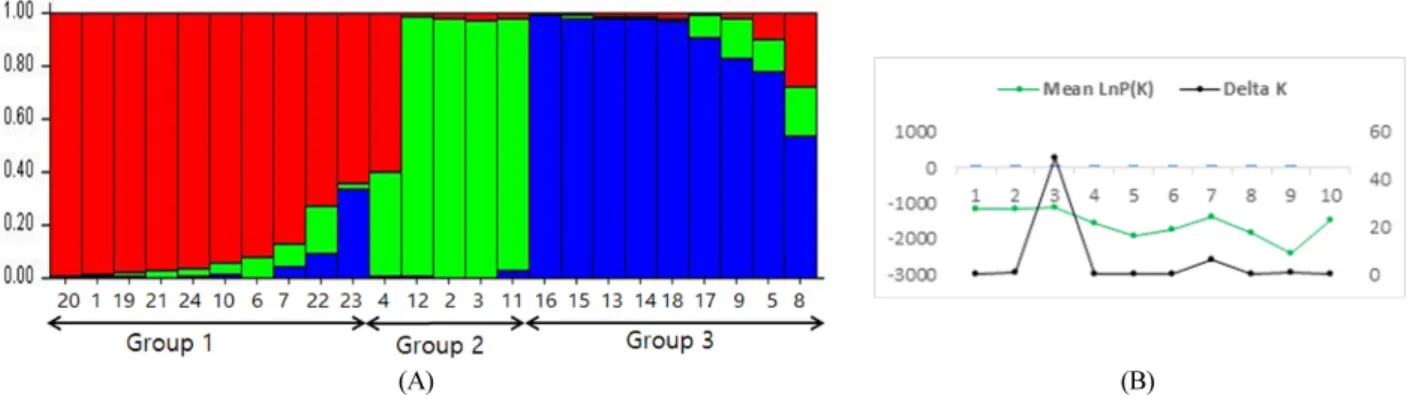
Principle coordinate analysis (PCoA) was performed using GenAlex version 6.5 (Peakall and Smouse, 2012) with 999 times boost-strapping to analyze the molecular variance (AMOVA). Genetic structure was analyzed by STRUCTURE 2.3.4 (Pritchard et al., 2000) with 10 independent run and 100,000 Markov Chain Monte Carlo (MCMC) repetitions
after a burn-in period of 100,000 interactions for each group number K. The actual number of subpopulations was determined by the logarithm of likehood for each K;Ln P (D)
= L (K) and the optimum value ΔK was obtained by ΔK = [L’’ (K)]/ Stdev according to Evanno et al. (2005) as to determine the most likely number of groups.
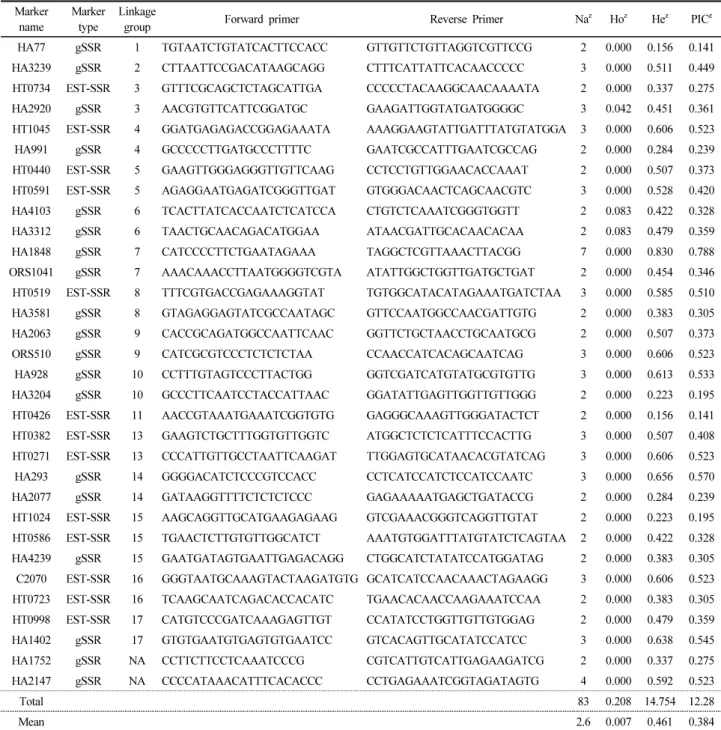
Table 2. Information of 32 SSR primers used for analysis of 24 genotypes in this study Marker
name
Marker type
Linkage
group Forward primer Reverse Primer Na
zHo
zHe
zPIC
zHA77 gSSR 1 TGTAATCTGTATCACTTCCACC GTTGTTCTGTTAGGTCGTTCCG 2 0.000 0.156 0.141 HA3239 gSSR 2 CTTAATTCCGACATAAGCAGG CTTTCATTATTCACAACCCCC 3 0.000 0.511 0.449 HT0734 EST-SSR 3 GTTTCGCAGCTCTAGCATTGA CCCCCTACAAGGCAACAAAATA 2 0.000 0.337 0.275 HA2920 gSSR 3 AACGTGTTCATTCGGATGC GAAGATTGGTATGATGGGGC 3 0.042 0.451 0.361 HT1045 EST-SSR 4 GGATGAGAGACCGGAGAAATA AAAGGAAGTATTGATTTATGTATGGA 3 0.000 0.606 0.523 HA991 gSSR 4 GCCCCCTTGATGCCCTTTTC GAATCGCCATTTGAATCGCCAG 2 0.000 0.284 0.239 HT0440 EST-SSR 5 GAAGTTGGGAGGGTTGTTCAAG CCTCCTGTTGGAACACCAAAT 2 0.000 0.507 0.373 HT0591 EST-SSR 5 AGAGGAATGAGATCGGGTTGAT GTGGGACAACTCAGCAACGTC 3 0.000 0.528 0.420 HA4103 gSSR 6 TCACTTATCACCAATCTCATCCA CTGTCTCAAATCGGGTGGTT 2 0.083 0.422 0.328 HA3312 gSSR 6 TAACTGCAACAGACATGGAA ATAACGATTGCACAACACAA 2 0.083 0.479 0.359 HA1848 gSSR 7 CATCCCCTTCTGAATAGAAA TAGGCTCGTTAAACTTACGG 7 0.000 0.830 0.788 ORS1041 gSSR 7 AAACAAACCTTAATGGGGTCGTA ATATTGGCTGGTTGATGCTGAT 2 0.000 0.454 0.346 HT0519 EST-SSR 8 TTTCGTGACCGAGAAAGGTAT TGTGGCATACATAGAAATGATCTAA 3 0.000 0.585 0.510 HA3581 gSSR 8 GTAGAGGAGTATCGCCAATAGC GTTCCAATGGCCAACGATTGTG 2 0.000 0.383 0.305 HA2063 gSSR 9 CACCGCAGATGGCCAATTCAAC GGTTCTGCTAACCTGCAATGCG 2 0.000 0.507 0.373 ORS510 gSSR 9 CATCGCGTCCCTCTCTCTAA CCAACCATCACAGCAATCAG 3 0.000 0.606 0.523 HA928 gSSR 10 CCTTTGTAGTCCCTTACTGG GGTCGATCATGTATGCGTGTTG 3 0.000 0.613 0.533 HA3204 gSSR 10 GCCCTTCAATCCTACCATTAAC GGATATTGAGTTGGTTGTTGGG 2 0.000 0.223 0.195 HT0426 EST-SSR 11 AACCGTAAATGAAATCGGTGTG GAGGGCAAAGTTGGGATACTCT 2 0.000 0.156 0.141 HT0382 EST-SSR 13 GAAGTCTGCTTTGGTGTTGGTC ATGGCTCTCTCATTTCCACTTG 3 0.000 0.507 0.408 HT0271 EST-SSR 13 CCCATTGTTGCCTAATTCAAGAT TTGGAGTGCATAACACGTATCAG 3 0.000 0.606 0.523 HA293 gSSR 14 GGGGACATCTCCCGTCCACC CCTCATCCATCTCCATCCAATC 3 0.000 0.656 0.570 HA2077 gSSR 14 GATAAGGTTTTCTCTCTCCC GAGAAAAATGAGCTGATACCG 2 0.000 0.284 0.239 HT1024 EST-SSR 15 AAGCAGGTTGCATGAAGAGAAG GTCGAAACGGGTCAGGTTGTAT 2 0.000 0.223 0.195 HT0586 EST-SSR 15 TGAACTCTTGTGTTGGCATCT AAATGTGGATTTATGTATCTCAGTAA 2 0.000 0.422 0.328 HA4239 gSSR 15 GAATGATAGTGAATTGAGACAGG CTGGCATCTATATCCATGGATAG 2 0.000 0.383 0.305 C2070 EST-SSR 16 GGGTAATGCAAAGTACTAAGATGTG GCATCATCCAACAAACTAGAAGG 3 0.000 0.606 0.523 HT0723 EST-SSR 16 TCAAGCAATCAGACACCACATC TGAACACAACCAAGAAATCCAA 2 0.000 0.383 0.305 HT0998 EST-SSR 17 CATGTCCCGATCAAAGAGTTGT CCATATCCTGGTTGTTGTGGAG 2 0.000 0.479 0.359 HA1402 gSSR 17 GTGTGAATGTGAGTGTGAATCC GTCACAGTTGCATATCCATCC 3 0.000 0.638 0.545 HA1752 gSSR NA CCTTCTTCCTCAAATCCCG CGTCATTGTCATTGAGAAGATCG 2 0.000 0.337 0.275 HA2147 gSSR NA CCCCATAAACATTTCACACCC CCTGAGAAATCGGTAGATAGTG 4 0.000 0.592 0.523
Total 83 0.208 14.754 12.28
Mean 2.6 0.007 0.461 0.384
z