ISSN 0445-4650(Print), ISSN 2289-0904(Online)
182
JOURNAL OF KOREAN FOREST SOCIETY ISSN 0445-4650(Print), ISSN 2289-0904(Online) http://e-journal.kfs21.or.kr
ISSR 분석에 의한 전나무 집단의 유전변이
김영미1·홍경낙1*·이제완1·양병훈2
1국립산림과학원 산림유전자원과, 2산림청 산림환경보호과
Genetic Variation of Abies holophylla Populations in South Korea Based on ISSR Markers
Young-Mi Kim
1, Kyung Nak Hong
1*, Jei Wan Lee
1and Byeong-Hoon Yang
21Division of Forest Genetic Resources, Korea Forest Research Institute, Suwon 441-350, Korea
2Forest Environment Conservation Division, Korea Forest Service, Daejeon 302-701, Korera
요 약: ISSR 표지를 이용하여 전나무 6개 집단의 유전다양성과 유전구조를 분석하였다. 6개 ISSR primer로 유전다 양성을 추정한 결과, 집단별 다형성 유전자좌의 비율은 평균 85.6%, 이형접합도 기대치(He)는 0.288로 나타났다.
AMOVA 결과, 전체 유전변이에서 5.6%는 집단간, 94.4%는 집단내 개체간 차이에 기인하는 것으로 나타났다. 베이 즈 추론에 근거한 유전분화는 θII와 GST가 각각 0.045, 0.038로, 근연교배 정도는 0.509로 추정되었다. Mental 검증에 서 집단간 지리적 거리가 멀수록 유전적으로 상이한 것으로 판명되었다(r = 0.74, P < 0.05). UPGMA 방법과 PCA 결 과에 따라서 남원, 청도, 문경 집단을 한 군집으로, 인제, 홍천, 평창 집단을 다른 군집으로 나눌 수 있었다. 베이즈 군집분석에서는 유전변이 분포에 따라서 남원, 문경 집단이 한 군집으로 인제, 홍천, 평창, 청도 집단이 다른 한 군 집으로 묶여서 2개의 상위 군집으로 나뉘었다. 빈도주의 분석에 따른 ‘군집’을 반영한 AMOVA 결과에서 전체 유전 변이의 3.9%를 군집의 영향으로 설명할 수 있었으며, 전나무 집단의 지리적 분포는 베이즈 분석보다는 UPGMA 방 법에 의한 구분과 일치하는 것으로 나타났다.
Abstract: Genetic diversity and genetic differentiation in six natural populations of Abies holophylla Max were investigated using ISSR marker system. From 6 ISSR primers, the average percentage of polymorphic loci was 85.6%, and the average expected heterozygosity (He) was 0.288. From the result of AMOVA, 94.4% of total genetic variation came from the differences among individuals within populations, and 5.6% was caused by those of among- populations. On the basis of Bayesian inference, genetic differentiation (θII and GST) and inbreeding coefficient for all populations were 0.045, 0.038, and 0.509, respectively. The correlation between genetic distance and geographical distance was highly significant at the Mental’s test (r = 0.74, P < 0.05). Six populations divided into two groups according to the results of UPGMA and PCA. One group included Namwon, Cheongdo and Mungyeong population.
The other was Inje, Hongcheon and Pyeongchang population. Also, in Bayesian clustering analysis, 6 populations were divided into two clusters. But Cheongdo population was assigned into the other cluster unlike those of UPGMA or PCA. Taking the regions based on the results of the cluster analysis into consideration of AMOVA, 3.9% of genetic variation came from the regional difference. The dendrogram from UPGMA could provide the most genetically reasonable explanation for the distribution of Abies holophylla populations in South Korea.
Key words: Abies holophylla, ISSR, genetic diversity, genetic differentiation, AMOVA, Bayesian inference
서 론
유전자원 보존전략의 방법으로서 서식지나 개체를 그 대로 보호하는 현지내 보존 방법은 자연적 진화과정을 지 속시키고 주변환경과의 상호작용으로 얻어질 수 있는 형 질의 보전을 가능하게 한다(Finkeldey and Gregorius,
1994). 유전자원의 보존에 있어서 유전다양성은 변화하는 미래환경에 대한 적응성을 높이고 불확실성에 대비할 수 있는 바탕인데, 환경의 변화는 희귀수종 뿐 만 아니라 일 반수종의 생존에도 위협요인이 되고 있다(Humphries et al., 1995; Pimm, 2008). 따라서 현재 보고된 희귀수종 뿐 만 아니라 미래의 유전자원 소실에 대비하기 위하여 일반 수종에 대한 유전다양성 보존도 필요하다(Falk, 1991;
Jump and Penuelas, 2005; Lynch, 1996).
*Corresponding author
E-mail: [email protected]
전나무속(Abies)은 백악기(약 1억 3,500만~6,500만 년 전)부터 지금까지 출현한 수종으로 전 세계적으로 북반구 에 약 48여 종이 분포하며, 우리나라에는 전나무(Abies holophylla Maxim), 구상나무(A. koreana Wilson), 분비나 무(A. nephrolepis Maxim)의 3가지 종류가 자생하고 있다 (Lee, 1987). 전나무는 중국, 우수리 지역과 우리나라 북부 지방 전역과 중부 및 남부지방의 해발 300-1,400 m 산지 에 널리 분포하고 있다(Cho, 1989). 음수로서 초기 생장이 느린 전나무는 천이의 극상을 이루는 생태적 특성이 있으 며, 천연하종 갱신도 가능한 용재수(KFRI, 1992)로서 2013 년 산림청 권장조림수종 중 하나이다. 전나무는 재질이 우 수한 개체의 선발과 증식 뿐 만 아니라 유전자원에 대한 보존과 지속가능한 이용이 요구되는 수종이다. 전나무 집 단의 보존과 지속가능한 이용을 위해서는 유전다양성 유 지를 위한 유전자원보존전략의 수립과 육종계획이 요구 되며, 이는 자원의 탐색과 평가가 선행되어야 가능할 것 이다(National Research Council, 1991).
전나무속의 구상나무와 분비나무에 대한 ISSR 표지 분 석(Lee et al., 2008)과 더불어 전나무 유전변이 연구에는 동위효소를 이용한 국내 15개 전나무 집단의 유전변이 분 석(Ahn, 1997)과 7개 집단의 RAPD 분석(Kim and Hyun, 1999)이 보고되어 있다. 1960년대부터 임목의 유전변이 연 구에 이용되었던 동위효소 표지는 공우성 표지로서 대립 유전자의 유전형을 관찰 할 수 있는 장점이 있는 반면 이 용가능한 동위효소의 제한으로 다수의 유전자좌를 확보 하기 곤란한 단점이 있다(Zhang et al., 1993). ISSR 표지 는 대상 종에 대한 염기서열 정보를 필요로 하지 않을 뿐 아니라 RAPD 표지에 비해 증폭산물수가 많고, 비교적 높 은 재결합온도를 사용하여 재현성이 우수하기 때문에 임 목의 집단 유전변이 분석에 쉽게 이용되고 있다(Wolfe and Liston, 1998). 그러나 ISSR 표지는 우성표지로서 하디-바 인베르그 평형을 가정하고 동형접합체 비율로부터 이형 접합도 기대치를 산출하게 됨으로써 Wright의 F 통계량 적용이 어려운 단점이 있다(Lynch and Milligan, 1994).
이러한 우성표지가 갖는 한계를 조정하고 집단 유전분화 량을 구명하기 위하여 베이즈 추론을 이용한 분석법이 적 용되고 있다(Holsinger et al., 2002).
본 연구에서는 전나무의 현지내 유전자원 보전전략 수 립을 위한 기초 자료를 제공하기 위하여, ISSR 표지를 이 용하여 우리나라에 분포하는 전나무 자연집단의 유전다 양성과 유전분화량을 구명하였다.
재료 및 방법
1. 시료 채취 및 표지자 분석
조사지는 강원도 인제, 홍천, 평창, 경상북도 문경, 청도,
전라북도 남원 등 국내 자생하는 6개 전나무 집단을 선정 하였으며(Figure 1), 집단내 시료채취는 개체목간의 간격 을 최소 30 m 이상을 유지하며 집단당 20개체에서 침엽 을 채취하였다.
채취된 침엽 시료에서 DNeasy Plant Mini Kit (Qiagen, USA)를 이용하여 total DNA를 추출하였다. PCR 반응용 액은 10 ng total DNA, 0.6U Taq DNA polymerase (KisanBio, KS-T0120), 1X reaction buffer, 각 0.1 mM dNTPs, 0.0025% BSA, 1.5 mM MgCl2, 0.375 µM ISSR primer를 첨가하여 총 20 µL로 조성하였다. 예비실험에서 재현성이 우수하고 다형성을 보이는 6개 primer(#813,
#815, #820, #824, #840, #857; UBC Primer Set No.
9, Biotechnology Laboratory in University of British Columbia)를 선발하여 본 실험에 사용하였다.
PCR 실행은 ISSR primer의 GC 함량에 따라 결합온도 를 50~54oC에서 조정하였으며, 94oC에서 5분간 초기 변 성시킨 후, 94oC 30초, 50~54oC 30초, 72oC 60초의 과정 을 44회 반복하고, 72oC에서 10분간 최종 증폭시켰다.
PCR 증폭산물은 2% agarose gel에서 전기영동 하였다.
ISSR band의 존재 유무에 따라 입력 자료를 정리하고, 유 전통계 분석에 이용하였다.
2. 통계자료 분석
유효대립유전자 수(Ae), 이형접합도 기대치(He), Shannon 의 유전다양성지수(I), 그리고 베이즈 추론을 근거로 한 이 형접합도 기대치(hs)등 집단별 유전다양성을 GenAlEx Figure 1. Location of six Abies holophylla populations in Korea.
v6.41(Peakall and Smouse, 2006), Hickory(Holsinger et al., 2002) 및 ABC4F 프로그램(Foll et al., 2008)을 이용 하여 계산하였다. 또한 AMOVA 분석으로 집단간 유전변 이량(ϕST)과, 베이즈 추론의 최적 모델을 근거로 한 유전 분화 수치(θII, GST)를 추정하였으며, Mantel test로 집단간 지리적 거리와 유전적 거리에 따른 상관관계를 검증하였 다. 집단간 유연관계를 구명하기 위하여 Nei의 유전적 거 리를 이용한 주성분분석과 UPGMA 방법으로 군집분석을 실시하였으며, STRUCTURE 프로그램(Pritchard et al., 2000)을 이용하여 베이즈 군집분석과 군집별 개체의 할당 비율을 확인하였다.
결 과
1. 전나무의 유전다양성
전나무 집단의 유전변이 분석에 사용된 6개의 ISSR primer에서 총 38개의 band를 확인하였으며, 이 중 다형성 ISSR band는 30개로 primer당 평균 5.0개의 다형성 증폭 산물이 확인되었다. 집단별 다형성 유전자좌의 비율(%P) 은 평균 85.6%로 남원 집단과 청도 집단이(90.0%)이 가장
높고, 문경 집단(80.0%)이 가장 낮게 조사되었다(Table 1).
유전변이량은 평균 유효 대립유전자 수(Ae)가 1.5개, 이형 접합도 기대치(He)는 0.288, Shannon의 유전다양성 지수 (I)는 0.429로 산출되었다. 빈도주의(frequentist) 분석의 세 가지 통계량에서 인제 집단의 유전다양성(Ae=1.561, I=
0.469, He=0.319)이 가장 높게 나타났다. 베이즈(Bayesian) 추론에 의한 이형접합체 빈도(hs)는 청도 집단이(0.297)이 가장 높고, 홍천 집단(0.281)이 가장 낮게 조사되었으며, 이형접합체 빈도 평균은 0.295로 빈도주의 분석과 유사한 수준이었다(Table 1). 빈도주의 통계와 베이즈 추론에서 확인된 유전다양성은 유사한 경향을 보이며, 집단의 유전 다양성은 인제 집단을 포함한 남원, 청도집단이 비교적 높 고, 문경, 평창, 홍천 집단에서 낮은 경향을 보였으나 집단 간에 유의한 차이는 없었다.
2. 전나무 집단의 유전분화
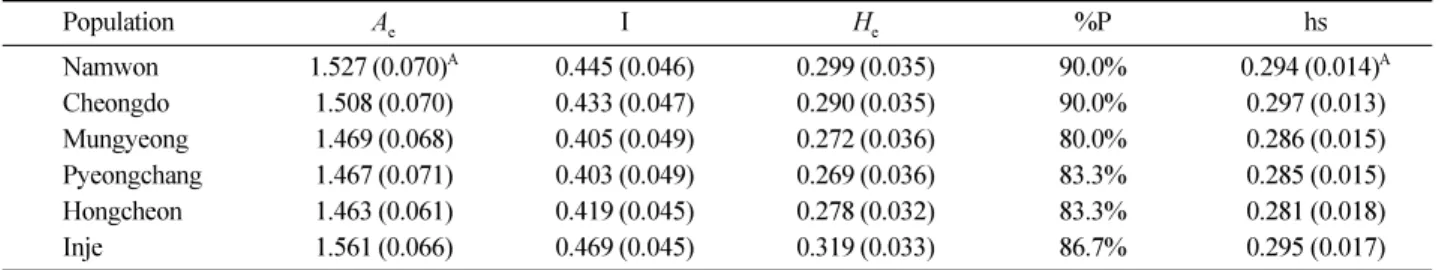
전나무 6개 집단에 대한 AMOVA 분석 결과 전체 유전 변이의 94.4%는 집단내 개체간 차이에 기인하며, 집단간 차이는 5.6%로 나타났다(Table 2). 베이즈 추론을 이용한 전나무의 유전구조 구명에서 최적 모델은 편차정보기준 Table 1. Genetic diversity index from ISSR marker analysis of Abies holophylla populations in Korea. Ae, I, He and %P are the number of effective alleles, Shannon’s Information index, the expected heterozygosity, and the percentage of polymorphic loci, respectively. hs is the average heterozygosity within population from Bayesian computation including MCMC with a burn-in of 50,000 and a sampling run of 250,000 iterations (Holsinger et al., 2002). The standard deviation is in parenthesis.
Population Ae I He %P hs
Namwon 1.527 (0.070)A 0.445 (0.046) 0.299 (0.035) 90.0% 0.294 (0.014)A
Cheongdo 1.508 (0.070) 0.433 (0.047) 0.290 (0.035) 90.0% 0.297 (0.013)
Mungyeong 1.469 (0.068) 0.405 (0.049) 0.272 (0.036) 80.0% 0.286 (0.015)
Pyeongchang 1.467 (0.071) 0.403 (0.049) 0.269 (0.036) 83.3% 0.285 (0.015)
Hongcheon 1.463 (0.061) 0.419 (0.045) 0.278 (0.032) 83.3% 0.281 (0.018)
Inje 1.561 (0.066) 0.469 (0.045) 0.319 (0.033) 86.7% 0.295 (0.017)
Table 2. Results of the AMOVA (analysis of molecular variance) for 6 Abies holophylla populations in Korea.
Source df SS MS Est. Var. %
Without regions
Among Pops 5 44.133 8.827 0.240 5.6%
Within Pops 114 459.900 4.034 4.034 94.4%
Total 119 504.033 4.274 100.0%
Regions based on UPGMA
Among Regions 1 16.867 16.867 0.168 3.9%
Among Pops 4 27.267 6.817 0.139 3.2%
Within Pops 114 459.900 4.034 4.034 92.9%
Total 119 504.033 4.341 100.0%
Table 3. Coefficients of inbreeding and genetic differentiation, and DIC calculations under four alternative models in Bayesian computation (Foll et al., 2008) of Abies holophylla populations in Korea. The standard deviation is in parenthesis.
Model f θII pD DIC
full f=0
=0 f free
0.509(0.270) - 0.744 (0.184) 0.502 (0.289)
0.045 (0.012) 0.035 (0.009)
- 0.083 (0.022)
621.2 620.2 760.5 631.5
539.6 529.3 733.3 503.8
81.6 90.9 27.1 127.7
702.8 711.1 787.6 759.2
D Dˆ
(DIC)이 가장 낮은 경우로써 근친교배와 유전분화를 모두 가정한 Full 모델이었다. 이러한 Full 모델에서 근친교배 율은 0.509이며, 집단간 유전분화는 θII가 0.045, GST가 0.038로 비교적 낮은 분화율을 보이고 있다(Table 3). 각 추정 모수에 대한 시료가 제공하는 정보량(IE)에 근거했을 때 Full 모델은 근친교배율(IE=0.012) 추정보다는 집단의 유전분화(IE=1.480) 추정에 더 적합한 것으로 판단된다(Foll et al., 2008).
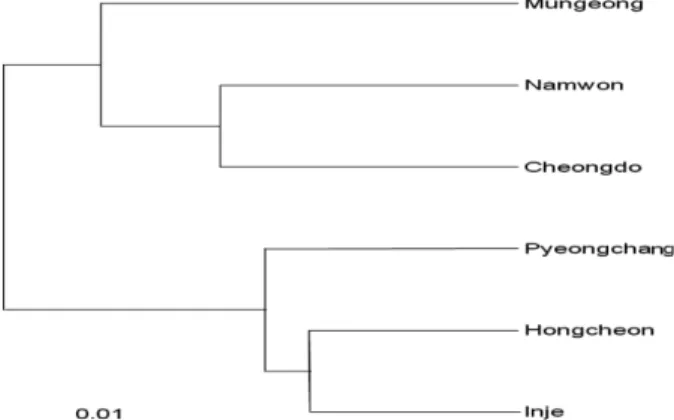
집단간 지리적 거리와 유전적 거리를 비교한 Mantel 검 증에서 두 인자간에 상관성이 나타나서(r=0.74, P < 0.05), 집단간 지리적 거리가 멀수록 유전적으로 상이한 집단이 분포하는 것으로 판단된다. UPGMA 분석에서도 남원-청 도-문경 집단의 제1군집과 인제-홍천-평창 집단의 제2군 집으로 구분되어 집단의 유전적 관계에 따른 지리적 분포 를 보여주고 있다(Figure 2). 주성분 분석에서는 전체 변 이의 85.5%를 상위 3개 주성분(PC1=45.1%, PC2=24.3%, PC3=16.1%)이 설명하였으며, UPGMA 분석과 마찬가지 로 제1주성분을 기준으로 남원-청도-문경 집단의 제1군집 과 인제-홍천-평창 집단이 속한 제2군집으로 구분되었으 며, 문경 집단의 경우 제1군집에 속하지만 남원과 청도 집
단과 유전적 거리가 상대적으로 크게 나타났다(Figure 3).
베이즈 군집 분석을 위한 최적군집수는 Evanno 등(2005) 의 방법에 따라서 2개 군집으로 계산되었으며, 최적군집 수(K=2) 조건에서 남원-문경 집단의 제1군집과 청도-홍천 -평창-인제 집단이 속한 제2군집으로 배정되었다(Table 4).
고 찰
전나무 집단의 평균 유전다양성은 유효대립인자 수(Ae) 가 1.5개, 이형접합도 기대치(He)는 0.288, Shannon의 유 전다양성 지수(I)는 0.429, 집단별 다형성 유전자좌의 비 율(%P)은 85.6%, 베이즈 추론의 이형접합체 빈도(hs)가 0.295로 확인되었다. 수목에서의 유전변이는 생육기간, 교 배양식을 비롯하여 유전자 이동에 영향을 미치는 종자 비 산 및 화분 산포 특성, 분포지 환경과 천이단계 등 생태적 특성과 관계가 있는 것으로 알려져 있다(Hamrick et al., 1992; Nybom and Bartish 2000; Nybom, 2004). 국내 전 나무집단의 이형접합도는 타가교배양식(He=0.27)과 바람 에 의해 종자가 비산되는 식물의 평균(He=0.27)보다 약간 높게 나타났다(Nybom, 2004). 또한 동위효소 표지를 이용 한 국외의 전나무속 A. alba(He=0.136; Matusova, 1995), A. alba (He=0.269; Mejnartowicz, 2004), A. balsamea (He=0.025; Shea and Furnier, 2002), A. cephalonica (He=0.239; Fady and Conkle 1993), A. lasiocarpa (He= 0.129; Ettl and Peterson 2001)의 유전다양성보다 높게 나 타났다. 그러나 ISSR 이나 RAPD 표지 등 우성표지로 유 전다양성을 추정한 경우 일반적으로 동형접합체만을 갖 는 유전자좌는 분석에서 제외되기 때문에 동위효소 분석 결과 보다 높은 경향이 나타난다(Wu et al., 2000; Nybom and Bartish, 2000). 국내 전나무 집단의 연구에서도 이 같 은 경향이 나타나는데 Ahn(1997)은 동위효소 분석으로 52.0%(%P)와 0.148(He)의 유전다양성을 보고하였고, Kim 과 Hyun(1999)은 71.9%(%P)의 유전다양성을 보고하였다.
국내에 분포하는 전나무는 근연수종인 분비나무 (He=0.204)와 구상나무(He=0.237; Lee et al., 2008) 보다 Figure 2. Dendrogram by UPGMA method using Nei’s
genetic distance of Abies holophylla populations in Korea.
Figure 3. Biplot of principal component analysis of Abies holophylla populations in Korea. The PC 1 as x-axis and the PC 2 as y-axis explained 45.1% and 24.3% of total variation, respectively.
Table 4. Membership proportions of each Abies holophylla population assigned into two Bayesian clusters by the results of STRUCTURE (Prichard et al., 2000) in Korea.
Cluster 1 Cluster 2 Number of individuals
Namwon 0.310 0.689 20
Mungyeong 0.249 0.751 20
Cheongdo 0.517 0.483 20
Pyeongchang 0.618 0.382 20
Hongcheon 0.565 0.435 20
Inje 0.618 0.382 20
높은 유전다양성을 보유하고 있다. 집단의 생성기원이나 지리적 분포 특성, 교배양식은 집단내 유전변이에 영향을 미치는 요소인데, 분포범위가 넓고 연속적인 수종의 집단 내 유전다양성이 높게 나타나는 경향이 있다(Hamrick et al., 1992). 구상나무는 덕유산 이남의 남부지역 해발 1,000m 이상, 분비나무는 북부 지방에서 중부이남에 이르 는 지역의 해발 700m 이상 고산에 제한적으로 분포하는 데 비하여(Lee, 1987; Yoo, 2002), 전나무는 전국 고산에 주로 분포하지만 해발 300m 정도의 저지대 산지에도 일 부 자라고 있다. 따라서 분포범위가 제한된 분비나무와 구 상나무에 비하여 분포범위가 넓은 전나무의 유전다양성 이 높은 것은 언급한 일반적 경향과 일치한다.
국내 전나무 집단의 유전분화정도(φST=0.056)는 분비나 무의 ISSR 표지 결과(φST=0.041; Lee et al., 2008)보다 약 간 높았으며, Wright의 F 통계량과 비교되는 전나무의 θII(0.045)도 nSSR 표지를 이용한 분비나무 분석결과 (FST=0.039; Hong et al., 2011)보다 높았다. 그러나 언급된 연구들의 분비나무 집단은 한반도 중부 이남의 분포지가 누락된 중부 이북의 강원도를 중심으로 조사되어 유전분 화의 과소치가 발생할 우려가 있다(Coart et al., 2005). 한 편 구상나무 집단의 RAPD 표지 분석(FST=0.081; Kim and Hyun, 2000)이나 nSSR 표지 분석(FST=0.063; Hong et al., 2011)보다는 낮게 나타났다. 국외 전나무속 수종의 동위효소 표지 분석결과와 비교하면, A. alba(FST=0.015;
Matusova, 1995), A. balsamea(FST=0.037; Shea and Furnier, 2002), A. lasiocarpa(FST=0.031; Ettl and Peterson, 2001)의 결과보다 약간 높았으나, A. alba(FST=0.223; Mejnartowicz, 2004)나 A. cephalonica(FST=0.048; Fady and Conkle, 1993) 비해 낮게 나타났다.
일반적으로 ISSR 표지 분석 결과가 RAPD나 AFLP 표 지에 비하여 집단간 유전분화 수치가 약간 크게 나타나는 경향이 있지만(Nybom, 2004), 국내 전나무 집단은 ISSR 표지(φST=0.056)보다 RAPD 표지(φST=0.198; Kim and Hyun, 1999)에서 보다 높은 유전분화를 나타냈다. 국내 전 나무 집단의 유전분화는 우성표지자를 이용하여 추정된 타가교배 양식(φST=0.27, GST=0.22)과 바람에 의해 종자가 비산되는 식물의 평균(φST=0.25, GST=0.17), 광역분포 식물 평균(φST=0.34, GST=0.31)보다 낮게 나타났다(Nybom, 2004).
전나무의 집단간 지리적 거리와 유전적 거리간에 상관 성이 있으며, UPGMA 군집분석뿐 아니라 주성분분석에 서도 남원-청도-문경 집단의 제1군집과 인제-홍천-평창 집 단의 제2군집으로 구분되어 집단의 유전적 근연성과 지리 적 근접성이 일치하는 것으로 나타났다. 그러나 베이즈 군 집 분석에서는 이와 다른 군집 구조가 확인되었다. 빈도 주의 분석과 베이즈 군집분석에서 확인된 국내 전나무 집
단은 2개의 군집으로 구분되고 있으나, 각 분석법에 따라 청도 집단이 속하는 군집이 다르게 나타나고 있다. Kim and Hyun(1999)은 국내 전나무 집단을 태백산맥 지역(설 악산, 태백산, 가리왕산)과 소백산맥 지역(지리산, 덕유산, 속리산)으로 구분하여 UPGAM 분석과 주성분분석의 결 과와 일치하였으나, Ahn(1997)은 청도 집단이 강원지역에 속한 집단과 같은 그룹에 포함되어 본 연구의 베이즈 군 집 분석과 유사한 결과를 보여주고 있다. 청도 집단은 베 이즈 군집 분석에 의한 집단의 상위군집 할당 비율을 보 았을 때, 다른 집단에 비하여 제1 및 제2 군집에 속하는 비율의 차이가 크지 않았다(Table 4). 또한 빈도주의 분석 법으로 확인된 군집과 베이즈 군집분석(data not shown)으 로 확인된 군집을 ‘지역’으로 설정하고, 개체-집단-지역의 세 수준의 AMOVA 분석에서 전체 변이량중 지역간 차이 는 3.90%로 나타나서 두 경우에 차이가 없었다(Table 2).
따라서 우리나라 전나무 집단은 빈도주의 분석법에 따라 남원, 문경 청도 집단의 한 군집과 홍천 평창 인제 집단이 속한 군집의 유전형상이 다른 2개의 상위 군집으로 구분 되는 것이 보다 타당한 것으로 판단된다.
생물다양성 보존과 지속가능한 이용을 위한 현지내 보 존집단을 선정하는데 있어서, 수종이 보유하고 있는 유전 변이의 분포양상과 정도를 적절히 보존하기 위해서는 유 전다양성 지수의 고려뿐 아니라 유전형상이 다른 상위 군 집 수준에서 현지내 보존 집단을 선정하는 것이 중요하다 (Rossetto, 2006). 따라서 국내 전나무 집단의 현지내 보존 집단을 선정하는데 있어서 유전형상이 다른 각각의 상위 군집에서 유전다양성의 높은 집단을 선정하는 것이 적합 할 것으로 판단된다. 결과적으로 국내 전나무 집단은 군 집분석에서 남원-문경-청도 집단이 속한 제1군집과 홍천- 평창-인제 집단이 속한 제2군집으로 유전형상이 구분되며, 각 군집에서는 남원 집단과 인제 집단에서 가장 높은 유 전다양성이 확인되어, 국내 전나무 집단의 유전다양성과 유전구조를 근거로 판단하였을 때, 남원 집단과 인제 집 단이 현지내 보존집단으로 우선 고려될 수 있다. 아울러 산림유전자원의 현지내 보존 집단의 선정에서는 유전다 양성이나 생물종 분포, 대상종의 생육 상태 등 생물학적 가치뿐 아니라 경관적 가치나 현지내 보존을 위한 관리 여건 등의 무생물적 요소도 중요한 판단기준으로 감안해 야 할 것이므로(Palsboll et al., 2006), 유전다양성과 더불 어 이들에 대한 고려도 병행되어야 할 것이다.
References
Ahn, J.K. 1997. Needle characteristics and genetic variation of Abies holophylla populations in South Korea based on Isozyme, pp. 40, 47, 58. Ph. D. Dissertation. Kyungpook National University. Daegu, Korea (in Korean).
Cho, M.H. 1989. Coloured wood plants of Korea, p. 198.
ACADEMY Publishers. Seoul, Korea. (in Korean) Coart, E., Glabeke, S.V., Petit, R.J., Bockstaele, E.V., and
Roldan-Ruiz, I. 2005. Range wide versus local patterns of genetic diversity in hornbeam (Carpinus betulus L.). Con- servation Genetics 6: 259-273.
Ettl, G. and Peterson, D. 2001. Genetic variation of subalpine fir (Abies lasiocarpa) in the Olympic Mountains, WA, USA.
Silvae Genetica 50: 145-153.
Evanno, G., Regnaut, S., and Goudet, J. 2005. Detecting the number of clusters of individuals using the software STRUCTURE: a simulation study. Molecular Ecology 14:
2611-2620.
Fady, B. and Conkle, M. 1993. Allozyme variation and possi- ble phylogenetic implications in Abies cephalonica Lou- don and some related eastern Mediterranean firs. Silvae Genetica 42: 351-359.
Falk, D.A. 1991. Joining biological and economic models for conserving plant genetic diversity, p. 209-223. In: D.A. Falk, and K.E. Holsinger, ed. Genetics and Conservation of Rare Plants. Oxford University Press. London, U.K.
Finkeldey, R. and Gregorius, H.R. 1994. Genetic resources:
Selection criteria and design, p. 322-347. In: Z.S. KIM, H.H.
Hattemer, ed. Conservation and Manipulation of Genetic Resources in Forestry. Kwang Moon Kag. Seoul, Korea.
Foll, M., Beaumont, M.A., and Gaggiotti, O. 2008. An approxi- mate Bayesian computation approach to overcome biases that arise when using amplified fragment length polymor- phism markers to study population structure. Genetics 179:
927-939.
Hamrick, J., Godt, M., and Schierwater, S. 1992. Factors influenc- ing levels of genetic diversity in woody plant species. pp.
95-124. In: W. Adams et al., ed. Population Genetics of Forest Trees. Kluwer Academic Publichers. New York, U.S.A.
Holsinger, K.E., Lewis, P.O., and Dey, D.K. 2002. A Baye- sian approach to inferring population structure from dom- inant markers. Molecular Ecology 11: 1157-1164.
Hong, Y.P., Ahn, J.Y., Kim, Y.M., Yang, B.H., and Song, J.H.
2011. Genetic variation of nSSR markers in natural popu- lations of Abies koreana and Abies nephrolepis in South Korea. Journal of Korean Forest Society 100: 577-584.
Humphries, C.J., Williams, P.H., and Richard, I.V.W. 1995.
Measuring biodiversity value for conservation. Annual Review of Ecology and Systematics 26: 93-111.
Jump, A.S. and Penuelas, J. 2005. Running to stand still:
Adaptation and the response of plants to rapid climate change. Ecology Letters 8: 1010-1020.
KFRI(Korea Forest Research Institute). 1992. Dendrology.
Korea forest service. Daejeon, Kora. pp. 562 (in Korean).
Kim, I.S. and Hyun, J.O. 1999. Genetic variation in the natu- ral population of Abies holophylla Max. based on RAPD analysis. Journal of Korean Forest Society 88(3): 408-418.
Lee, S.W., Yang, B.H., Han, S.D., Song, J.H., and Lee, J.J. 2008.
Genetic variation in natural populations of Abies nephrol- epis Max. in South Korea. Annual Forest Science 65(302):
1-7.
Lee, T.B. 1987. Dendrology. Hyangmoon Pub. Co. Seoul. Korea, pp. 331 (in Korean).
Lynch, M. and Milligan, B.G. 1994. Analysis of population genetic structure with RAPD markers. Molecular Ecol- ogy 3: 91-99.
Lynch, M. 1996. A quantitative-genetic perspective on conserva- tion issues. pp. 471-501, In: J.C., Avise and J.L Hamrick, ed.
Conservation Genetics: Case Histories from Nature. Klu- wer Academic Publichers. New York, U.S.A.
Matusova, R. 1995. Genetic variation in 5 populations of sil- ver fir (Abies alba Mill.) in Slovakia. Bratislava 50: 53- 59.
Mejnartowicz, L. 2004. Genetic analysis of Silver-fir popula- tions in the North Carpathian and Sudeten Mountains.
Acta Societatis Botanicorum Poloniae 73(4) : 285-292.
National Research Council. 1991. Managing Global Genetic Resources. National Academy Press. Washington. D.C, U.S.A. pp. 228.
Nybom, H. and Bartish, I.V. 2000. Effects of life history traits and sampling strategies on genetic diversity esti- mates obtained with RAPD markers in plants. Perspec- tives in Plant Ecology, Evolution and Systematics 3: 99- 114.
Nybom, H. 2004. Comparison of different nuclear DNA markers for estimation intraspecific genetic diversity in plants.
Molecular Ecology 13: 1143-1155.
Peakall, R. and Smouse, P.E. 2006. GENALEX 6: Genetic analysis in Excel. Population genetic software for teach- ing and research. Molecular Ecology Note 6: 288-295.
Pimm, S.L. 2008. Climate change or large habitat loss-which will kill more species. Current Biology 18: 117-119.
Palsboll, P.J., Berube, M., and Allendorf, F.W. 2006. Identifi- cation of management units using population genetic data.
TRENDS in Ecology and Evolution 22(1): 11-16.
Pritchard, J.K., Stephens, M., and Donnelly, P. 2000. Infer- ence of population structure using multilocus genotype data. Genetics 155: 945-959.
Rossetto, M. 2006. Impact of habitat fragmentation of plant populations. pp. 117-129. In: J. Henry, ed. Plant Conser- vation Genetics. Haworth Press. New York, USA.
Shea, K.L. and Furnier, G.R. 2002. Genetic variation and population structure in central and isolated populations of balsam fir, Abies balsamea (Pinaceae). American of Jour- nal Botany 89: 783-791.
Wolfe A.D. and Liston, A. 1998. Contributions of the poly- merase chain reaction to plant systematics, pp. 203-236.
In: E.D. Soltis, P.S. Soltis, J.J. Doyle, ed. Molecular Sys- tematics of Plants. II. DNA Sequencing. Kluwer Aca- demic Publishers, New York, U.S.A.
Wu, J., Krutovskii, K.V., and Strauss, S.H. 2000. Nuclear DNA diversity, population differentiation, and phylogenetic rela- tionships in the California closed-cone pines based on RAPD and allozyme markers. Genome 42: 893-908.
Yoo, Y.H. 2002. Distribution of evergreen coniferous trees and environmental factor, pp. 35-36. M. S. Thesis. Kyunghee Uni- versity. Seoul, Korea (in Korean with English abstract).
Zhang, Q., Maroof, M.A., and Kleinhofs, A. 1993. Compara- tive diversity analysis of RFLPs and isozymes within and among populations of Hordeum vulgare ssp. spontaneum.
Genetics 34(3): 909-16.
(2013년 9월 9일 접수; 2014년 5월 27일 채택)