AFLP 마커를 이용한 단양쑥부쟁이 개체군의 유전다양성 보전을 위한 최소개체군의 크기산정
1a김창균2,4․김호준3․최홍근2*
Assessment of the Minimum Population Size for ex situ Conservation of Genetic Diversity in Aster altaicus var. uchiyamae Populations Inferred from AFLP Markers1a
Changkyun Kim2,4, Hojoon Kim3, Hong-Keun Choi2*
요 약
본 연구는 멸종위기식물인 단양쑥부쟁이(Aster altaicus var. uchiyamae)의 개체군을 대상으로 유전다양성을 유지하 는데 필요한 최소개체수를 산정하기 위하여 수행되었다. 단양쑥부쟁이가 분포하고 있는 네 지역에서 각각 유전다양성 및 유전적 분화도를 분석하였다. AFLP(amplified fragment length polymorphism) 마커를 이용한 유전적 변이의 분석 결과, 총 4개의 프라이머 조합에 대해서 936개의 밴드가 확인되었으며, 그 중 934개의 밴드(99.8%)가 다형성을 보여주 었다. 단양쑥부쟁이 개체군 내에서 유전다양성(PPB = 45.3%, h = 0.104, I = 0.168, hs = 0.108)은 높은 수준으로 나타났으며, 개체군 간 유전적 분화도(GST = 0.075, θB = 0.079)는 낮은 수준이었다. AMOVA(Analysis of molecular variance)분석 결과에서도 전체 유전적 변이 중 91%가 개체군 내에서 보이는 반면, 9%는 개체군 간 변이에 기인한 것으로 나타났다. 단양쑥부쟁이 개체군에서 보이는 유전적 특성은 개체군 간의 빈번한 유전자 이동에 기인한 것으로 사료된다. 최대화 전략법에 의하여 경기도 여주일대의 3개 개체군을 대상으로(굴암, 도리섬, 삼합) 개체군 내 최소개체 수를 산정한 결과 도리섬개체군에서는 17개체, 삼합개체군에서는 16개체, 굴암개체군에서는 11개체로 파악되었다.
단양쑥부쟁이 개체군의 최소개체수에 대한 정보는 효율적인 현지 외 보전을 위한 가이드라인을 제시해 줄 수 있다. 주요어: 멸종위기종, 유전적 변이, 유전적 분화, 개체군 구조
1 접수 2011년 4월 14일, 수정(1차: 2011년 8월 31일), 게재확정 2011년 8월 31일 Received 14 April 2011; Revised(1st: 31 August 2011); Accepted 31 August 2011
2 아주대학교 자연과학부 생명과학과 Dept. of Biological Science, Ajou Univ., Suwon(443-749), South Korea 3 한국수자원공사 Korea Water Resources Corporation, Daejeon(426-170), South Korea
4 현주소 Laboratory of Biodiversity and Biogeography, Kunming Institute of Botany, Chinese Academy of Sciences, 132#
Lanhei Road, Kunming, Yunnan(650-204), PR China
a 이 논문은 교육과학기술부의 '생물자원 확보, 관리 및 활용사업(M10867010003)'의 연구비 지원을 받아 연구되었음.
* 교신저자 Corresponding author([email protected])
ABSTRACT
Aster altaicus var. uchiyamae is on the list of endangered species in Korea. Using amplified fragment length polymorphism (AFLP) markers, we investigated the genetic diversity within and among four populations (Guram, Dori Island, Samhap, and Danyang) of A. altaicus var. uchiyamae. We also present the collecting strategies that most efficiently capture the genetic diversity of A. altaicus var. uchiyamae. Four AFLP primer combinations produced a total of 936 bands, of which 934 (99.8%) were polymorphic. A high level of genetic diversity (PPB = 45.3%, h = 0.104, I = 0.168, hs = 0.108) was recognized within the populations of A. altaicus var. uchiyamae. A low degree of genetic differentiation (GST = 0.075, θB = 0.079) was detected among the
populations. In addition, analysis of molecular variance (AMOVA) showed that genetic variation was greater within populations (91%) than among populations (9%). These results indicate that the high rate of gene flow has played an important role in forming the present populations of A. altaicus var. uchiyamae. According to maximization strategy, 17, 16, and 11 individuals captured all of the genetic variation in Dori Island, Samhap, and Guram population, respectively. The determination the minimum population size of A. altaicus var.
uchiyamae in terms of the genetic information is critical and thereby gain reliable decision support for ex situ conservation of the endangered species, A. altaicus var. uchiyamae.
KEY WORDS: SENDANGERED SPECIES, GENETIC VARIATION, GENETIC DIFFERENTIATION, GENE FLOW, POPULATION STRUCTURE
서 론
단양쑥부쟁이(Aster altaicus var. uchiyamae (Nakai) Kitam.)는 이년생 초본으로 이배체(2n = 18)이며, 쑥부쟁이 속(Aster)내 다른 분류군들에 비해 선형의 좁은 잎(< 3㎜)을 보임으로 식별이 가능하다(Chung and Kim, 1997; Chung and Jeong, 1999). 본 식물은 국내 고유종으로 경기도 여주 군, 충청북도 단양군 일대의 하천변 모래땅 또는 자갈로 이 루어진 척박한 환경에서 생육한다(Hyun, 2001). 단양쑥부 쟁이는 환경부 지정 멸종위기 야생동식물 II등급종으로 최 근 하천변의 개발과 댐 건설 등 인간의 간섭에 의하여 많은 자생지가 사라진 상태이다(Hyun, 2001). 현재까지 단양쑥 부쟁이에 대한 연구는 잎, 열매, 화서 등 형태 형질을 이용한 분류학적 연구와 염색체 수에 대한 세포학적 연구 등이 수 행되었을 뿐 유전자원보전의 기준을 제시할 수 있는 개체군 내 또는 개체군 간의 유전다양성(genetic diversity)에 대한 연구는 아직까지 이루어진바 없다(Chung and Kim, 1997;
Chung and Jeong, 1999, 2000).
생물종이나 개체군에서 유전다양성에 대한 연구는 적응 능력이나 유전자 흐름 등 진화요인에 대한 정보를 제공한다 (Hartl and Clark, 1997). 특히 멸종위기 식물종을 보전하기 위해서는 해당 종에 대한 생활사나 생육지 특성 등과 함께 유전다양성에 대한 정보가 중요하다(Frankham et al., 2002). 멸종위기 종의 유전다양성은 개체군의 크기와 높은 상관관계를 보인다(Van Treuren et al., 1991; Kim et al., 2008). 작은 개체군의 경우 유전적 부동(genetic drift)이나 근친교배(inbreeding)에 의하여 쉽게 유전다양성이 줄어들 고, 변화하는 환경에 적응할 수 있는 능력이 감소됨으로 결 국에는 사라지게 된다(Barrett and Kohn, 1991; Ellstrand and Elam, 1993). 따라서 멸종위기 식물 종에 대한 개체군 크기의 감소 원인을 파악하고 보전전략을 수립하기 위해서 는 유전다양성, 개체군 간의 유전적 분화도 및 유연관계 등
을 포함하는 개체군 유전학적 연구가 수행되어야 한다.
멸종위기 종의 현지 외(ex situ) 보전에 대한 중요성이 대두되고 있으며, 자생지에 대한 생태적 특성을 규명하는 연구와 seed banks를 이용한 발아에 대한 연구 등 다각적으 로 진행되고 있다(Washitani et al., 1997; Matsumoto et al., 2000). 또한 유전자원의 현지 외 보전을 위해서는 해상 력있는 분자마커를 이용하여 개체군 내의 유전적 변이에 대한 분석자료를 근거로 적절한 개체군이나 개체수를 결정 하는 연구가 선행되어야 할 것이다(Kim et al., 2009). 현지 외 보전을 위한 최소개체수의 산정은 자생지 개체군의 절멸 을 줄일 수 있을 뿐만 아니라 효율적인 유전자원의 보전을 위해 필요하다(Brown and Briggs, 1991).
본 연구에서는 AFLP(amplified fragment length polymorphism) 마커를 이용하여 국내 단양쑥부쟁이 개체군에 대한 유전다 양성을 분석하고, 개체군 간의 유전적 분화도 및 유연관계 를 파악함으로써, 이 식물의 현지 외 보전을 위한 최소개체 군의 크기(minimum population size)를 산정하고자 한다.
재료 및 방법
1. 재료
경기도 여주군 굴암면, 삼합면, 강천면과 충북 단양군 단양 읍 등 4개 개체군(population), 13개 소개체군(subpopulation) 에서 397개체와 충북 단양군 단양농업기술센터내에 이식 재배중인 7개체를 포함하여 총 404개체를 유전다양성 분석 에 사용하였다(Figure 1). 단양쑥부쟁이 개체군은 대부분 남한강 하천변의 모래와 자갈로 이루어진 척박한 환경에서 생육하고 있었으며, 비수리, 억새, 강아지풀 등이 함께 출현 하였고, 돼지풀, 달맞이꽃 등과 같은 외래 도입종이 확인되 었다. 각 소개체군 별로 줄자를 이용하여 개체간의 거리를 최소 2 m 이상으로 유지하면서 소개체군의 크기에 따라
Figure 1. Locations of four populations of A. altaicus var. uchiyamae in South Korea.
Population Subpopulation SPA N Location
Guram GA 2,900 11 Gyeonggi-do, Yeoju-gun, Gancheon-myeon, Guram-ri
GB 14,500 33
GC 20,000 30
GD 10,000 30
GE 1,000 10
GF 3,900 25
GG 5,000 31
Subtotal 57,300 170
Dori Island CA 9,100 32 Gyeonggi-do, Yeoju-gun, Gancheon-myeon, Dori Island
CB 40,200 90
Subtotal 49,300 122
Samhap SA 8,200 14 Gyeonggi-do, Yeoju-gun, Gancheon-myeon, Samhap-ri SB 5,700 66
SC 500 15
Subtotal 14,400 95
Danyang DG 200 10 Chungcheongbuk-do, Danyang-gun, Danyang-eup
DA ND 7 Danyang Agricultural Technology and Extension Center (cultivar)
Subtotal 200 17
Total 121,200 404
SPA = Subpopulation area(㎡), N = sample size, ND = not determined.
Table1. Geographic information and sampling size of A. altaicus var. uchiyamae populations in Korea
No. Primer pairs Total bands Polymorphic bands Polymorphism (%)
1 E-CAAC/M-ACGT 228 227 99.6
2 E-CACT/M-ACGT 238 237 99.6
3 E-CATG/M-ACTG 234 234 100.0
4 E-CACC/M-ACGT 236 236 100.0
Mean 234.0 233.5 99.8
Total 936 934 –
Table 2. Polymorphic bands obtained with four AFLP primer combinations
10 - 90개체로부터 경엽의 일부를 채취하였다. 각 개체군의 크기와 소개체군 별로 채집된 개체수는 Table 1과 같다.
2. Genomic DNA 추출 및 AFLP 분석
현지에서 채집된 잎으로부터 Genomic DNA prep kit (Solgent, Daejeon, South Korea)를 이용하여 DNA를 추출 한 후, Spectrophotometer(Geneflow, Lichfield, UK)를 사 용하여 정량하였다. AFLP 분석을 위하여 우선 각 소개체군 별로 두 개체를 선별하여 12개의 AFLP 프라이머 조합을 통해 분석한 결과 상대적으로 높은 변이를 보이는 4개의 AFLP 프라이머 조합을 선정하여 AFLP 분석에 사용하였다 (Table 2). 본 연구에서 사용한 AFLP 실험방법은 Kim et al.(2008)과 동일하다.
Populations Subpopulationsa PPB (%) h I hs
Guram GA 24.8 0.073 0.115 0.101
GB 50.5 0.100 0.166 0.100
GC 43.8 0.090 0.147 0.095
GD 57.6 0.119 0.195 0.110
GE 22.6 0.080 0.120 0.103
GF 34.8 0.089 0.141 0.097
GG 49.3 0.111 0.178 0.105
Population level 81.1 0.109 0.184 0.101
Samhap SA 30.0 0.092 0.142 0.104
SB 71.0 0.124 0.207 0.110
SC 50.6 0.130 0.209 0.118
Population level 77.9 0.125 0.211 0.113
Dori Island CA 55.6 0.125 0.202 0.116
CB 88.8 0.151 0.254 0.132
Population level 90.7 0.146 0.246 0.130
Danyang DA 26.8 0.092 0.140 0.112
DG 27.8 0.085 0.132 0.104
Population level 39.4 0.103 0.163 0.113
Mean 45.3 0.104 0.168 0.108
aAbbreviations used for subpopulations are explained in Table 1. PPB = percentage of polymorphic bands, h = Nei's(1973) gene diversity, I = Shannon and Weaver's(1949) index, hs = genetic diversity using Bayesian approach.
Table 3. Genetic diversity within 14 subpopulations and four populations of A. altaicus var. uchiyamae in Korea 3. 자료분석
AFLP 프라이머 조합에 따라 각 size별로 분석된 밴드는 한 유전자좌의 산물로 간주하였고, 밴드의 존재유무에 따라 출현하면 “1”로, 출현하지 않으면 “0”으로 코딩하였다. 자 료행렬로부터 단형성 밴드를 제거한 후 유전적 다양성과 유전적 분화도를 분석하였다. 개체군 또는 소개체군 내의 유전적 다양성은 POPGENE 1.31 프로그램(Yeh et al., 1997)을 이용하여 PPB(percentage of polymorphic bands), Nei’s(1973)의 유전자 다양성(h), Shannon and Weaver’s (1949) index(I)를 구하였으며, 개체군 간 유전적 분화도 (GST)와 유전자 흐름(Nem)을 계산하였다. 또한 Hickory 1.04 프로그램을 이용하여 Bayesian approach에 의한 유전 다양성(hs)과 개체군 간 유전적 분화도(θB)를 계산하였다 (Holsinger and Lewis, 2005). 유전다양성의 개체군 내 또는 개체군 간의 계층적 분포양상은 Arlequin 3.1 프로그램을 이용하여 AMOVA(analysis of molecular variance) 분석을 하였다(Excoffier et al., 2005). 개체군 내 유전다양성 지수 (PPB, h, I, hs)와 개체군의 크기 또는 생육면적과의 상관관 계는 SAS 8.0 프로그램을 이용하여 분석하였다(SAS Institute Inc., 1999). 소개체군 간의 유연관계는 유전적 거 리(pairwise Φst)를 근거로 MEGA 4.1 프로그램을 이용하 여 Neighbour-joining(NJ) 수지도를 작성하였다(Tamura et
al., 2007). 소개체군 간의 유전적 거리와 지리적 거리와의 상관관계는 TFGPA 1.3 프로그램(Miller, 1997)을 이용하 여 5000번 반복을 통한 Mantel test (Mantel, 1967)를 수행 하였다. 현지 외 보전을 위한 최소개체수는 경기도 여주 일 대의 세 개체군(굴암, 도리섬, 삼합)을 대상으로 각 개체군 내에서 95%이상의 빈도를 보이는 다형성밴드만을 분석에 포함하였으며, MSTRAT 프로그램을 이용하여 산정하였다 (Gouesnard et al., 2001).
결 과
1. AFLP 다형성 및 유전다양성
단양쑥부쟁이 개체군의 유전다양성 분석에 사용된 4개의 AFLP 프라이머 조합에서 총 936개의 밴드를 확인하였으 며, 이중 934개(99.8%)에서 다형성을 보여주었다(Table 2).
각 AFLP 프라이머 조합별로 확인된 밴드와 다형성 밴드 수는 비슷한 양상을 보여주었다. 단양쑥부쟁이 개체군의 유 전다양성의 평균은 PPB = 45.3%, h = 0.104, I = 0.168, hs = 0.108로 분석되었다(Table 3). 개체군 내 유전다양성 은 도리섬 개체군에서 가장 높은 변이(PPB = 90.7%; h = 0.146; I = 0.246; hs = 0.130)를 보여주었으며, 단양개체군 에서 가장 낮은 변이(PPB = 39.4%; h = 0.103; I = 0.163;
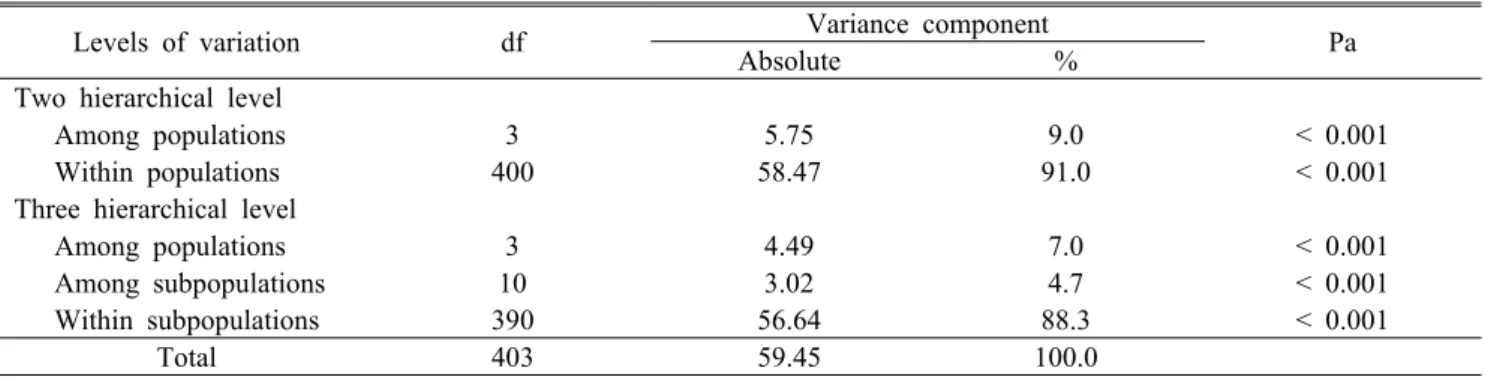
Levels of variation df Variance component
Absolute % Pa
Two hierarchical level
Among populations 3 5.75 9.0 < 0.001
Within populations 400 58.47 91.0 < 0.001
Three hierarchical level
Among populations 3 4.49 7.0 < 0.001
Among subpopulations 10 3.02 4.7 < 0.001
Within subpopulations 390 56.64 88.3 < 0.001
Total 403 59.45 100.0
aLevels of significance are based on 1000 interaction steps.
Table 5. Summary of Analysis of Molecular Variance (AMOVA) for three populations of A. altaicus var.
uchiyamae
Model fa θB DICb
Full 0.999 0.079 31169.6
f=0 0.000 0.051 31235.9
Free 0.483 0.070 31747.0
ainbreeding index within populations; bDeviance information criterion
Table 4. The population differentiation (θB) calculated under three different models using Bayesian approach
Sub-
populations GA GB GC GD GE GF GG SA SB SC CA CB DG
GA – 0.4 0.7 0.8 1.6 1.8 2.2 4.6 4.3 4.0 1.8 2.4 84.6
GB 0.039** – 0.3 0.5 1.4 1.5 1.9 5.0 4.7 4.4 2.2 2.9 85.0
GC 0.051*** 0.010** – 0.3 1.2 1.3 1.8 5.3 5.0 4.7 2.5 3.1 85.3
GD 0.061** 0.022*** 0.018*** – 1.3 1.5 2.0 5.4 5.2 4.8 2.6 3.3 85.4
GE 0.187*** 0.120*** 0.143*** 0.082*** – 0.3 0.7 6.2 5.9 5.6 3.4 4.1 86.2
GF 0.150*** 0.108*** 0.123*** 0.081*** 0.109*** – 0.5 6.3 6.1 5.8 3.6 4.2 86.3
GG 0.116*** 0.083*** 0.085*** 0.048*** 0.078*** 0.085*** – 6.8 6.5 6.2 4.0 4.6 86.8
SA 0.189*** 0.126*** 0.136*** 0.095*** 0.146*** 0.133*** 0.073*** – 0.3 0.6 2.4 3.0 80.0
SB 0.142*** 0.100*** 0.109*** 0.064*** 0.103*** 0.091*** 0.054*** 0.033*** – 0.3 2.1 2.7 80.3
SC 0.148*** 0.110*** 0.119*** 0.061*** 0.104*** 0.115*** 0.055*** 0.071*** 0.046*** – 1.8 2.4 80.6
CA 0.168*** 0.123*** 0.131*** 0.104*** 0.145*** 0.148*** 0.112*** 0.120*** 0.094*** 0.103*** – 0.5 81.5 CB 0.143*** 0.110*** 0.116*** 0.095*** 0.135*** 0.138*** 0.106*** 0.113*** 0.098*** 0.093*** 0.015** – 81.9 DG 0.261*** 0.175*** 0.193*** 0.135*** 0.189*** 0.191*** 0.113*** 0.148*** 0.074*** 0.086*** 0.138*** 0.131*** – aAbbreviations used for subpopulations are explained in Table 1. **, 0.01 < P < 0.001; ***, P < 0.001.
Table 6. Genetic distance matrix based on AFLP markers using pairwise estimated values of Φst (below diagonal) and geographical distances (above diagonal) between 13 subpopulations of A. altaicus var. uchiyamae hs = 0.113)를 나타내었다(Table 3). 한편 굴암, 도리섬, 삼
합개체군 내 소개체군 수준에서의 유전다양성은 비교적 넓 은 변이의 폭을 보여주었다. 예를 들어 굴암개체군 내 7개 소개체군의 유전다양성(PPB)의 경우 소개체군 GA에서는 24.8%를 보인 반면 소개체군 GD에서는 57.6%의 변이를 나타내었다. 단양개체군에서는 소개체군 DG(26.8%)와 단양 농업기술센터내에 이식하여 재배중인 소개체군 DA(27.8%) 간에는 비슷한 유전다양성을 보여주었다(Table 3). 소개체 군 내 유전다양성은 소개체군의 크기(예, PPB와 소개체군 의 크기: R2 = 0.848, P < 0.001)나 생육지 면적과 유의한 정의 상관관계를 보여주었다(예, PPB와 생육지 면적: R2
= 0.486, P = 0.008).
2. 유전적 분화 및 개체군 구조
Bayesian approach에 의한 개체군 간 유전적 분화도(θB) 를 세 가지의 모델에 따라 분석한 결과 가장 낮은 DIC값을 보이는 f(full model)에서 0.079로 나타났다(Table 4). 이는 Nei(1973)에 의한 유전적 분화도(GST = 0.075)와 유사한 수준이다. 단양쑥부쟁이 개체군 간 유전자 흐름의 정도 (Nem)는 6.15로 나타났다. 단양쑥부쟁이 개체군을 두 개의 계층으로 구분하여 AMOVA 분석한 결과 전체 유전변이
Figure 2. Neighbor-joining dendrogram for 13 subpopulations of A. altaicus var. uchiyamae based on genetic distance(pairwise Φst) of AFLP markers.
Abbreviations for subpopulations are listed in Table 1.
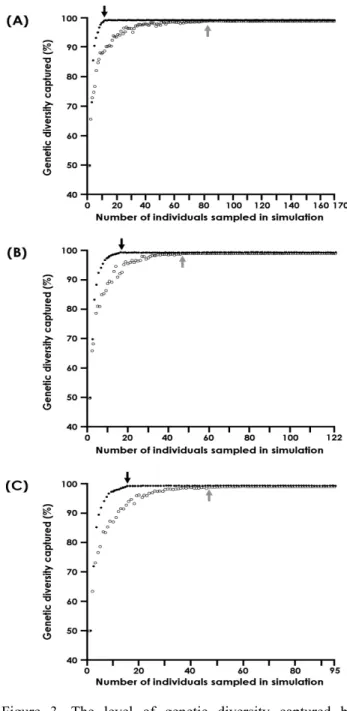
Figure 3. The level of genetic diversity captured by simulations for determination of minimum population size based on AFLP markers from three populations, (A) Guram, (B) Dori Island, and (C) Samhap. The solid and open circles represent the average level of genetic diversity captured in a given number of individuals sampled by maximization strategy and simple random strategy, respectively.
Each data point is based on 20 independent replicates. The black and grey arrows indicate the minimum number of individuals for maximizing genetic diversity by maximization strategy and simple random strategy, respectively.
중 91%가 개체군 내 개체간의 차이에서 기인한 것으로 나 타났으며 나머지(9%)는 개체군간의 유전적 변이에 기인한 것이다. 또한 개체군 간, 소개체군 간, 소개체군 내 등 3개의 계층으로 나누어 분석한 결과에서도 소개체군 내의 유전적 변이(88.3%)가 가장 높게 나타났으며, 개체군 간(7.0%), 소 개체군 간(4.7%)의 변이 순으로 관찰되었다(Table 5).
단양농업기술센터내에 이식 재배한 개체군을 제외한 13 개 소개체군 간에 유전적 거리(pairwise Φst)를 구한 결과 굴암개체군 내 소개체군 GA와 GC간이 0.010로 최소치를, 굴암개체군내 소개체군 GA와 단양개체군내 소개체군 DG 간이 0.261로 최대치를 보임으로, 전체 평균값은 0.109로 나타났다(Table 6). Mentel test결과 소개체군 간 유전적 거 리와 물리적 거리 간에는 유의한 상관관계를 보이는 것으로 나타났다(r = 0.438, P = 0.001). 소개체군 간의 유전적 거리 를 이용하여 N-J 수지도를 작성한 결과 경기도 여주군 내에 분포하는 3개 개체군(굴암, 도리섬, 삼합)은 단양개체군과 구분되는 양상을 보여주었다(Figure 2). 또한 굴암개체군과 도리섬개체군 내 소개체군은 각 개체군 별로 유집된 반면 삼합개체군은 굴암개체군과 도리섬개체군의 기저부위에 위치하였다.
3. 현지 외 보전을 위한 최소개체수 산정
각 개체군 내에서 95% 이상의 빈도를 보이는 다형성 밴 드는 굴암개체군에서 315개, 삼합개체군에서 364개, 도리 섬개체군에서 399개로 분석되었다. 최대화 전략에 의한 최 적의 조건에서 각 개체군 내 모든 대립인자를 포함하는 최 소개체수를 산정한 결과, 굴암개체군에서는 11개체, 도리섬 개체군에서는 17개체, 삼합개체군에서는 16개체로 나타났 다(Figure 3). 또한 무작위적인 표본추출에 의한 각 개체군
내 최소개체수는 굴암개체군에서 83개체, 도리섬개체군에 서 47개체, 삼합개체군에서 48개체로 나타났다.
고 찰
1. 유전다양성
개체군 내의 유전다양성은 지리적인 분포특성과 상관관 계를 보인다. 특정지역에만 분포하는 고유종은 광범위종에 비해 유전적 부동 또는 근친교배에 의하여 낮은 유전다양성 을 나타낸다(Hamrick and Godt, 1990). 단양쑥부쟁이 개체 군에서 관찰된 유전다양성의 평균(PPB = 45.3%; h = 0.104) 은 쑥부쟁이속내의 다른 분류군들과 비교할 경우 높은 수준 으로 나타났다. 즉, 일본 류큐열도 해안가에 제한적으로 분포 하는 다년생 2배체(2n = 18) 종인 A. asa-grayi(PPB = 10.9%, h = 0.041)나 A. miyagii(PPB = 19.9%, h = 0.077) 보다 상당히 높게 나타났다(Maki, 1999, 2001). 일본, 한국 등 상 대적으로 넓게 분포하는 해국(A. spathulifolius; h = 0.102) 과는 비슷한 수준을 보여주었다(Maki and Morita, 1998). 비 록 단양쑥부쟁이가 국내에 제한적인 분포 양상을 보인다 하 더라도 하천변의 척박한 환경에서도 적응력을 보임으로 높 은 유전다양성을 유지할 수 있는 것으로 사료된다. 일본 Honshu의 Yamanashi현과 Kanagawa현에만 제한적으로 분 포하며, 단양쑥부쟁이와 유사한 생육지 특성을 보이는 A.
kantoensis(h = 0.142)의 경우에도 높은 유전다양성을 보인 다(Maki et al., 1996). 또 다른 요인으로는 다수의 창시자 효과에 의한 것이다(Xue et al., 2004). 하천변의 범람에 의 하여 다수의 개체들이 함께 이동함으로써 새롭게 생성되는 개체군 내에서 유전다양성을 유지할 수 있다. 또한 단양쑥부 쟁이 개체군은 비교적 최근에 인위적인 훼손이 진행되어 개 체군 내의 유전다양성이 감소될 만큼 충분한 시간이 흐르지 않았기 때문에 높은 유전다양성을 유지할 수 있다.
한편 식물종 개체군의 유전다양성은 교배양식에 의해서도 영향을 받는 것으로 알려졌다(Nybom and Bartish, 2000).
즉 이계교배를 선호하는 식물종의 경우 근친교배를 선호하 는 종에 비해 대체적으로 높은 유전다양성을 보인다. 단양쑥 부쟁이의 수분기작이나 교배양식에 대해서는 아직까지 보고 된 바가 없으나, 개체군 내 유전다양성을 근거로 이계교배를 선호하는 것으로 추정된다. 즉, 쑥부쟁이속내에서 자가불합 성을 보이는 분류군(A. kantoensis와 A. spathulifolius)과 유 사한 유전다양성을 보이는 반면 근친교배를 선호하는 A.
asa-grayi에 비해 높은 유전다양성을 보여주었다(Maki et al., 1996; Maki and Morita, 1998; Maki, 1999).
단양쑥부쟁이의 각 개체군간 유전다양성을 비교한 결과, 충북 단양 개체군은 경기도 여주일대에 생육하는 3개 개체
군(굴암, 도리섬, 삼합)에 비해 상당히 낮은 유전다양성을 보여주었다(Table 3). 이는 단양개체군이 여주일대의 개체 군들에 비해 상대적으로 작은 개체군 크기와 좁은 생육지 면적을 보이기 때문이다(Table 1). 작은 개체군은 큰 개체군 에 비해 상대적으로 유전적 부동에 의한 영향을 크게 받아 개체군 내 유전다양성이 줄어들게 된다(Barrett and Kohn, 1991). 이러한 해석은 단양쑥부쟁이 개체군 내 유전다양성 과 개체군 크기나 생육지 면적과 유의한 정의 상관관계를 보임으로 지지된다.
2. 유전적 분화 및 유연관계
개체군 간 유전적 분화는 해당 종의 교배양식이나 지속기 간 등에 영향을 받는다. 자가수분을 선호하는 일년생이나 이년생의 식물 종(GST = 0.30 - 0.59)은 타가수분을 선호하 는 다년생 식물(GST = 0.23)에 비해서 높은 유전적 분화도를 보인다(Nymbom and Bartish, 2000). 본 연구에서 관찰된 단양쑥부쟁이의 개체군 간 유전적 분화 수준(GST = 0.075, θB = 0.079)은 타가수분을 선호하는 다년생 식물 종보다도 매우 낮은 것으로 파악되었다. 또한 단양쑥부쟁이의 개체군 간 유전적 분화도를 쑥부쟁이속내의 다른 분류군들과 비교 할 경우에도 낮게 나타났다. 예를 들어, A. kantoensis(GST
= 0.145), A. miyagii(GST = 0.477), 해국(GST = 0.491), A.
asa-grayi(GST = 0.708)에 비해 상당히 낮은 유전적 분화도 를 보인다(Maki et al., 1996; Maki and Morita, 1998; Maki, 1999; 2001). AMOVA분석에 의한 유전적 변이의 계층적 분석결과 전체변이의 88.3%가 개체군 내 개체간에서 보였 으며, 나머지 11.7%만이 개체군 간 또는 소개체군 간의 차 이로 나타났다(Table 5). 단양쑥부쟁이의 개체군 간 유전적 분화가 낮은 요인으로는 인접한 개체군 간의 유전자 이동이 원활하게 이루어진 결과로 해석할 수 있다. 본 연구에서 분석 된 단양쑥부쟁이 개체군 간의 유전자 이동(Nem = 6.15)은 매우 높은 수준이며, 단양 개체군을 제외한 여주일대에서 생 육하는 3개 개체군(굴암, 도리섬, 삼합)은 7 km 범위 내에 산재해 있다. Neighbour-joining 방법에 의한 개체군간의 유 연관계를 분석한 결과 경기도 여주군내 3개 개체군은 단양 개체군과 구분이 되어 하나의 그룹을 형성하였다(Figure 2).
따라서 개체군의 지리적인 분포와 유전적 유연관계는 일치 하는 양상을 보여준다. 또한 개체군 간 물리적 거리와 유전 적 거리 간에 유의한 상관관계(r = 0.438, P = 0.001)를 보임 으로써 이러한 해석을 지지해준다.
3. 유전자원의 현지 외 보전을 위한 최소개체수 산정 멸종위기 식물의 현지 외 보전을 위한 유전다양성이 유지
되는 최소개체수를 산정하기 위해서는 개체수준에서 해상 력있는 분자마커를 이용한 분석이 필요하다(Richards et al., 2007). 본 연구에서 사용한 AFLP 마커는 다수의 다형 성 밴드(934개)를 포함하므로 AFLP 표현형으로 각 개체를 구분 가능하였다(Table 2). 또한 유전다양성 보전을 위한 최소개체수를 산정에 포함된 경기도 여주일대 3개의 개체 군(굴암, 도리섬, 삼합)내에서 95%이상의 빈도를 보이는 밴 드 수는 적어도 315개 이상이다. 각 개체군 별로 최적의 조건에서 산정된 최소개체수는 굴암개체군에서 11개로 가 장 낮았으며, 삼합개체군과 도리섬개체군에서는 각각 16개 체와 17개체로 분석되었다(Figure 3). 최적의 조건에서 개 체군 별로 산정된 최소개체수는 개체군내 모든 개체에 대한 유전정보를 알고 있는 상태에서 선별이 가능하다(Richards et al., 2007). 한편, 무작위적으로 추출한 경우 산정된 최소 개체수는 굴암개체군에서 83개체, 도리섬개체군에서 47개 체, 삼합개체군에서 48개체로 나타났다. 따라서 유전자원을 효율적으로 보전하기 위해서는 우선적으로 개체군 내 각 개체별로 표지한 후에 유전적 특성을 분석한 후 최소개체수 를 산정하여 현지 외 보전을 해야 한다.
4. 유전자원 보전전략
단양쑥부쟁이는 우리나라 고유종이므로 유전자원으로서 의 높은 보전가치를 지녔다는 점과 하천변의 척박한 환경에 서 생육하면서 자연적 또는 인위적인 교란에 의하여 개체수 가 줄어들 가능성이 높다는 점 등을 고려할 때 자생지 보호 에 대한 노력이 필요할 뿐만 아니라 적절한 장소를 선택한 후 현지 외 보전이 요구된다(Maki et al., 1996).
국내에서 확인된 단양쑥부쟁이 개체군은 높은 유전다양 성을 보이는 반면, 개체군간에는 낮은 유전적 분화도를 나 타내었다(Tables 3 and 4). 또한 개체군 내 유전다양성의 수준은 개체군 크기나 생육지 면적과 유의한 상관관계를 보여준다. 높은 유전적 변이를 지닐수록 다양한 환경의 변 화에 잘 적응할 수 있다는 점을 고려할 때 현재의 자생지를 보호하며 개체군 크기나 개체군 간의 유전적 흐름을 원활히 유지시켜 주는 것이 중요하다(Hartl and Clark, 1997). 자생 지 보전을 위해서는 현재 남아있는 개체를 확인하여, 개체 마다 모두 일련번호를 부여하여 개체군 크기나 생태적 구조 변화에 대한 장기적인 모니터링과 높은 유전다양성을 유지 시켜주는 요인들을 밝히기 위한 추가적인 연구(예, 교배양 식)가 필요할 것으로 사료된다.
단양쑥부쟁이 자생지 내의 현존하는 모든 개체나 개체군 을 대상으로 보전을 하기에는 경제적 비용과 기술적 어려움 이 증가한다. 따라서 유전자원의 효율적이고 합리적인 현지 외 보전을 위해서는 자생지 내 모든 유전적 변이를 포함하는
최소한의 개체들을 선택할 필요가 있다. 새롭게 증식된 개체 와 자생지 개체와의 유전적 변이와 유전다양성을 비교하여 야 하며, 자생지 생육환경 분석을 통한 발아조건이나 생육조 건을 확보하여 현지 외 보전에 활용해야 할 것이다. 또한 인위적인 교란에 의하여 훼손된 자생지 개체군에 대해서는 현지 외 보전을 통해 증식된 개체를 대상으로 최소개체수를 산정한 후 역으로 자생지 내에 이식이 가능할 것이다.
인용문헌
Barrett, S.C.H. and J.R. Kohn(1991) Genetic and evolutionary con- sequences of small population size in plants: Implications for conservation. In: D.A. Falk and K.E. Holsinger (eds.), Genetics and Conservation of Rare Plants. Oxford University Press, Oxford, U.K., pp. 3-30.
Brown A.H.D. and J.D. Briggs(1991) Sampling strategies for ge- netic variation in ex situ collections of endangered plant species. In: D.A. Falk and K.E. Holsinger (eds.), Genetics and Conservation of Rare Plants. Oxford University Press, Oxford, U.K., pp. 99-119.
Chung, G.Y. and H.J. Jeong(1999) Study on the leaf morphology of Korean Aster L. and its allied taxa. Korean J. Plant Res. 12:
50-61. (in Korean with English abstract)
Chung, G.Y. and H.J. Jeong(2000) Study on the achene morphol- ogy of Korean Aster L. and its allied taxa. Korean J. Plant Res.
13: 179-187. (in Korean with English abstract)
Chung, G.Y. and Y.S. Kim(1997) Study on the somatic chromo- some numbers of Korean Aster L. and its allied taxa. Korean J.
Plant Res. 10: 292-299. (in Korean with English abstract) Ellstrand, N.C. and D.R. Elam(1993) Population genetic con-
sequences of small population size; implications for plant conservation. Annu. Rev. Ecol. Syst. 24: 217-242.
Excoffier, L., G. Laval and S. Schneider(2005) Arlequin ver. 3.0.:
an integrated software package for population genetics data analysis. Evol. Bioinform. Online 1: 47-50.
Frankham, R., J.D. Ballon and D.A. Briscoe(2002) Introduction to Conservation Genetics. Cambridge University Press, Cambridge, 617pp.
Gouesnard, B., T.M. Bataillon, G. Decoux, C. Rozale, D.J. Schoen and J.L. David(2001) MSTRAT: an algorithm for building germ plasm core collection by maximizing allelic or pheno- typic richness. J. Hered. 92: 93-94.
Hamrick, J.L. and M.J. Godt(1990) Allozyme diversity in pant species. In: A.H.D. Brown, M.T. Clegg, A.L. Kahler and B.S.
Weir (eds.), Plant Population Genetics, Breeding, and Genetic Resources. Sinauer Associates Inc., Sunderland, Massachusetts, pp. 43-63.
Hartl, D.L. and A.G. Clark(1997) Principles of Population Genetics.
Sinauer Associates Inc., Sunderland, Massachusetts, 542pp.
Holsinger, K.E. and P.O. Lewis(2005) Hickory: a package for anal- ysis of population genetic data, ver. 1.0.4. Department of Ecology and Evolutionary Biology, University of Connecticut, Storrs, CT.
Hyun, J.O.(2001) Categorization of the threatened plant species in Korea. Ph. D. thesis, Univ. of Sooncheonhyang, Asan, Korea, 288pp. (in Korean with English abstract)
Kim, C., H.R. Na and H.-K. Choi(2008) Conservation genetics of endangered Brasenia schreberi based on RAPD and AFLP markers. J. Plant Biol. 51: 260-268.
Kim, S.Y., Y.D. Kim, J.S. Kim, B.H. Yang, S.H. Kim and B.C.
Lee(2009) Genetic diversity of Forsythia ovata Nakai (Oleaceae) based on inter-simple sequence repeats (ISSR).
Korean J. Pl. Taxon. 39:48-54. (in Korean with English ab- stract)
Maki, M. and H. Morita(1998) Genetic diversity in island and main- land populations of Aster spathulifolius (Asteraceae). Int. J.
Plant Sci. 159: 148-152.
Maki, M.(1999) Genetic diversity in the threatened insular endemic plant Aster asa-grayi (Asteraceae). Plant Syst. Evol. 217: 1-9.
Maki, M.(2001) Genetic differentiation within and among island populations of the endangered plant Aster miyagii (Asteraceae), an endemic to the Ryukyu Islands. Am. J. Bot. 88: 2189-2194.
Maki, M., M. Masuda and K. Inoue(1996) Genetic diversity and hi- erarchical population structure of a rare autotetraploid plant, Aster kantoensis (Asteraceae). Am. J. Bot. 83: 296-303.
Mantel, N.(1967) The detection of disease clustering and a general- ized regression approach. Cancer Res. 27: 209-220.
Matsumoto, J., H. Muraoka and I. Washitani(2000) Ecophysiological mechanisms used by Aster kantoensis, an endangered species, to withstand high light and heat stresses of its gravelly flood plain habitat. Ann. Bot. 86: 777-785.
Miller, M.P.(1997) Tools for Population Genetics Analysis (TFGPA). A Windows program for the analysis of allozyme and molecular population genetic data, ver. 1.3. Department of
Biological Sciences, Northern Arizona University, Flagstaff, AZ.
Nei, M.(1973) Analysis of gene diversity in subdivided populations. P. Natl. Acad. Sci. USA 70: 3321-3323.
Nybom, H. and I.V. Bartish(2000) Effects of life history traits and sampling strategies on genetic diversity estimates obtained with RAPD markers in plants. Perspectives in Plant Ecology, Evolution and Systematics 3: 93-114.
Richards, C.M., M.F. Antolin, A. Reilley, J. Poole and C.
Walters(2007) Capturing genetic diversity of wild populations for ex situ conservation: Texas wild rice (Zizania texana) as a model. Genetic Resources and Crop Evolution 54: 837-848.
SAS Institute Inc.(1999) SAS proprietary software, release 8.0.
SAS Institute Inc., Cary, NC.
Shannon, C.E. and W. Weaver(1949) The Mathematical Theory of Communication. University of Illinois Press, Urbana, IL.
Tamura, K., J. Dudley, M. Nei and S. Kumars(2007) MEGA 4: mo- lecular evolutionary genetics analysis (MEGA) software, ver.
4.0. Mol. Biol. Evol. 24: 1596-1599.
Van Treuren, R., R. Bijlsma, W. Van Delden and N.J. Ouborg (1991) The significance of genetic erosion in the process of extinction. I. Genetic differentiation in Salvia pratensis and Scabiosa columbaria in relation to population size. Heredity 66: 181-190.
Washitani, I., A. Takenaka, N. Kuramoto and K. Inoue(1997) Aster kantoensis Kitam., an endangered flood plain endemic plant in Japan: its ability to form persistent soil seed banks. Biol.
Conserv. 82: 67-72.
Xue, D.W., X.J. Ge, G. Hao and C.Q. Zhang(2004) High genetic di- versity in a rare, narrowly endemic Primrose species: Primula interjacens by ISSR analysis. Acta Botanica Sinica 46:
1163-1169.
Yeh, F., R.C. Yang and T. Boyle(1997) POPGENE. A user-friendly shareware for population genetic analysis, ver. 1.31. Molecular and Biotechnology Center, University of Alberta, Edmonton.