Genetic Diversity and Population Structure in East Asian Populations of Plantago asiatica
Man Kyu Huh*
Department of Molecular Biology, Dongeui University, Busan 614-714, Korea
Received March 5, 2013 /Revised June 25, 2013 /Accepted June 25, 2013Plantago asiatica (Plantaginaceae) is a wind-pollinated plant that grows mainly on fields in East Asia.
Starch gel electrophoresis was used to investigate the allozyme diversity and population structure of 18 populations of this species. Although the plantain populations were isolated and patchily dis- tributed, they maintained a high level of genetic diversity; the average percentage of polymorphic loci was 57.1%, the mean number of alleles per locus was 2.07, and the average heterozygosity for 18 pop- ulations was 0.201. The combination of a predominant wind-pollinated, mix-mating reproduction, large population sizes, high gene flow between subpopulations, and a propensity for high fecundity may explain the high level of genetic diversity within populations. A direct gradient in overall genetic diversity is associated with latitude. Genetic diversity of P. asiatica is markedly decreased from 35
o3'N to high latitude and decreased from 35
o3'N to low latitude, whereas there does not show a longi- tudinal gradient in genetic diversity.
Key words : Allozyme, gene flow, latitudinal gradient, Plantago asiatica
*Corresponding author
*Tel:+82-51-890-1529, Fax:+82-51-890-1521
*E-mail : [email protected]
This is an Open-Access article distributed under the terms of the Creative Commons Attribution Non-Commercial License (http://creativecommons.org/licenses/by-nc/3.0) which permits unrestricted non-commercial use, distribution, and reproduction in any medium, provided the original work is properly cited.
Journal of Life Science 2013 Vol. 23. No. 6. 728~735 DOI : http://dx.doi.org/10.5352/JLS.2013.23.6.728
Introduction
The accumulation of allozyme data in higher plants has revealed causal relationships between allozyme diversity and the ecological characteristics of a species [3]. Various factors such as the breeding system, seed dispersal mecha- nism, and distribution pattern affect the genetic structure of plant populations [2]. For example, predominantly out- crossing species tend to maintain more genetic variation within their populations than predominantly self-pollinating species [6]. In general, geographically restricted or endemic species maintain fewer polymorphic loci, and fewer alleles per polymorphic locus than widespread congeneric species [5]. However, widespread plant species that occur as small, isolated patches in specialized habitats are expected to main- tain a low level of genetic variation within the species and a high level of population divergence caused by genetic drift [2].
The family Plantaginaceae consists of 3 genera and over 250 species with a cosmopolitan distribution [23]. The largest
genus is Plantago, the plantain (250 species). In genus Plantago, a large number of morphologically different species and/or varieties have been described [17]. Plantain, Plantago asiatica L. (Plantaginaceae) is a very common weed in East Asia, growing on disturbed sites, riverbanks, roadsides, and waste places. It is a self-compatible perannual that is wind pollinated and shows protogyny [8].
Van Dijk, Wolff, and their associates studied on genetic variability in Plantago species in relation to their ecology [16, 17, 18]. They mainly studied the correlation of genetic analy- sis and morphological variability in northern European Plantago species, but their works did not cover studies on the overall genetic diversity and population structure [20, 21]. In addition, a survey of enzyme variability in several populations of Plantago major complex in the Netherlands was very low [22]. In this study we found that P. asiatica in East Asia maintained high levels of genetic diversity.
In this paper, I estimate the allozyme diversity maintained
in natural populations of plantain and describe the genetic
structure of East Asian populations such as China, Korea
and Japan. The results were compared with those of genus
Plantago from Europe as well as other species with similar
ecological and life history characteristics. In addition, I argue
here that there are relationships between latitude and genet-
ic diversity for P. asiatica.
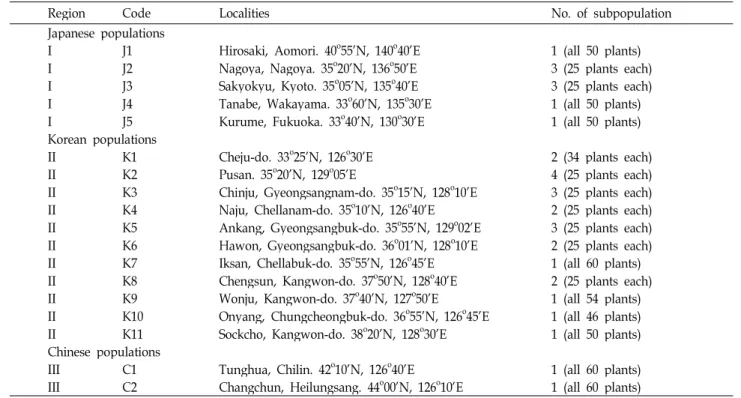
Table 1. Locations of plantain populations sampled for electrophoresis. Region designations refer to groups of populations in close proximity. Population size estimates based on intensive field surveys
Region Code Localities No. of subpopulation
Japanese populations
I J1 Hirosaki, Aomori. 40o55’N, 140o40’E 1 (all 50 plants)
I J2 Nagoya, Nagoya. 35o20’N, 136o50’E 3 (25 plants each)
I J3 Sakyokyu, Kyoto. 35o05’N, 135o40’E 3 (25 plants each)
I J4 Tanabe, Wakayama. 33o60’N, 135o30’E 1 (all 50 plants)
I J5 Kurume, Fukuoka. 33o40’N, 130o30’E 1 (all 50 plants)
Korean populations
II K1 Cheju-do. 33o25’N, 126o30’E 2 (34 plants each)
II K2 Pusan. 35o20’N, 129o05’E 4 (25 plants each)
II K3 Chinju, Gyeongsangnam-do. 35o15’N, 128o10’E 3 (25 plants each)
II K4 Naju, Chellanam-do. 35o10’N, 126o40’E 2 (25 plants each)
II K5 Ankang, Gyeongsangbuk-do. 35o55’N, 129o02’E 3 (25 plants each) II K6 Hawon, Gyeongsangbuk-do. 36o01’N, 128o10’E 2 (25 plants each)
II K7 Iksan, Chellabuk-do. 35o55’N, 126o45’E 1 (all 60 plants)
II K8 Chengsun, Kangwon-do. 37o50’N, 128o40’E 2 (25 plants each)
II K9 Wonju, Kangwon-do. 37o40’N, 127o50’E 1 (all 54 plants)
II K10 Onyang, Chungcheongbuk-do. 36o55’N, 126o45’E 1 (all 46 plants)
II K11 Sockcho, Kangwon-do. 38o20’N, 128o30’E 1 (all 50 plants)
Chinese populations
III C1 Tunghua, Chilin. 42o10’N, 126o40’E 1 (all 60 plants)
III C2 Changchun, Heilungsang. 44o00’N, 126o10’E 1 (all 60 plants)
Materials and Methods Sampling procedures and enzyme electrophoresis
The leaf samples were collected from 18 natural pop- ulations of P. asiatica (Table 1). The clumped distribution of populations was addressed for purposes of hierarchical analysis by designinating three regional groups, each in- cluding two to eleven populations. For nine of the 18 pop- ulations, collection of individuals was subdivided into two or more geographically separated subpopulations by dis- tance of 50 m.
The procedures for the homogenization of tissues, starch gel electrophoresis, and enzyme assays, followed the meth- ods of Soltis et al. [14]. Young leaves were homogenized in Tris-HCl grinding buffer with PVP (pH 8.0) as described in Soltis et al. [14]. Electrophoresis was performed using 11.0% starch gels, and ten enzymes were assayed. Acid phos- phatase (ACP), glutamate oxaloacetate transaminase (GOT), and leucine aminopeptidase (LAP) were resolved on the sys- tem 9 of Soltis et al. [14]; esterase (EST) and peroxidase (PER) were resolved on system of morpholine-citrate buffer (pH 6.1); isocitrate dehydrogenase (IDH), malic enzyme (ME), malate dehydrogenase (MDH), 6-phosphogluconate de- hydrogenase (PGD), phosphoglucose isomerase (PGI), phos-
phoglucomutase (PGM), and shikimate dehydrogenase (SKD) were resolved on the system 10 of Soltis et al. [14].
For the enzymes resolved in more than one zone of activ- ity, the most anodally migrating isozyme was designated as '1', and other subsequent isozymes were sequentially numbered. The alleles of isozyme 1, 2, 3, and so on were designated sequentially as 'a', ‘b’, ‘c’, and so on, respectively.
Data analysis
A locus was considered polymorphic if two or more al- leles were detected, and the frequency of the most common allele was less than 0.99. The following genetic parameters were calculated using a POPGENE computer program (ver- sion 1.31) developed by Yeh et al. [26]: the percentage poly- morphic loci (P
pfor population level and P
sfor species lev- el), mean number of alleles per locus (A), effective number of alleles per locus (A
E), and gene diversity (H
E) [3]. Species (indicated with the subscript
S) and mean population (indicated with the subscript
P) levels of genetic diversity were calculated as in Hartl and Clark [7].
Nei's gene diversity formulae (H
T, H
S, D
ST, and G
ST) were
used to evaluate genetic diversity within and among pop-
ulations [9]. A measure of differentiation among pop-
ulations, relative to the total diversity was calculated at each
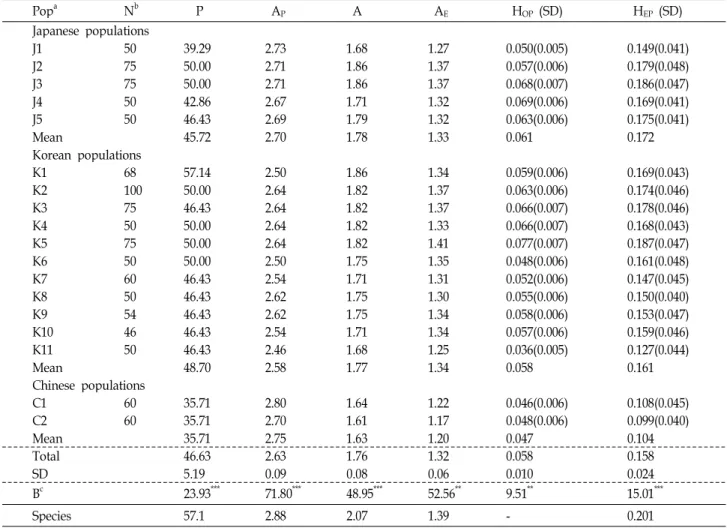
Table 2. Summary of allozyme variation within 18 populations of
P. asiatica
Popa Nb P AP A AE HOP (SD) HEP (SD)
Japanese populations
J1 50 39.29 2.73 1.68 1.27 0.050(0.005) 0.149(0.041)
J2 75 50.00 2.71 1.86 1.37 0.057(0.006) 0.179(0.048)
J3 75 50.00 2.71 1.86 1.37 0.068(0.007) 0.186(0.047)
J4 50 42.86 2.67 1.71 1.32 0.069(0.006) 0.169(0.041)
J5 50 46.43 2.69 1.79 1.32 0.063(0.006) 0.175(0.041)
Mean 45.72 2.70 1.78 1.33 0.061 0.172
Korean populations
K1 68 57.14 2.50 1.86 1.34 0.059(0.006) 0.169(0.043)
K2 100 50.00 2.64 1.82 1.37 0.063(0.006) 0.174(0.046)
K3 75 46.43 2.64 1.82 1.37 0.066(0.007) 0.178(0.046)
K4 50 50.00 2.64 1.82 1.33 0.066(0.007) 0.168(0.043)
K5 75 50.00 2.64 1.82 1.41 0.077(0.007) 0.187(0.047)
K6 50 50.00 2.50 1.75 1.35 0.048(0.006) 0.161(0.048)
K7 60 46.43 2.54 1.71 1.31 0.052(0.006) 0.147(0.045)
K8 50 46.43 2.62 1.75 1.30 0.055(0.006) 0.150(0.040)
K9 54 46.43 2.62 1.75 1.34 0.058(0.006) 0.153(0.047)
K10 46 46.43 2.54 1.71 1.34 0.057(0.006) 0.159(0.046)
K11 50 46.43 2.46 1.68 1.25 0.036(0.005) 0.127(0.044)
Mean 48.70 2.58 1.77 1.34 0.058 0.161
Chinese populations
C1 60 35.71 2.80 1.64 1.22 0.046(0.006) 0.108(0.045)
C2 60 35.71 2.70 1.61 1.17 0.048(0.006) 0.099(0.040)
Mean 35.71 2.75 1.63 1.20 0.047 0.104
Total 46.63 2.63 1.76 1.32 0.058 0.158
SD 5.19 0.09 0.08 0.06 0.010 0.024
Bc 23.93*** 71.80*** 48.95*** 52.56** 9.51** 15.01***
Species 57.1 2.88 2.07 1.39 - 0.201
P, AP, A, AE, HOP, and HEP. are the same as Materials and Methods.
a: Abbreviation codes as in Table 1. b: Number of individuals examined.
Bc: Barttet’s test for homogeneity of variances. **:
p
<0.01, ***:p
<0.001.locus as G
ST=D
ST/H
T. Weir and Cockerham’s [19] estimates of Wright’s F
ST(G
ST) were computed for variable loci with FSTAT ver. 1.2 [4].
A phenetic relationship was constructed by the neighbor joining (NJ) method using MEGA5 [15]. One thousand boot- strap resamplings over band phenotypes in the original data support values for branches in the tree.
The genetic structure within and among populations was also evaluated using Wright's F-statistics [25], F
IT, F
ISand F
ST. The F
ITand F
IScoefficients measure excesses of homo- zygotes relative to the panmictic expectations in the entire samples and within populations, respectively. The indirect estimate of Nm (the number of migrants per generation) was based on G
ST. The absolute population differentiation (D
M) was calculated using Nei's [10] statistics. Genetic diversity was tested against regions by Spearman rank to seek any
correlation between genetic variation in the populations and environmental factors. The correlation between geographical and genetic distances was evaluated using the modified Mantel's test [13].
Results
A high level of genetic variation was found in the plantain
populations. In 18 populations, sixteen of the 28 loci exam-
ined (57.1%) showed polymorphism in at least one pop-
ulation, while the remaining twelve loci (Acp-1, Est-3, Est-4,
Got-1, Got-2, Idh-1, Mdh-3, Me-1, Me-2, Per-1, Per-4, and Pgd-1)
were monomorphic in all populations. The percentage of
polymorphic loci within populations ranged from 35.7% to
57.1% with an average of 46.6% (Table 2). The majority of
the polymorphic loci maintained two (Idh-2, Mdh-2, Pgi-2,
Table 3. Estimates of genetic diversity statistics for sixteen polymorphic loci in 18 populations
Locus HT HS DST DM FIS FIT GST
Mdh-1
0.137 0.105 0.032 0.034 0.764 0.819 0.235Mdh-2
0.146 0.128 0.019 0.020 0.618 0.666 0.127Pgd-2
0.376 0.361 0.015 0.016 0.587 0.603 0.040Pgm-1
0.513 0.442 0.072 0.076 0.796 0.824 0.139Pgm-2
0.258 0.239 0.018 0.020 0.620 0.647 0.072Idh-2
0.053 0.045 0.008 0.008 0.538 0.605 0.145Acp-2
0.668 0.646 0.022 0.023 0.448 0.466 0.032Acp-3
0.239 0.221 0.018 0.019 0.735 0.756 0.076Per-2
0.175 0.162 0.014 0.014 0.590 0.622 0.077Per-3
0.535 0.511 0.025 0.026 0.610 0.628 0.046Est-2
0.594 0.540 0.054 0.057 0.644 0.677 0.091Est-3
0.216 0.177 0.039 0.041 0.715 0.767 0.181Pgi-1
0.511 0.505 0.006 0.006 0.691 0.695 0.012Pgi-2
0.296 0.284 0.012 0.012 0.771 0.780 0.039Skd
0.433 0.322 0.110 0.117 0.726 0.796 0.255Lap
0.466 0.463 0.003 0.003 0.551 0.554 0.007Mean 0.351 0.322 0.029 0.031 0.650 0.682 0.098
Total genetic diversity (HT), genetic diversity within populations (HS), among populations (DST), absolute population differentiation (DM), deviations of genotype frequencies from Hardy-Weinberg expectations within individual population (FIS), over all populations (FIT), and proportion of total genetic diversity partitioned among populations (GST).
and Skd) or three alleles (Acp-3, Est-2, Est-3, Lap, Mdh-1, Per-2, Pgd-2, Pgi-1, Pgm-1, and Pgm-2), while the remaining ones (Acp-2 and Per-3) maintained four alleles. The average num- ber of alleles per locus (A) was 1.76 on average. The number of alleles per polymorphic locus (A
P) was 2.63 across the populations. The mean genetic diversity within populations (H
EP) was 0.201. The K5 population had the highest genetic diversity (0.187), whereas the C2 population had lowest (0.099). The six genetic parameters were significant differ- ences between three regions (China, Korea, and Japan) (Table 2).
The average F
ISvalue for the 18 populations was 0.650 (Table 3). Assuming mating system equilibrium, the out- crossing rate (t), calculated from the mean F
ISvalue was esti- mated to be 0.212. The observed significant and positive F
ISvalue (0.650) indicated that there was significantly in a defi- cit of heterozygotes in the populations. Analysis of fixation indices, calculated for all polymorphic loci in each pop- ulation, showed a slight deficiency of heterozygote relative to Hardy-Weinberg expectations (data not shown). For ex- ample, all fixation indices were positive (235), and 231 of those (98.3%) departed significantly from zero (p<0.05). Total genetic diversity values (H
T) varied from 0.053 (Idh-2) to 0.668 (Acp-2), giving an average 0.351 over all polymorphic loci. The absolute measure of genetic differentiation among
populations (D
M) was very low (0.031). On a per locus basis, the proportion of total genetic variation due to differences among populations (G
ST) ranged from 0.007 for Lap to 0.255 for Skd, with a mean of 0.098, indicating that about 10% of the total allozyme variation was among populations.
The estimate of gene flow based on G
STwas moderate among the 18 populations (Nm=2.29). The designated hier- archy consisted of regions, populations, and subpopulations as indicated in Table 4. In the hierarchy analysis, the greatest amount of variance was exhibit among subpopulations with respect to the total samples (G
ST=0.100). A large component of this value was explained by variance among regions with respect to the total (G
XY=0.084), and this result consisted with the strong geographic effect indicated by phylogenetic trees.
The correlation between genetic distance and geographic distance was relatively high (r=0.50, p<0.05), indicating that
Table 4. Hierarchical genetic differentiation in
P. asiata.
GSTval- ue combined cross lociX Y GST
Subpopulation Subpopulation Subpopulation Population Population Region
Total Region Population Region Total Total
0.100 0.075 0.002 0.017 0.005 0.084
geographically close populations tended to be genetically similar.
Although the mean H
EPvalue for the Japanese pop- ulations was slightly greater than for the Korean pop- ulations, it was not significantly so (U<0.05; one-tailed Mann-Whitney test). Neither H
Tnor H
Swere significantly different between Japanese and Korean populations (T>0.05;
Wilcoxon’s paired test). However, there was significant dif- ference among mean H
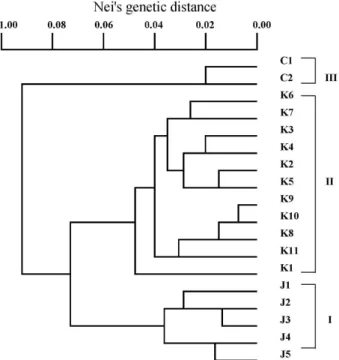
EPvalues for the three countries (China, Korea, and Japan) (Table 3). The genetic relation- ships among the populations can be seen in the phonetic tree, where three groups, one consisting of Japanese pop- ulations, another consisting of Korean populations and the other consisting of Chinese populations, were recognized (Fig. 1).
A direct gradient in overall genetic diversity is associated with latitude. Genetic diversity and total alleles on 28 loci are markedly decreased from 35
o3'N to high latitude, but decreased from 35
o3′N to low latitude (Fig. 2). P. asiatica did not show a longitudinal gradient in genetic diversity (Table 6).
Discussion Level of genetic variation
The level of genetic variation found in the 18 populations of plantain was high; the average percentage of polymorphic loci was 57.1%, and the corresponding average gene diver- sity at the species level (heterozygosity) was 0.201 (Table 2). According to a review of plant allozyme literature by Hamrick and Godt [5], the average percentage of poly- morphic loci for perennial species was 41.3% at the species level (reviewed for N=152 species) and 28.0% at the pop- ulation level (N=159). The mean genetic diversity (H
E) was 0.116 at the species level and 0.096 at the population level.
All the genetic diversity parameters of East Asian pop- ulations of plantain were higher than those of species with similar ecological and life history characteristics. For exam- ple, the mean genetic diversity of 0.201 for East Asian pop- ulations is higher than species with a regional geographical range (0.150), selfing species (0.124), and temperate-zone species (0.146) [5]. Other measures of genetic variation con- firm the 18 populations of plantain are more variable than ecologically comparable species.
The genetic diversity of P. asiatica observed in this study can be compared with that observed in natural populations
of P. major (the other plantain species, commonly found in Europe) studied by Van Dijk et al. [18]. For P. major, H
EPis 0.047, the percentage of polymorphic loci at population level (P
P) is 15.3%, the mean number of allele (A) is 1.24, and the mean effective number of allele (A
E) is 1.09 [18].
In addition, among three northern European Plantago species for which there are allozyme data (Table 5), P. lanceolata had the highest genetic diversity. These comparisons suggest that genetic diversity of P. asiatica is higher than those of three northern European Plantago species (one-tailed Wilcoxon’s signed rank test). The reason for this difference is unknown except the point of different species.
Population structure and breeding system of plantain
The phylogenetic tree shown in Fig. 1 clearly dis- tinguishes three clades, the Chinese, Japanese, and Korean clades. The correlation between genetic distance and geo- graphical distance is relatively high in Korea and low in Japan. In the Korean clade, the positions of the populations in the tree almost completely match the corresponding geo- graphical positions. The two northernmost populations in China are relatively small and maintained less genetic varia- tion than the other populations, probably due to (having suf-
Fig. 1. A dendrogram showing the genetic relationships among 18 populations of
P. asiatica
, based on allozyme variation.Numeric codes are indicated by corresponding to those indicated in Table 1.
Table 5. Comparison of genetic variability for previously studied three northern European
Plantago
speciesSpecies Na P A AE HES GST Mating system (t) Data source
Three northern European
Plantago
speciesP. major
4 15.3 1.24 1.09 0.047 0.216 Inbreeding (t=0.0-1.0) Van Dijk et al. 1988P. lanceolata
7 33.3 1.81 1.36 0.127 0.037 Outcrossing (t=1.0) Van Dijk et al. 1988P. coronopus
4 30.6 1.40 1.15 0.088 0.070 mix-mating (t=0.5-0.9) Van Dijk et al. 1988Mean 26.4 1.48 1.20 0.087 0.107
Asian
Plantago
speciesP. asiatica
18 57.1 2.07 1.39 0.201 0.098 mix-mating (t=0.212) This studyF-test (df=1) *** * Ns ** ns
Na: Number of populations. ns: not significant. *:
p
<0.05, **:p
<0.01, ***:p
<0.001.fered) a founder effect as marginal populations if the origin of this species may be assumed regions of below latitude.
P. asiatica is self-compatibile, but there is no estimate about mating system. However the outcrossing rate, based on the mean F
ISwas 0.212. In the present study, a substantial deficiency of heterozygotes from the Hardy-Weinberg ex- pectation was detected. The mating system is therefore prob- ably a mix between selfing and outcrossing (mixed mating system). Inbreeding may cause it or this may be due to Wahlund’s effect of subdivision of patchily distributed natu- ral populations. A previous study by Van Dijk et al. [18]
indicated that pollen flow in plantain populations was lim- ited and the mating among neighboring plants was prevalent. If these aggregates form small, subpopulational patches or demes differing to some extent in allele fre- quency, their pooling during an electrophoretic study would result in an observed excess of homozygotes.
In natural populations of plantain, the allozyme varia- bility was maintained within populations rather than among populations, judging from the observed G
STvalues (Table 4). The majority of genetic variance resided within pop- ulations (91%). Van Dijk et al. [18] observed low values of G
STfor allozyme markers and morphological characters among northern European populations of plantain. We may suggest that allozyme variation in plantain populations is maintained in patchily distributed subpopulations or demes.
Ecological aspects of plantain populations and gradients in diversity
In general, species or taxa with widespread geographic distribution maintain a higher level of genetic diversity than those with narrow or endemic distributions [5]. Species with discrete populations in patchy distributions have relatively lower levels of variation within populations than species with more continuously distributed populations [5].
Although plantain is distributed in a wide geographic range, it is ecologically restricted, growing in waste sites or aban- doned fields in East Asia. Therefore, local populations are isolated each other, and they are discretely distributed.
Furthermore, as discussed above, each local population is subdivided, consisting of many subpopulations. Species with a relatively narrow niche, and with discrete, isolated populations (“habitat specialists”) like plantain in general maintain less genetic variation than do species with con- tinuous, abundant populations growing on broad-niched mainland habitats (“habitat generalists”) [11]. This probably implies that the population structure below the local pop- ulation level may be critical, along with the biological char- acteristics of the species itself, to determine the level of variation.
If the genetic diversity values of populations on the 33
oN - 34
oN are excluded in Fig. 2, a significant trend was ob- served between genetic diversity and latitude, with hetero- zygosity (H
EP) decreasing with increasing latitude. The high- est H
EPwas found in populations locating at or near 35
oN,
Fig. 2. Relationship between geographic distribution and genetic diversity of 18 populations of
Plantago asiatica
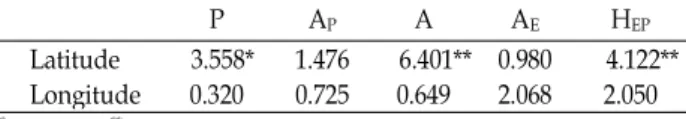
.Table 6. Gradients analysis for both latitude/longitude versus genetic diversity
P AP A AE HEP
Latitude
Longitude 3.558*
0.320 1.476
0.725 6.401**
0.649 0.980
2.068 4.122**
2.050
*:
p
<0.05, **:p
<0.01while the lowest H
EPwas found in from latitude (44
oN). The total number of alleles on the 28 loci was similar trend (Fig.
2). The trend was similar for the percentage of polymorphic loci (P
P). Although there were not any significant difference between latitudes (from 35
oN to 44
oN) for the A
P, A
E, and H
OP, the three statistics were negative correlated with the increase of latitude at which the populations were collected (Table 6). In addition, genetic diversity is markedly de- creased from 35
o3′N to high latitude, but slightly decreased from 35
o3′N to low latitude (Fig. 2). Thus, it is a possibility that there is an associated increase in turnover between areas in the genetic diversity of P. asiatica. East Asia regions are well known for various Plantago species and within- and be- tween-populations variability appeared highest in the 35
oN populations of East Asia, suggesting a possibility that these regions are to be the origins of P. asiatica. However, the hy- pothesis of the origin of this species needs to be tested by future work.
The wind is known to be capable of transporting pollen grains over long distances [1]. The effect of wind direction must be taken into account to explain part of the flowering season. In East Asia, wind usually blow from West to East.
Palacios et al. [12] also reported that the wind direction played a very major role in determining the pollen concen- tration in the Plantago species. Especially, flowering periods (June, July, and August) in P. asiatica are consistent with the result of the predominant west-to-east flow of air masses (from China to Japan via Korea). The Nm value (6.31) for the populations of similar latitude (K4, K3, K2, J3, and J2 populations in Fig. 1) is seven times of the amount (0.89) for the populations of similar longitude (K1, K4, K7, K10, C1 and C2 populations). As a result, gene flow by wind di- rection in East Asia has been extensive to enough to prevent the differentiation of local plantain populations on same latitude. When it is sometimes brown from East to West in winter or spring, it is not the season of P. asiatica flowering.
References
1. Charlesworth, D. 1993. Why are unisexual flowers asso-
ciated with wind pollination and unspecialized pollinators?
Am Nat
141, 481-490.2. Godt, M. J. W. and Hamrick, J. L. 1993. Genetic diversity and population structure in
Tradescantia hirsuticaulis
(Commelinae).Am J Bot
80, 959-966.3. Godt, M. J. W. and Hamrick, J. L. 1998. Allozyme diversity in the endangered pitcher plant
Sarracenia rubra
ssp.alaba- mensis
(Sarraceniaceae) and its close relativeS. rubra
ssp.rubra
.Am J Bot
85, 802-810.4. Goudet, J. 1995. FSTAT v-1.2: a computer program to calcu- late
F
-statistics.J Hered
86, 485-486.5. Hamrick, J. L. and Godt, M. J. W. 1989. Allozyme diversity in plant species, pp. 43-63. In: Brown, A. H. D., Clegg, M.
T., Kahler, K. L. and Weir, B. S. (eds.),
Plant Population Genetics, Breeding, and Genetic Resources
. Sinauer:Sunderland, MA.
6. Hamrick, J. L., Godt, M. J. W. and Sherman-Broyles, S. L.
1992. Factors influencing levels of genetic diversity in woody plant species.
New Forests
6, 95-124.7. Hartl, D. L. and Clark, A. G. 1989.
Principles of Population Genetics
, pp. 682, 2nd ed., Sinauer: Sunderland, MA.8. Kim, Y. S. 1975. Taxonomic study on genus
Plantago
in Korea.The Sciences and Technologies, Korea University
16, 39-71.9. Nei, M. 1973. Analysis of gene diversity in subdivided populations.
Proc Natl Acad Sci USA
70, 3321-3323.10. Nei, M. 1977.
F
-statistics and analysis of gene diversity in subdivided populations.Ann Hum Genet
41, 225-233.11. Nevo, E., Beiles, A. and Ben-Shlomo, R. 1984. The evolu- tionary significance of genetic diversity: ecological, demo- graphic and life history correlates, pp. 13-21. In: Many, G.
S. (ed.),
Evolutionary Dynamics of Genetic Diversity
. Springer:Berlin.
12. Palacieos, I. S., Molina, R. T. and Rodriguez, M. 2000.
Influence of wind direction on pollen concentration in the atmosphere
. Int J Biometeorol
44, 128-133.13. Smouse, P. E., Long, J. C. and Sokal, R. R. 1986. Multiple regression and correlation extensions of the Mantel test of matrix correspondence
. System Zool
35, 627-632.14. Soltis, D. E., Haufer, H., Darrow, D. C. and Gastony, G.
J. 1983. Starch gel electrophoresis of ferns: A compilation of grinding buffers, gel and electrode buffers, and staining schedules.
Am Fern J
73, 9-27.15. Tamura, K., Peterson, D., Peterson, N., Stecher, G., Nei, M.
and Kumar, S. 2011. MEGA5: Molecular Evolutionary Genetics analysis using maximum likelihood, evolutionary distance, and maximum parsimony methods.
Mol Biol Evol
28, 2731-2739.16. Van Dijk, H. 1989. Genetic variability in
Plantago
species in relation to their ecology. 1. Ecotypic differentiation inP.
major
.Theor Appl Genet
77, 749-759.17. Van Dijk, H. and Van Delden, W. 1981. Genetic variability in
Plantago
species in relation to their ecology. 1. Genetic analysis of the allozyme variation inP. major
subspecies.Theor Appl Genet
60, 285-290.18. Van Dijk, H., Wolff, K. and De Vries, A. 1988. Genetic varia-
초록:동아시아 질경이 집단의 유전적 다양성과 집단구조 허만규*
(동의대학교 분자생물학과)
질경이(Plantago asiatica)는 주로 동아시아에 분포하는 풍매화 식물이다. 전분 젤 전기영동으로 이 종의 18개 집단에 대한 알로자임 다양성과 집단구조를 평가하였다. 비록 질경이 집단은 작고 격리되어 있지만, 높은 유전적 다양성을 가지고 있었다. 평균 다형성을 나타내는 유전자좌위의 수는 57.1%였고, 대립유전자좌위당 유전자수는 2.07이였으며, 18개 집단에 대한 이형접합성은 0.201이였다. 풍매화, 혼합적 생식교배계, 큰 집단 크기, 집단 간 높은 유전자 이동, 다산의 특성이 집단 내 유전적 다양성을 설명할 수 있다. 유전적 다양성은 위도와 관련이 있었 는데 질경이 집단은 북위 35˚3'를 초과하면 유전적 다양성은 현저하게 감소하였다. 반면에 유전적 다양성에 대한 경도 구배는 나타나지 않았다.
bility in
Plantago
species in relation to their ecology. 3.Genetic structure of populations of
P. major
,P. major
andP. major
.Theor Appl Genet
75, 518-528.19. Weir, B. S. and Cockerham, C. C. 1984. Estimating
F
-sta- tistics for the analysis of population structure.Evolution
38, 1358-1370.20. Wolff, K. 1991. Genetic analysis of morphological variability in three
Plantago
species with different mating systems.Theor Appl Genet
81, 111-118.21. Wolff, K., Rogstad, S. H. and Schaal, B. A. 1994. Population and species variation of minisatellite DNA in
Plantago
.Theor Appl Genet
87, 733-740.22. Wolff, K. and Morgan-Richards, M. 1998. PCR markers
distinguish
Plantago
species.Theor Appl Genet
96, 282-286.23. Woodland, D. W. 1991.
Contemporary Plant Systematics,
pp.222, Prentice-Hall, Inc.: Englewood Cliffs.
24. Workman, P. L. and Niswander, J. D. 1970. Population stud- ies on southern Indian tribes.II. Local genetic differentiation in the Papago.
Am J Hum Genet
22, 24-49.25. Wright, S. 1965. The interpretation of population structure by
F
-statistics with special regard to systems of mating.Evolution
19, 395-420.26. Yeh, F. C., Yang, R. C. and Boyle, T. 1999. POPGENE.
Version 1.31, Microsoft Windows-based Freeware for Population Genetic Analysis.