Copyright © 2020 by Asian-Australasian Journal of Animal Sciences
This is an open-access article distributed under the terms of the Creative Commons Attribution License
Asian-Australas J Anim Sci
Vol. 33, No. 12:1896-1904 December 2020 https://doi.org/10.5713/ajas.19.0958 pISSN 1011-2367 eISSN 1976-5517
Estimating genetic diversity and population structure of 22
chicken breeds in Asia using microsatellite markers
Hee-Jong Roh1,*, Seung-Chang Kim1, Chang-Yeon Cho1, Jinwook Lee1, Dayeon Jeon1, Dong-kyo Kim1,
Kwan-Woo Kim1, Fahmida Afrin1, Yeoung-Gyu Ko1, Jun-Heon Lee2, Solongo Batsaikhan3,
Triana Susanti4, Sergey Hegay5, Siton Kongvongxay6, Neena Amatya Gorkhali7,
Lan Anh Nguyen Thi8, Trinh Thi Thu Thao8, and Lakmalie Manikku9
Objective: Estimating the genetic diversity and structures, both within and among chicken breeds, is critical for the identification and conservation of valuable genetic resources. In chickens, microsatellite (MS) marker polymorphisms have previously been widely used to evaluate these distinctions. Our objective was to analyze the genetic diversity and relation ships among 22 chicken breeds in Asia based on allelic frequencies.
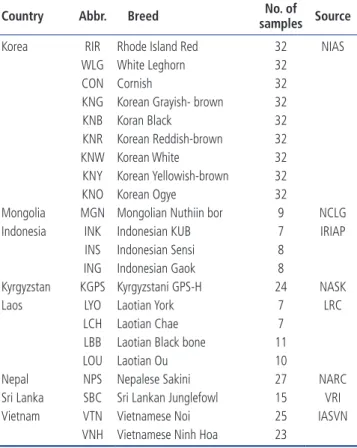
Methods: We used 469 genomic DNA samples from 22 chicken breeds from eight Asian countries (South Korea, KNG, KNB, KNR, KNW, KNY, KNO; Laos, LYO, LCH, LBB, LOU; Indonesia, INK, INS, ING; Vietnam, VTN, VNH; Mongolia, MGN; Kyrgyzstan, KGPS; Nepal, NPS; Sri Lanka, SBC) and three imported breeds (RIR, Rhode Island Red; WLG, White Leghorn; CON, Cornish). Their genetic diversity and phylogenetic relationships were analyzed using 20 MS markers.
Results: In total, 193 alleles were observed across all 20 MS markers, and the number of alleles ranged from 3 (MCW0103) to 20 (LEI0192) with a mean of 9.7 overall. The NPS breed had the highest expected heterozygosity (Hexp, 0.718±0.027) and polymorphism
information content (PIC, 0.663±0.030). Additionally, the observed heterozygosity (Hobs)
was highest in LCH (0.690±0.039), whereas WLG showed the lowest Hexp (0.372±0.055),
Hobs (0.384±0.019), and PIC (0.325±0.049). Nei’s DA genetic distance was the closest between
VTN and VNH (0.086), and farthest between KNG and MGN (0.503). Principal coordinate analysis showed similar results to the phylogenetic analysis, and three axes explained 56.2% of the variance (axis 1, 19.17%; 2, 18.92%; 3, 18.11%). STRUCTURE analysis revealed that the 22 chicken breeds should be divided into 20 clusters, based on the highest ΔK value (46.92).
Conclusion: This study provides a basis for future genetic variation studies and the develop ment of conservation strategies for 22 chicken breeds in Asia.
Keywords: Asian Chicken Breeds; Genetic Diversity; Genetic Relationship; Microsatellite Markers; Heterozygosity; Polymorphism Information Content
INTRODUCTION
Prior to the Convention on Biological Diversity (CBD; Rio de Janeiro, Brazil) in 1992, ge netic resources had been recognized as common global resources, however, after the CBD, they began to be regarded not as common, but as the individual resources of each respective country. In 2007, the Interlaken Declaration was adopted by the United Nations Food and Agriculture Organization, which suggested that each country should preserve their own animal genetic resources and promote the sustainable use of local breeds [1]. Moreover, the Nagoya protocol on access to genetic resources and the fair and equitable sharing of
* Corresponding Author: Hee-Jong Roh Tel: +82-55-960-3522, Fax: +82-55-960-3590, E-mail: [email protected]
1 Animal Genetic Resources Center, National Institute of Animal
Science, RDA, Hamyang 50000, Korea
2 Division of Animal and Dairy Science, Chungnam National University,
Daejeon 34134, Korea
3 Production and technology, National Centre for Livestock Genebank,
Ulaanbaatar, 210349, Mongolia
4 Indonesia Research Institute for Animal Production, Bogor, 16720,
Indonesia
5 Institute of Biochemistry & Physiology, National Academy of Science
of Kyrgyzstan, Bishkek, 720071, Kyrgyzstan
6 Livestock Research Centre, Vientiane, 7170, Lao People’s Democratic
Republic
7 Animal Breeding Division, Nepal Agricultural Research Council,
Kathmandu, 44600, Nepal
8 Department of Animal Breeding and Genetics, Institute of Animal
Sciences for Southern Vietnam, Binh Duong 75000, Vietnam
9 Department of Animal Production and Health, Veterinary Research
Institute, Colombo, 20400, Sri Lanka
ORCID Hee-Jong Roh https://orcid.org/0000-0003-1458-1937 Seung-Chang Kim https://orcid.org/0000-0001-5724-0599 Chang-Yeon Cho https://orcid.org/0000-0002-6373-8729 Jinwook Lee https://orcid.org/0000-0001-9019-1653 Dayeon Jeon https://orcid.org/0000-0003-2733-9832 Dong-kyo Kim https://orcid.org/0000-0002-4130-2086 Kwan-Woo Kim https://orcid.org/0000-0003-2729-2181 Fahmida Afrin https://orcid.org/0000-0001-8484-9746 Yeoung-Gyu Ko https://orcid.org/0000-0002-6108-6325 Jun-Heon Lee https://orcid.org/0000-0003-3996-9209 Solongo Batsaikhan https://orcid.org/0000-0002-5320-6542 Triana Susanti https://orcid.org/0000-0003-0594-2999 Sergey Hegay https://orcid.org/0000-0003-1996-892X Siton Kongvongxay https://orcid.org/0000-0002-4029-3843 Neena Amatya Gorkhali https://orcid.org/0000-0003-3592-4652 Lan Anh Nguyen Thi
https://orcid.org/0000-0003-3850-7379 Trinh Thi Thu Thao
https://orcid.org/0000-0001-8526-1987 Lakmalie Manikku
https://orcid.org/0000-0003-1063-0762
Submitted Dec 16, 2019; Revised Feb 5, 2020; Accepted Apr 3, 2020
their benefits, for the conservation and sustainable use of bio diversity [2], was adopted in October 2010 by the CBD, at the 10th Conference of the Parties. The importance of animal genetic resources has subsequently become established. Animal genetic diversity is a source of raw genetic material that can be utilized to improve breeds and adapt livestock populations to changing environments and demands. Thus, acquiring information on animal genetic diversity is essen tial to design strategies for their sustainable management [3,4]. In Asia, there are many chicken breeds that are distinguished by phenotypic differences, such as feather color, shank color, and comb type. While there are more than 21 billion chick ens in the world, more than half of these (53%) are found in Asia. Among the common types of livestock kept by humans, chickens have the largest number of different breeds, at ap proximately 1,669, of which 1,514 are local breeds and 155 are regional or from areas that cross international bound aries [5]. However, due to the spread of imported breeds that have good commercial performance, the local breeds with poorer commercial performance have been ignored, to the point that some are now threatened by extinction [6]. The loss of a breed to extinction means the loss of its unique genetic resources, such as environmental adaptability and resistance to endemic diseases [7]. Therefore, it is necessary to develop a conservation strategy for local breeds, by study ing their genetic diversity.
To identify genetic uniqueness, many countries have eval uated the genetic diversity and relatedness of local breeds using DNA markers such as microsatellites (MS), mitochon drial DNA (mtDNA), copy number variation, and single nucleotide polymorphism (SNP) [811]. In recent years, SNPs have been widely used in genetic research. MS markers are comparatively cheap to genotype and provide more genetic information for the population per marker than SNPs, which are biallelic markers. Moreover, MS markers are easily typed in samples with low concentrations of DNA and enable quick identification of breeds in contrast to SNPs [12]. MS markers, also known as simplesequence repeats, have short tandem repeats of approximately 2 to 6 bp, and because they show codominant inheritance, are highly polymorphic, and are distributed throughout the genome [13,14], they are widely used to assess genetic diversity and relationships in many different fields [1518].
Although many studies have analyzed the genetic diversity and phylogenetic relatedness of chickens using MS markers, they have been limited, as their samples generally only come from breeds of their respective country or of a few countries [1922]. The National Institute of Animal Science (NIAS) in South Korea, however, has been carrying out the Asian Food & Agriculture Cooperation Initiative (AFACI) Animal Ge netic Resources (AnGR) project since 2016, for the purpose of improving the value of animal genetic resources across Asia.
Currently, 12 countries, including South Korea, are designated as member countries; NIAS has established a cooperative system by providing information and technologies for the characterization of animal genetic resources from these coun tries. NIAS is consequently able to utilize a large number of Asian chicken breed samples for scientific research. Conse quently, in this study, we have investigated the genetic diversity and relationships among 22 chicken breeds in eight AFACI member countries including three imported breeds, using 20 MS markers.
MATERIALS AND METHODS
Sample collection and extraction of genomic DNA
A total of 469 chickens, belonging to 19 different chicken breeds from eight different countries and three imported breeds were used in this study. The 22 chicken breeds includ ed six Korean native breeds (KNG, KNB, KNR, KNW, KNY, KNO), four Laotian (LYO, LCH, LBB, LOU), three Indo nesian (INK, INS, ING), two Vietnamese (VTN, VNH), one Kyrgyzstani (KGPS), one Mongolian (MGN), one Nepalese (NPS), one Sri Lankan (SBC), and three imported (RIR, Rhode Island Red; WLG, White Leghorn; CON, Cornish). Detailed information on these breeds can be found in Table 1. Ulnar venous blood of the six Korean native breeds and the three imported breeds was collected from the Animal Genetic Resources Research Center at NIAS. Genomic DNA was extracted from the blood using the Wizard Genomic DNA purification Kit (Promega, Madison, WI, USA) ac cording to the manufacturer’s instructions. Genomic DNA of the other chicken breeds was obtained from each country, for the purposes of the AFACI AnGR project. The DNA concentrations were quantified by UV Spectrophotometer (Nanodrop ND1000; Thermo Scientific, Waltham, MA, USA) and the samples were diluted to a final concentration of 10 ng/μL in distilled water. This experiment was con ducted with the approval of the NIAS Committee on the Ethics of Animal Experiments (approval number: 2018048).
Microsatellite markers and polymerase chain reaction amplification
Ten MS markers were selected from among the International Society for Animal Genetics / Food and Agriculture Organi zation of the United Nations (ISAG/FAO) recommended markers. Another Ten MS markers were selected based on their high heterozygosity in the Ark database website (Roslin Bioinformatics Group, Edinburgh, UK). The information for the twenty MS markers used in this study is available in Sup plementary Table A. Extracted DNAs were amplified by the GeneAmp PCR 9700 system (Applied Biosystems, Foster, CA, USA) using AccuPower Negative dye PCR PreMix (Bi oneer, Daejeon, Korea), including DNA polymerase, dNTP,
TrisHCl, KCL, and MgCl2. The polymerase chain reaction
(PCR) reactions were performed in a total reaction volume of 20 μL containing 2 μL of template DNA, and 0.4 to 2.6 μL (2 pmol/μL) of primer based on the multiplex combinations. The initial denaturation was performed at 95°C for 5 min, followed by 35 cycles of 60 s at 95°C, 45 s of annealing at 58°C to 62°C based on the multiplex combination, 60 s of exten sion at 72°C, a final extension at 72°C for 30 min, and then cooling to 4°C.
Determining allele sizes in each marker
After PCR amplification, the genotyping reaction mixtures were made using 1 μL of the PCR products, 10 μL of HiDi Formamide (Applied Biosystems, USA), and the GeneScan 500 LIZ Size Standard (Applied Biosystems, USA) mixture. The genotyping reaction mixture was denatured for 10 min at 95°C and then immediately placed in ice. Electrophoresis was performed using capillary arrays in an ABI PRISM 3130xl Genetic Analyzer (Applied Biosystems, USA). The allele siz es were determined using GeneMapper Software 5 (Applied Biosystems, USA) and was analyzed statistically.
Statistical analysis
The allele frequencies, the number of alleles, expected het erozygosity (Hexp), observed heterozygosity (Hobs), and
polymorphism information content (PIC) values for each of the chicken breeds across the 20 loci were calculated using the MS Tool Kit [23]. Nei’s DA genetic distances between
breeds were calculated using the DISPAN software [24]. The output file for the neighborjoining (NJ) phylogenetic tree was generated using the PHYLIP package [25] and visual ized using TreeView 1.6 [26].
The genetic structures and the degree of admixture among the 22 chicken breeds were analyzed using the Bayesian clus tering procedure of STRUCTURE ver 2.3.4 [27]. Twenty independent runs were performed for each K value from 2 to 22. For all runs, the admixture models had a burnin pe riod of 20,000 repeats, followed by 100,000 repeats of the Markov chain Monte Carlo algorithm. To identify the K val ue that best fits the data, STURCTURE HARVERSTER [28] was used, which implements the Evanno method [29]. The CLUMPP program ver 1.1.2 [30] was used to align the 20 repetitions of each K value. The CLUMPP output files were visualized using the DISTRUCT program ver 1.1 [31]. Prin cipal coordinate analysis (PCoA) was conducted using the adegenet package [32] in R Studio [33].
RESULTS AND DISCUSSION
Genetic diversity of 22 chicken breeds using MS markers
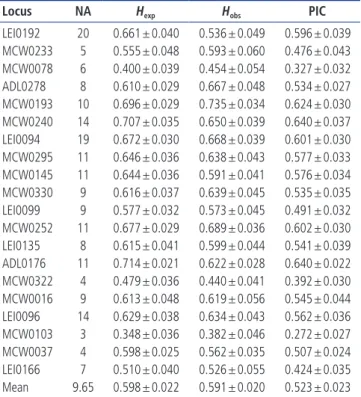
To obtain insight into the genetic diversity and population structures, the Hexp, Hobs, and the PIC value for each locus were
calculated using the MS Tool kit (Table 2). From the 20 MS markers, a total of 193 alleles were identified in the 22 chick en breeds. The number of alleles ranged from 3 (MCW0103) to 20 (LEI0192) (mean 9.65). The means of Hexp, Hobs, and
PIC were 0.598±0.022, 0.591±0.020, and 0.523±0.023, re spectively, for the 20 MS markers. The lowest values of Hexp
(0.348±0.036), Hobs (0.382±0.046), and PIC (0.272±0.027),
were all found at the MCW0103 locus, whereas the highest values of Hexp (0.714±0.021) and PIC (0.640±0.022) were
found at the ADL0176 locus, and the highest value of Hobs
(0.735±0.034) was found at the MCW0193 locus. Moreover, MCW0103 showed low polymorphism levels in previous studies [3436]. Botstein et al [37] reported that MS markers with PIC≥0.5 and Hexp≥0.6 were highly informative for ge
netic analysis. Our study demonstrated that 13 of the 20 MS markers were highly informative for discrimination analysis, and would be appropriate for the analysis of the 22 chicken breeds.
Furthermore, the genetic diversity parameters of the 22 chicken breeds were calculated using the MS Tool Kit (Table 3). The mean number of alleles ranged from 2.15±0.93 (MGN)
Table 1. Description of the 22 chicken breeds used in this study
Country Abbr. Breed samples SourceNo. of Korea RIR Rhode Island Red 32 NIAS
WLG White Leghorn 32
CON Cornish 32
KNG Korean Grayish- brown 32
KNB Koran Black 32
KNR Korean Reddish-brown 32
KNW Korean White 32
KNY Korean Yellowish-brown 32
KNO Korean Ogye 32
Mongolia MGN Mongolian Nuthiin bor 9 NCLG Indonesia INK Indonesian KUB 7 IRIAP
INS Indonesian Sensi 8 ING Indonesian Gaok 8
Kyrgyzstan KGPS Kyrgyzstani GPS-H 24 NASK
Laos LYO Laotian York 7 LRC
LCH Laotian Chae 7
LBB Laotian Black bone 11
LOU Laotian Ou 10
Nepal NPS Nepalese Sakini 27 NARC
Sri Lanka SBC Sri Lankan Junglefowl 15 VRI Vietnam VTN Vietnamese Noi 25 IASVN
VNH Vietnamese Ninh Hoa 23
NIAS, National Institute of Animal Science; NCLG, The National Centre for Live-stock Genebank; IRIAP, Indonesia Research Institute for Animal Production; NASK, National Academy of Sciences of the Kyrgyz Republic; LRC, Livestock Research Center; NARC, Nepal Agricultural Research Council; VRI, Veterinary Research Institute; IASVN, Institute of Animal Sciences for Sourthern Vietnam.
to 6.50±3.02 (NPS). The imported breed WLG showed the lowest Hexp (0.372±0.055), Hobs (0.384±0.019) and MGN
showed the lowest PIC (0.306±0.048), while NPS showed the highest Hexp (0.718±0.027) and PIC (0.663±0.030). Corre
spondingly, although the population size was small, LCH had the highest Hobs (0.690±0.039). Overall, the diversity of
the imported breeds was lower than that of local chicken breeds in 8 countries, except for MGN. This is because the imported breeds have been strongly selected for their per formance characteristics and breeding purpose (meat type, egg type, etc.) for many decades. In our study, the genetic diversity of the Korean native chicken (KNC) breeds was lower than that of the other Asian chicken breeds tested. The reason for this may be that five KNC breeds (KNY, KNR, KNW, KNG, and KNG) were restored in 2008 by NIAS, ac cording to the genetic fixation of their different feather colors [38], and this fixation was absent in the other Asian chicken breeds tested. Thus, we further investigated whether the genetic distances could be discriminated amongst between the 22 chicken breeds.
Genetic distance and phylogenetic analysis among 22 chicken breeds
To further investigate the genetic divergences among the
Table 2. The statistical analysis of heterozygosity and polymorphism information content using 20 microsatellite markers
Locus NA Hexp Hobs PIC
LEI0192 20 0.661 ± 0.040 0.536 ± 0.049 0.596 ± 0.039 MCW0233 5 0.555 ± 0.048 0.593 ± 0.060 0.476 ± 0.043 MCW0078 6 0.400 ± 0.039 0.454 ± 0.054 0.327 ± 0.032 ADL0278 8 0.610 ± 0.029 0.667 ± 0.048 0.534 ± 0.027 MCW0193 10 0.696 ± 0.029 0.735 ± 0.034 0.624 ± 0.030 MCW0240 14 0.707 ± 0.035 0.650 ± 0.039 0.640 ± 0.037 LEI0094 19 0.672 ± 0.030 0.668 ± 0.039 0.601 ± 0.030 MCW0295 11 0.646 ± 0.036 0.638 ± 0.043 0.577 ± 0.033 MCW0145 11 0.644 ± 0.036 0.591 ± 0.041 0.576 ± 0.034 MCW0330 9 0.616 ± 0.037 0.639 ± 0.045 0.535 ± 0.035 LEI0099 9 0.577 ± 0.032 0.573 ± 0.045 0.491 ± 0.032 MCW0252 11 0.677 ± 0.029 0.689 ± 0.036 0.602 ± 0.030 LEI0135 8 0.615 ± 0.041 0.599 ± 0.044 0.541 ± 0.039 ADL0176 11 0.714 ± 0.021 0.622 ± 0.028 0.640 ± 0.022 MCW0322 4 0.479 ± 0.036 0.440 ± 0.041 0.392 ± 0.030 MCW0016 9 0.613 ± 0.048 0.619 ± 0.056 0.545 ± 0.044 LEI0096 14 0.629 ± 0.038 0.634 ± 0.043 0.562 ± 0.036 MCW0103 3 0.348 ± 0.036 0.382 ± 0.046 0.272 ± 0.027 MCW0037 4 0.598 ± 0.025 0.562 ± 0.035 0.507 ± 0.024 LEI0166 7 0.510 ± 0.040 0.526 ± 0.055 0.424 ± 0.035 Mean 9.65 0.598 ± 0.022 0.591 ± 0.020 0.523 ± 0.023
NA, number of alleles; Hexp, expected heterozygosity; Hobs, observed heterozygosity;
PIC, polymorphism information content.
Table 3. Genetic diversity parameters in 22 chicken breeds
Population Sample size No alleles Hexp Hobs PIC
RIR 32 2.80 ± 1.01 0.461 ± 0.042 0.448 ± 0.020 0.391 ± 0.038 WLG 32 2.90 ± 1.25 0.372 ± 0.055 0.384 ± 0.019 0.325 ± 0.049 CON 32 3.40 ± 1.05 0.534 ± 0.032 0.528 ± 0.020 0.461 ± 0.031 KNG 32 3.00 ± 1.08 0.426 ± 0.040 0.466 ± 0.020 0.364 ± 0.034 KNB 32 4.00 ± 1.86 0.569 ± 0.033 0.583 ± 0.020 0.503 ± 0.033 KNR 32 4.35 ± 1.42 0.611 ± 0.038 0.617 ± 0.019 0.550 ± 0.037 KNW 32 3.85 ± 1.42 0.578 ± 0.029 0.566 ± 0.020 0.508 ± 0.031 KNY 32 4.35 ± 1.53 0.586 ± 0.037 0.581 ± 0.020 0.530 ± 0.037 KNO 32 3.20 ± 1.06 0.513 ± 0.043 0.509 ± 0.020 0.443 ± 0.038 MGN 9 2.15 ± 0.93 0.382 ± 0.058 0.515 ± 0.037 0.306 ± 0.048 INK 7 4.45 ± 1.61 0.717 ± 0.036 0.664 ± 0.040 0.614 ± 0.037 INS 8 3.90 ± 1.29 0.654 ± 0.036 0.631 ± 0.038 0.560 ± 0.035 ING 8 4.30 ± 1.34 0.696 ± 0.030 0.656 ± 0.038 0.599 ± 0.031 KGPS 24 4.25 ± 1.16 0.635 ± 0.023 0.618 ± 0.022 0.563 ± 0.024 LYO 7 4.10 ± 1.41 0.654 ± 0.041 0.679 ± 0.039 0.557 ± 0.039 LCH 7 4.25 ± 1.21 0.684 ± 0.035 0.690 ± 0.039 0.584 ± 0.033 LBB 11 4.05 ± 1.50 0.637 ± 0.032 0.686 ± 0.031 0.551 ± 0.034 LOU 10 4.40 ± 1.96 0.683 ± 0.030 0.619 ± 0.035 0.585 ± 0.034 NPS 27 6.50 ± 3.02 0.718 ± 0.027 0.666 ± 0.020 0.663 ± 0.030 SBC 15 4.50 ± 1.24 0.654 ± 0.023 0.563 ± 0.029 0.580 ± 0.023 VTN 25 5.85 ± 2.11 0.686 ± 0.027 0.640 ± 0.021 0.624 ± 0.031 VNH 23 6.30 ± 2.36 0.709 ± 0.026 0.687 ± 0.022 0.650 ± 0.030
Hexp, expected heterozygosity; Hobs, observed heterozygosity; PIC, polymorphism information content; RIR, Rhode Island Red; WLG, White Leghorn; CON, Cornish; KNG, Korean
Grayish-brown; KNB, Korean Black; KNR, Korean Reddish-brown; KNW, Korean White; KNY, Korean Yellowish-brown; KNO, Korean Ogye; MGN, Mongolian Nuthiin bor; INK, Indonesian KUB; INS, Indonesian Sensi; ING, Indonesian Gaok; KGPS, Kyrzyzstani GPS-H; LYO, Laotian York; LCH, Lotian Chae; LBB, Laotian Black Bone; LOU, Latotian Ou; NPS, Nepalese Sakini; SBC, Sri Lankan Junglefowl; VTN, Vietnamese Ninh Hoa; VNH, Vietnamese Ninh Hoa.
breeds using the 20 MS marker allele frequencies, we esti mated Nei’s DA genetic distance between pairs of breeds, for
all 22 chicken breeds, using the DISPAN program (Supple mentary Table B); the shortest genetic distance was between VNH and VTN at 0.086, and the longest was between KNG and MGN at 0.503. Moreover, to understand the evolution ary relationships among the chicken breeds, an NJ phylogenetic tree was constructed using the PHYLIP program based on the DA genetic distance (Figure 1). In our study, three main
branches appear in the phylogenetic tree. The first main branch comprised the KNC breeds (except for KNO), and the RIR and SBC breeds. The WLG, CON, KNO, MGN, and KGPS breeds constituted the second major branch, and this branch was further subdivided into the WLG and CON groups. KNO was grouped with CON, whereas MGN and KGPS were grouped with WLG. The third main branch was comprised of the other Asian chicken breeds. This suggests that the KNC breeds are clearly genetically separated from the other Asian chicken breeds that we studied.
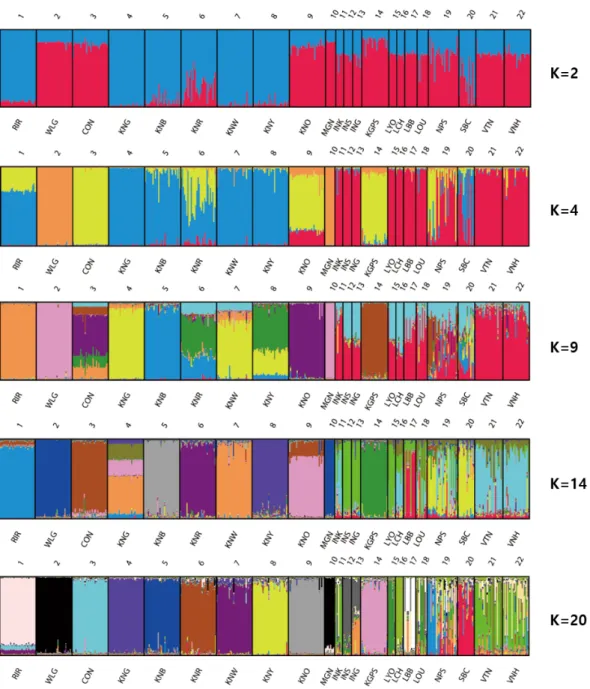
Clustering and principal coordinate analysis
We conducted clustering analysis using Bayesian clustering, which provided more accurate estimates of relatedness of the breeds [39]. According to the STRUCTURE analysis the most probable number of inferred clusters and the K value (ΔK), was K = 20 (46.92). The genetic structures of each chicken breed (for K = 2, 4, 9, 14, and 20) were visualized using DIS TRUCT (Figure 2). For K = 2, the KNC breeds (excepting KNO) and SBC were clustered with RIR, whereas the other Asian chicken breeds were clustered with WLG and CON. WLG and MGN were distinguished from the other breeds at K = 4. These two breeds were found to differ the most in terms of genetic composition, compared with the other breeds. Differentiation from the other breeds began for RIR and KGPS at K = 9, and for CON at K = 14. Based on the CLUMPP analysis at K = 20 (Supplementary Table C), 11 breeds (RIR, WLG, CON, KNG, KNB, KNR, KNW, KNY, KNO, KPGS, and LCH) were detected in independent clus ter and each of these breeds occurred predominantly in one cluster (with more than 84% of its membership in one cluster).
Figure 1. Neighbor-joining phylogenetic tree showing genetic relationships among 22 chicken breeds based on DA genetic distance. It showing the genetic relationships among 22 chicken breeds. RIR, Rhode Island Red; WLG, White Leghorn; CON, Cornish; KNG, Korean Grayish-brown; KNB, Korean Black; KNR, Korean Reddish-brown; KNW, Korean White; KNY, Korean Yellowish-brown; KNO, Korean Ogye; MGN, Mongolian Nuthiin bor; INK, Indonesian KUB; INS, Indonesian Sensi; ING, Indonesian Gaok; KGPS, Kyrzyzstani GPS-H; LYO, Laotian York; LCH, Lotian Chae; LBB, Laotian Black Bone; LOU, Latotian Ou; NPS, Nepalese Sakini; SBC, Sri Lankan Junglefowl.
Moreover, MGN had 88.9% and WLG had 95.1% member ship in cluster 18, and the genetic distances between them were short (0.193). It was difficult to distinguish between WLG and MGN, suggesting that MGN was derived from WLG. SBC was also detected independently in cluster 1, but with a relatively low proportion of membership (68.3%). The proportion of membership of the other breeds ranged from 25.3% to 79.5% in cluster 13 (LOU) and 17 (INS), respectively. Generally, the genetic uniformity of the imported breeds (RIR, WLG, CON) and KNC breeds was higher than that of the
other Asian chicken breeds, except for MGN, KPGS, and LCH. This is probably because these Asian chicken breeds have not gone through genetic fixation processes via strong selection processes. It means they were crossbreed. If genetic uniformity is low, it is difficult to determine whether a breed is distinct from other breeds. Therefore, to increase genetic uniformity, as long as it does not reduce genetic diversity through planned breeding, these Asian chicken breeds should be selected according to their specific purposes.
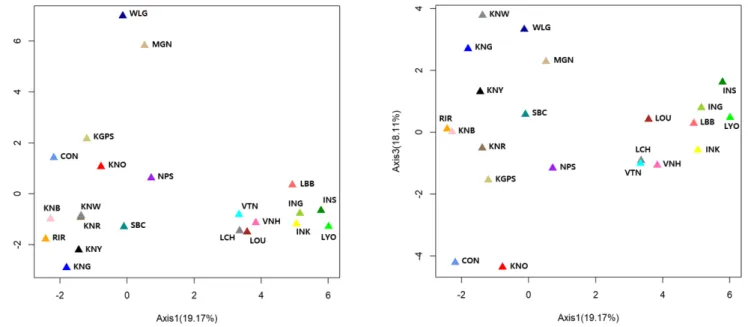
To assess the relatedness of breeds, we carried out PCoA
Figure 2. Clustering assignment of the 22 chicken breeds obtained by STRUCTURE analysis. Each of the 469 chickens is represented by a thin vertical line, which is divided into colored segments which represent the proportional contribution of the inferred K = 4, 9, 14, 20 clusters. The populations are separated by thin vertical black lines. RIR, Rhode Island Red; WLG, White Leghorn; CON, Cornish; KNG, Korean Grayish-brown; KNB, Korean Black; KNR, Korean Reddish-brown; KNW, Korean White; KNY, Korean Yellowish-brown; KNO, Korean Ogye; MGN, Mongolian Nuthiin bor; INK, Indonesian KUB; INS, Indonesian Sensi; ING, Indonesian Gaok; KGPS, Kyrzyzstani GPS-H; LYO, Laotian York; LCH, Lotian Chae; LBB, Laotian Black Bone; LOU, Latotian Ou; NPS, Nepalese Sakini; SBC, Sri Lankan Junglefaowl.
analysis using the allele frequencies of the 20 MS markers (Figure 3). These results were similar to those of our phylo genetic tree and structure analysis. The percentages in the label of each axis indicate the variance explained by the axis. Three axes explained 56.2% of the variance; the first two ex plained 19.17% and 18.92%, respectively, and the third axis explained 18.11%. Remarkably, on the first axis, the Laotian, Vietnamese, and Indonesian chicken breeds were clearly sepa rated from the other breeds. In addition, WLG and MGN were completely isolated from the other breeds on the sec ond axis, whereas the Asian chicken breeds were not clearly separated from each other on this axis. On the other hand, CON and KNO were separated from the other breeds on the third axis.
In conclusion, the genetic diversity of the KNC and im ported breeds was lower than that of the other Asian chicken breeds, whereas their genetic uniformity was higher, except in the MGN, KGPS, and LCH. Therefore, selection for the specific characteristics of Asian chicken breeds used in this study is necessary to increase their genetic uniformity. More over, estimating the genetic diversity between the 22 Asian chicken breeds is the first step in a strategic plan for the genetic characterization and conservation of these breeds. Although the sample size of some of the breeds was small, our findings are meaningful in that the study was conducted using vari ous breeds from different countries. Additionally, this study may be useful as an initial guide for defining conservation objectives, for designing future investigations of genetic vari ation, and for developing conservation strategies for 22 Asian
chicken breeds. However, further research is required to elu cidate the specific reasons for the genetic differences between the Asian breeds and the native Korean and imported breeds.
CONFLICT OF INTEREST
We certify that there is no conflict of interest with any financial organization regarding the material discussed in the manu script.
ACKNOWLEDGMENTS
This work was carried out with the support of the Asian Food & Agriculture Cooperation Initiative (AFACI) Animal Ge netic Resources (AnGR) project “Improving Animal Genetic Resources Value and Productive Performance in Asia,” and the Production and Management of Livestock Genetic Re sources Characteristic Information project (Project No. PJ 01098402) in Rural Development Administration, Republic of Korea.
REFERENCES
1. FAO. Global plan of action for animal genetic resources and the Interlaken declaration. Rome, Italy: International Technical Conference on Animal Genetic Resources for Food and Agri culture; 2007.
2. About the Nagoya Protocol [internet]. Convention on bio logical diversity; c2015 [cited 2019 Dec 16]. Available from:
Figure 3. Principal coordinate analysis (PCoA) of allele frequencies from 20 microsatellite markers in 22 chicken breeds. The percentage of the variation explained by the plotted principal coordinates is indicated on the axes. RIR, Rhode Island Red; WLG, White Leghorn; CON, Cornish; KNG, Korean Grayish-brown; KNB, Korean Black; KNR, Korean Reddish-brown; KNW, Korean White; KNY, Korean Yellowish-brown; KNO, Korean Ogye; MGN, Mrtmiongolian Nuthiin bor; INK, Indonesian KUB; INS, Indonesian Sensi; ING, Indonesian Gaok; KGPS, Kyrzyzstani GPS-H; LYO, Laotian York; LCH, Lotian Chae; LBB, Laotian Black Bone; LOU, Latotian Ou; NPS, Nepalese Sakini; SBC, Sri Lankan Junglefowl; VTN, Vietnamese Ninh Hoa; VNH, Vietnamese Ninh Hoa.
https://www.cbd.int/abs/about/
3. Ajmone‐Marsan P, Garcia JF, Lenstra JA. On the origin of cattle: how aurochs became cattle and colonized the world. Evol Anthropol 2010;19:14857. https://doi.org/10.1002/ evan.20267
4. Felius M, Theunissen B, Lenstra JA. Conservation of cattle genetic resources: the role of breeds. J Agric Sci 2015;153: 15262. https://doi.org/10.1017/S0021859614000124 5. Scherf BD, Pilling D. The second report on the state of the
world's animal genetic resources for food and agriculture. Rome Italy: FAO Commission on Genetic Resources for Food and Agriculture Assessments; 2015.
6. Biscarini F, Nicolazzi EL, Stella A, Boettcher PJ, Gandini G. Challenges and opportunities in genetic improvement of local livestock breeds. Front Genet 2015;6:33. https://doi. org/10.3389/fgene.2015.00033
7. Rischkowsky B, Pilling D. The state of the world's animal genetic resources for food and agriculture. Rome, Italy: FAO; 2007.
8. Kaya M, Yildiz MA. Genetic diversity among Turkish native chickens, Denizli and Gerze, estimated by microsatellite mar kers. Biochem Genet 2008;46:48091. https://doi.org/10. 1007/s1052800891648
9. Medugorac I, Medugorac A, Russ I, et al. Genetic diversity of European cattle breeds highlights the conservation value of traditional unselected breeds with high effective popul ation size. Mol Ecol 2009;18:3394410. https://doi.org/10.1111/ j.1365294X.2009.04286.x
10. Groeneveld LF, Lenstra JA, Eding H, et al. Genetic diversity in farm animals–a review. Anim Genet 2010;41:631. https:// doi.org/10.1111/j.13652052.2010.02038.x
11. Lenstra JA, Groeneveld LF, Eding H, et al. Molecular tools and analytical approaches for the characterization of farm animal genetic diversity. Anim Genet 2012;43:483502. https:// doi.org/10.1111/j.13652052.2011.02309.x
12. Dawson DA, Ball AD, Spurgin LG, et al. Highutility conserved avian microsatellite markers enable parentage and population studies across a wide range of species. BMC Genomics 2013; 14:176. https://doi.org/10.1186/1471216414176
13. Bowcock AM, RuizLinares A, Tomfohrde J, Minch E, Kidd JR, CavalliSforza LL. High resolution of human evolutionary trees with polymorphic microsatellites. Nature 1994;368:455 7. https://doi.org/10.1038/368455a0
14. Cheng HH, Crittenden LB. Microsatellite markers for genetic mapping in the chicken. Poult Sci 1994;73:53946. https://doi. org/10.3382/ps.0730539
15. Hillel J, Groenen MAM, TixierBoichard M, et al. Biodiversity of 52 chicken populations assessed by microsatellite typing of DNA pools. Genet Sel Evol 2003;35:533. https://doi.org/10. 1186/12979686356533
16. AbdulMuneer PM. Application of microsatellite markers in conservation genetics and fisheries management: recent
advances in population structure analysis and conservation strategies. Genet Res Int 2014;2014:Article ID 691759. https:// doi.org/10.1155/2014/691759
17. Bakoumé C, Wickneswari R, Siju S, Rajanaidu N, Kushairi A, Billotte N. Genetic diversity of the world’s largest oil palm (Elaeis guineensis Jacq.) field genebank accessions using micro satellite markers. Genet Resour Crop Evol 2015;62:34960. https://doi.org/10.1007/s1072201401568
18. ElEsawi MA, Germaine K, Bourke P, Malone R. Genetic diversity and population structure of Brassica oleracea germ plasm in Ireland using SSR markers. C R Biol 2016;339:133 40. https://doi.org/10.1016/j.crvi.2016.02.002
19. Cuc NTK, Simianer H, Eding H, et al. Assessing genetic diversity of Vietnamese local chicken breeds using micro satellites. Anim Genet 2010;41:5457. https://doi.org/10.1111/ j.13652052.2010.02039.x
20. Dorji N, Duangjinda M, Phasuk Y. Genetic characterization of Bhutanese native chickens based on an analysis of Red Junglefowl (Gallus gallus gallus and Gallus gallus spadecieus), domestic Southeast Asian and commercial chicken lines (Gallus gallus domesticus). Genet Mol Biol 2012;35:6039. https://doi.org/10.1590/S141547572012005000039
21. Seo JH, Lee JH, Kong HS. Assessment of genetic diversity and phylogenetic relationships of Korean native chicken breeds using microsatellite markers. AsianAustralas J Anim Sci 2017;30:136571. https://doi.org/10.5713/ajas.16.0514 22. Fathi M, ElZarei M, AlHomidan I, AbouEmera O. Genetic
diversity of Saudi native chicken breeds segregating for naked neck and frizzle genes using microsatellite markers. Asian Australas J Anim Sci 2018;31:187180. https://doi.org/10. 5713/ajas.18.0041
23. Park S. Microsatellite Toolkit for MS Excel 97 or 2000, Dublin, Ireland: Molecular Population Genetics Lab, Smurfit Institute of Genetics, Trinity College; 2000.
24. Ota T. DISPAN: genetic distance and phylogenetic analysis. University Park, PA, USA: Pennsylvania State University; 1993.
25. Felsenstein J. PHYLIP (phylogeny inference package), version 3.5 c: Joseph Felsenstein; 1993.
26. Page RDM. Tree View: An application to display phylogenetic trees on personal computers. Bioinformatics 1996;12:3578. https://doi.org/10.1093/bioinformatics/12.4.357
27. Pritchard JK, Stephens M, Donnelly P. Inference of population structure using multilocus genotype data. Genetics 2000;155: 94559.
28. Earl DA, vonHoldt BM. STRUCTURE HARVESTER: a website and program for visualizing STRUCTURE output and imple menting the Evanno method. Conserv Genet Resour 2012;4: 35961. https://doi.org/10.1007/s1268601195487
29. Evanno G, Regnaut S, Goudet J. Detecting the number of clusters of individuals using the software STRUCTURE: a simulation study. Mol Ecol 2005;14:261120. https://doi.org/
10.1111/j.1365294X.2005.02553.x
30. Jakobsson M, Rosenberg NA. CLUMPP: a cluster matching and permutation program for dealing with label switching and multimodality in analysis of population structure. Bioinformatics 2007;23:18016. https://doi.org/10.1093/ bioinformatics/btm233
31. Rosenberg NA. DISTRUCT: a program for the graphical display of population structure. Mol Ecol Notes 2004;4:137 8. https://doi.org/10.1046/j.14718286.2003.00566.x 32. Jombart T. adegenet: a R package for the multivariate analysis
of genetic markers. Bioinformatics 2008;24:14035. https:// doi.org/10.1093/bioinformatics/btn129
33. Allaire J. RStudio: integrated development environment for R. Boston, MA, USA: RStudio, Inc.; 2012. 770 p.
34. Zanetti E, De Marchi M, Dalvit C, Cassandro M. Genetic characterization of local Italian breeds of chickens under going in situ conservation. Poult Sci 2010;89:4207. https:// doi.org/10.3382/ps.200900324
35. Suh S, Sharma A, Lee S, et al. Genetic diversity and relation
ships of Korean chicken breeds based on 30 microsatellite markers. AsianAustralas J Anim Sci 2014;27:1399405. https://doi.org/10.5713/ajas.2014.14016
36. Mahammi FZ, Gaouar SBS, Laloë D, et al. A molecular analysis of the patterns of genetic diversity in local chickens from western Algeria in comparison with commercial lines and wild jungle fowls. J Anim Breed Genet 2016;133:5970. https://doi.org/10.1111/jbg.12151
37. Botstein D, White RL, Skolnick M, Davis RW. Construction of a genetic linkage map in man using restriction fragment length polymorphisms. Am J Hum Genet 1980;32:31431. 38. Seo SW. Molecular genetic evaluation of Korean domestic
animal genetic resources using microsatellite markers [disser tation]. Jinju, Korea: Gyeongsang National University; 2014. 39. Leroy G, Verrier E, Meriaux JC, Rognon X. Genetic diversity
of dog breeds: between‐breed diversity, breed assignation and conservation approaches. Anim Genet 2009;40:33343. https://doi.org/10.1111/j.13652052.2008.01843.x