2007 한국물리탐사학회 · 대한지구물리학회 공동학술대회 2007 년 6 월 7 일(목) ~ 8 일(금), 한국지질자원연구원
Application of SAR algorithm to estimation
of ground material dielectric constant by air launch GPR
Takao Kobayashi
Geotechnical Engineering Div., KIGAM, Korea, [email protected]
Abstract: A novel technique to estimate the dielectric constant of ground material by means of air launching GPR is proposed. The technique is an application of SAR algorithm. A laboratory experiment was conducted to examine the technique.
Keywords: Dielectric constant, SAR, GPR
1. INTRODUCTION
Dielectric constant of ground surface material is often the objective of remote sensing study. We propose a new technique to estimate the dielectric constant of ground surface material by making use of air launching Ground Penetrating Radar (GPR). The proposed technique is based on Synthetic Aperture Radar (SAR) algorithm and stands on that the position of imaged subsurface target depends on assumed dielectric constant of the subsurface medium and the image projection depth, or the target depth. This paper presents the result of a laboratory experiment that was conducted to confirm the proposed technique.
2. SUBSURFACE IMAGING
We apply the side looking SAR technique to image subsurface target which is assumed to be a point object. The subsurface medium is assumed to be homogeneous. Snell’s law is applied to determine the propagation path of a radar pulse. There are two free parameters, the dielectric constant of the subsurface medium and the depth of the subsurface target, to be known in determining the propagation path by Snell’s law. The apparent position of the target image depends on the assumed values of those two parameters. Therefore, we may express the position vector of the apparent position of the target as a function of the dielectric constant ε and the depth d as R(ε,d). A synthetic aperture is virtually regarded as a line segment, l.
We conduct several side-looking SAR observations over the buried target on orbits which are parallel to each other and are on the same plane that is parallel to the ground surface. Relative position of those synthetic apertures are expressed by defining relative position of points of two synthetic apertures lm and ln as
Pn = Pm + ΔRm,n (Pm∈lm, Pn∈ln). (1) Since the imaged target is found at the true position only when the true values of those two free parameters are employed in applying Snell’s law, the true value of the dielectric constant of the subsurface medium and the true depth of the target are found as such values that satisfy
T n(ε,d) - T m(ε,d) = ΔRm,n, (2) where T n(ε,d) and T m(ε,d) are target position vector under given condition of the dielectric constant ε and the depth d.
Takao Kobayashi
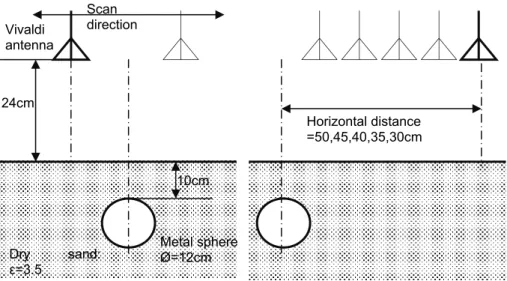
(a) Front view (b) Side view Figure 1. Schematics of the experiment set up.
3. LABORATORY EXPERIMENT
3.1 Experiment setup and condition
A laboratory experiment was conducted to confirm the technique described above.
A metal sphere of which the diameter was 12cm was buried in dry homogeneous sand whose dielectric constant of the sand was 3.5 so as that its top was at the depth of 10cm.The ground (sand) surface was finished flat. A stepped frequency GPR system was built on a commercial vector network analyzer (Agilent 8753) with a pair of Vivaldi antenna (Kobayashi and Ono, 2007). The frequency range was from 395MHz to 5995MHz. The antenna was held so that its lower end was at 24cm above the ground surface. The antenna scans for 1m length. The measurement point interval was 1cm. Several scans were made. The horizontal distances between the scanning lines to the targets were 30, 35, 40, 45, and 50cm (Fig. 1).
3.2 Experiment result
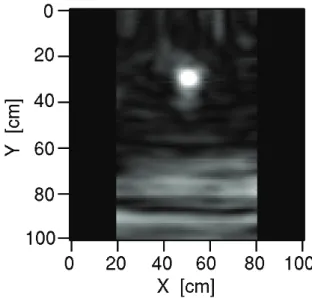
Figure 2 shows the B-scan image of the measurement. The subsurface target echo shows a clear hyperbola pattern. Those horizontal patterns are either from the ground surface or the aluminum structure of the apparatus. Diffraction stacking method (Yilmaz, 2001) with the synthetic aperture of 40cm was applied to obtain a subsurface target image. Snell’s law was applied to define the propagation path of the radar pulse. Figure 3 shows an example of the obtained subsurface images.
3.3 Cross correlation of SAR images
Two dimensional cross correlation was applied to find ΔRm,n of Eq. (2), and, eventually, to find such dielectric constant value and the target depth that satisfy Eq. (1).
In this actual measurement experiment, the target was not an ideal point target.
Horizontal distance
=50,45,40,35,30cm
Metal sphere Ø=12cm
10cm Vivaldi
antenna
24cm
Dry sand:
ε=3.5
Scan direction
Application of SAR algorithm to estimation of ground material dielectric constant by air launch GPR
(a) (b)
Figure 2. B-scan display of a measurement. (a) Raw data, (b) B-scan display after subtracting mean value.
Thus Eq. (1) could be satisfied not only by the exact pair of true values but by some values which were close to the true values. In order to choose a pair of ε and d, we chose such pair of ε and d that gives the maximum correlation value.
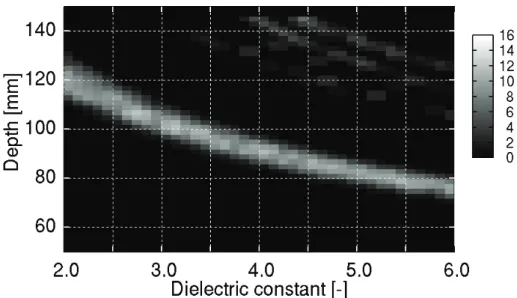
In order to minimize the fluctuation of correlation value, correlation values of 5 measurement results were summed. The distance between scanning lines of these measurements were either 15cm or 20cm. Figure 4 shows the obtained correlation values as the function of dielectric constant of the sand and the target depth. The maximum value of the correlation is found at ε=3.2, d=10.3cm.
Figure 3. SAR image of the subsurface target. ε=3.4, d=104mm were assumed.
Takao Kobayashi
Figure 4. Correlation value as a function of the dielectric constan1t and the depth.
5. CONCLUSION
We have proposed a new technique two estimate the dielectric constant of ground material and a laboratory experiment was conducted to examine the technique. Under the condition that the dielectric constant of the sand and the target depth were 3.5 and 10cm, respectively, the technique found them as 3.2 and 10.3cm, respectively. They may be regarded as fairly good result. The discrepancy is attributed to the finite dimension of the target object. In the technique, we assume a point target while the buried target was a metal sphere of 12cm in diameter. And, reflection points on the sphere distribute over a certain finite area, which result in some ambiguity of target image position.
Dielectric constant of ground material has strong relation to its water content. Thus, the proposed technique can be applied to remote sensing of soil water content. Water content of concrete structure is also a good objective of this technique, in which reinforcing steel is a convenient subsurface target.
6. ACKNOWLEDGMENTS
The laboratory experiment was conducted making use of the facilities of the Landmine Detection Radar Laboratory of Sato Laboratory, Center for North East Asian Studies, Tohoku University, Japan.
7. REFERENCES
Kobayashi. T. and T. Ono, 2006, SAR/InSAR observation by an HF sounder, Journal of Geophysical Research, 112, E03S90, doi:10.1029/2005JE002576, 2007.
Yilmaz, Ö., 2001, Seismic Data Analysis, Society of Exploration Geophysics, Tulsa, Okla.