1. INTRODUCTION
Unlike general radar systems, the synthetic aperture radar (SAR) shoots images while a vehicle moves. A range of image shooting using SAR is called synthetic aperture time (SAT);
in order to synthesize high-quality images, a vehicle should move along the constant velocity straight trajectory within the SAT. However, due to atmospheric disturbance or vehicle's moving, deviation from the nominal track may occur, and this is called motion generation. Such motion should be compensated because images are synthesized under the assumption that a vehicle moves along the nominal track in the SAR image processing procedure (Cheney & Borden 2009,
EGI Velocity Integration Algorithm for SAR Motion Measurement
Soojeong Lee
1, Woo Jung Park
1, Yong-gonjong Park
1, Chan Gook Park
1†, Jong-Hwa Song
2, Chang-Sik Bae
21
Department of Mechanical & Aerospace Engineering/Automation and Systems Research Institute, Seoul National University, Seoul 08826, Korea
2
Avionics Radar Team, Hanwha Systems, Gyeonggi-do 17121, Korea
ABSTRACT
This paper suggests a velocity integration algorithm for Synthetic Aperture Radar (SAR) motion measurement to reduce discontinuity of range error. When using position data from Embedded GPS/INS (EGI) to form SAR image, the discontinuity of the data degrades SAR image quality. In this paper, to reduce the discontinuity of EGI position data, EGI velocity integration is suggested which obtains navigation solution by integrating velocity data from EGI. Simulation shows that the method improves SAR image quality by reducing the discontinuity of range error. INS is a similar algorithm to EGI velocity integration in the way that it also obtains navigation solution by integrating velocity measured by IMU. Comparing INS and EGI velocity integration according to grades of IMU and GPS, EGI velocity integration is more suitable for the real system. Through this, EGI velocity integration is suggested, which improves SAR image quality more than existing algorithms.
Keywords: synthetic aperture radar, discontinuity error, velocity integration
Moreira et al. 2013). In motion compensation, the difference between the nominal track and the vehicle location measured through sensors such as embedded global positioning system (GPS)/inertial navigation system (INS) (EGI) is basically compensated, but the difference between measured and actual locations is not compensated, thus giving an adverse effect on SAR image quality (Oliver & Quegan 2004, Fornaro et al. 2005, Mao et al. 2011). Therefore, to improve the SAR image quality, motion measurements of location deviation from the nominal track should be accurately conducted.
The range error occurs due to position error, and refers to the difference between the distance to the SAR target area calculated at the measured vehicle location and the distance to the target area from the actual vehicle location. However, a relative range error is a more critical consideration than an absolute range error in the SAR system, unlike conventional navigation systems.
This can be verified through previous studies that analyzed the effect of range error types on SAR image quality (Carrara et al. 1995, Kim 2004). Constant-term or linear errors do not significantly influence the SAR image quality, but quadratic errors degrade SAR image resolutions, and cubic errors distort SAR images asymmetrically. In particular, sinusoidal errors or random errors cause image noise, thereby significantly Received Jul 26, 2019 Revised Aug 30, 2019 Accepted Sep 09, 2019
†
Corresponding Author E-mail: [email protected]
Tel: +82-2-880-1675 Fax: +82-2-873-1732
Soojeong Lee https://orcid.org/0000-0002-0739-7923
Woo Jung Park https://orcid.org/0000-0002-0140-749X
Yong-gonjong Park https://orcid.org/0000-0003-1582-4582
Chan Gook Park https://orcid.org/0000-0002-7403-951X
Jong-Hwa Song https://orcid.org/0000-0002-9774-4043
Chang-Sik Bae https://orcid.org/0000-0002-3201-3848
degrading the SAR image quality. As described above, the larger the relative error—that is, the larger the discontinuity of range—
the larger the effect on SAR image quality.
When the position information of EGI, which is mounted to measure a vehicle location, is directly used, SAR image quality is significantly deteriorated due to the discontinuity of range error. Thus, discontinuity should be reduced through integration of EGI velocity information in order to improve SAR image quality. The result is comparatively analyzed with that using INS, thereby confirming that EGI velocity integration not only effectively removes the discontinuity of range errors but also is suitable to the actual system.
This paper is organized as follows. Section 2 explains the velocity integration algorithm, and in Section 3, EGI, INS, and EGI velocity integration performances are comparatively analyzed through simulation. Finally, in Section 4, the conclusions of this study are summarized.
2. EGI VELOCITY INTEGRATION ALGORITHM
EGI is generally mounted to the center of gravity of a vehicle to obtain position information of the vehicle. EGI is a navigation system that estimates a vehicle position. In the estimation process, it uses Kalman filter to combine the navigation solution obtained through INS, which integrates acceleration and angular velocity acquired through inertial measurement unit (IMU) twice, and the position information measured by the GPS (Titterton & Weston 2004). In general, a sampling rate of IMU is faster than that of GPS. Thus, when position information is updated using GPS measurements, discontinuity occurs.
Since the discontinuity error adversely affects SAR image quality, such as image noise generation, it is difficult to obtain high-quality SAR images if EGI position information is directly used (Carrara et al. 1995). The discontinuity error of EGI position information in centimeter (cm) unit is not considered because it does not affect the system property significantly in general systems other than SAR system. However, if the phase discontinuity error is greater than π/4, SAR image quality is significantly degraded (Carrara et al. 1995). To calculate a size of the position error, when a relation between position error r and phase error Φ is used as presented in Eq. (1), about 1.9 mm or smaller discontinuity error is required when a length of X-band wavelength λ (3 cm) used in a general SAR system is substituted.
Thus, EGI position information whose discontinuity is in cm unit degrades SAR image quality. To overcome the problem, we propose EGI velocity integration that estimates position by integrating EGI velocity information without using EGI position information, resulting in discontinuity reduction. Fig. 1
shows the block diagram of EGI velocity integration. Due to the position difference between the SAR antenna and the center of gravity where EGI is mounted, EGI position, velocity, and attitude information must be lever arm compensated before integrating EGI velocity information as presented in Eqs. (2-5).
r 4 λ
= π Φ (1)
n n n b
IMU EGI b EGI
p = p - DC l (2)
n n n b b
IMU EGI b nb EGI
v = v -C Ω l (3)
n n
IMU EGI
a = a (4)
where where 1 , 1 , 1
( )cos
M P
diag R h R h L
= + + −
D (5)
Here, l
bEGIrefers to the lever arm vector between EGI and IMU in the body coordinate system. p
nIMUand p
nEGIare the positions of IMU and EGI in the navigation coordinate system. v
nIMUand v
nEGIrefer to the velocities of IMU and EGI in the navigation coordinate system. a
nIMUand a
nEGIare the attitudes of IMU and EGI in the navigation coordinate system. C
nbis the direction cosine matrix, Ω
bnbis the acceleration in the navigation coordinate system, R
Mis the median radius of Earth's curvature, R
pis the prime radius of Earth's curvature, and h, L refer to the altitude and latitude of vehicle's center of gravity, respectively.
The velocity information is integrated as presented in Eq.
(6) after completing the lever arm compensation through the above process, thereby obtaining the k-th position information.
t
k k-1 k-1
∆
p = p + v (6)
Here, p
kis the k-th position information of the SAR antenna obtained through EGI velocity integration, v
kis the k-th velocity information that is lever arm compensated, and Δt refers to a time interval between samples.
3. SIMULATION RESULTS
3.1 Simulation Conditions
To verify the algorithm proposed in this study, 50 times of
Monte Carlo simulations were conducted. The simulation was
Fig. 1. Block diagram of EGI velocity integration (P: position, V: velocity).
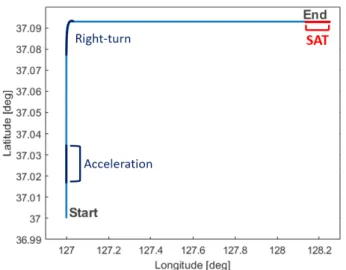
run for 500 sec, in which a vehicle started with an initial velocity of 100 m/s and was accelerated for 10 sec at a rate of 15 m/s
2after 20 sec. Then, it was turned right at 90 degrees for 10 sec at a place after 50 sec elapsed from the departure time. After the above acceleration and turning operation are conducted, the estimate accuracy of accelerometer bias and gyro bias can be improved in the EGI navigation filter. In this way, this study aimed to raise the SAR image quality by performing motion measurement algorithm in the SAR range after reducing the navigation error. Then, the vehicle followed the constant velocity straight trajectory until the simulation ends, and SAR image was obtained for the last 10 sec. The whole trajectory in the simulation is shown in Fig. 2. The specifications of the used EGI and IMU are presented in Tables 1 and 2. The IMU, that is, accelerometer and gyroscope in the EGI system has an output value of 50 Hz, and the measurement update using GPS position information is done at 1 Hz. The IMU mounted on the SAR antenna has an output value of 200 Hz. It was assumed that the biases of IMU mounted on the antenna and EGI had a random constant error model and GPS had a Gaussian noise of 1 m. With the above assumption and simulations, the position error during SAT was calculated.
With the position error obtained, the impulse response function (IRF) and SAR images were obtained through the spotlight SAR simulator that had the parameters presented in Table 3. Then, SAR image quality index values such as resolution, peak side lobe ratio (PSLR), and integrated side lobe ratio (ISLR) were calculated. Resolution refers to the minimum distance at which two points can be distinguished, and PSLR and ISLR refer to a contrast level between dark and light parts in the image. In particular, the SAR system is different from general systems in terms of how to represent a resolution. A value of resolution in general systems is represented through a length, and is the same as the width at
-3 dB of the IRF. In contrast, a resolution in the SAR system represents a degree of increase based on the resolution length in the ideal case without errors. That is, it has a value of 1 in the ideal case without errors, and a value of greater than 1 when SAR image quality is degraded due to phase errors.
3.2 Comparison of EGI and EGI Velocity Integration
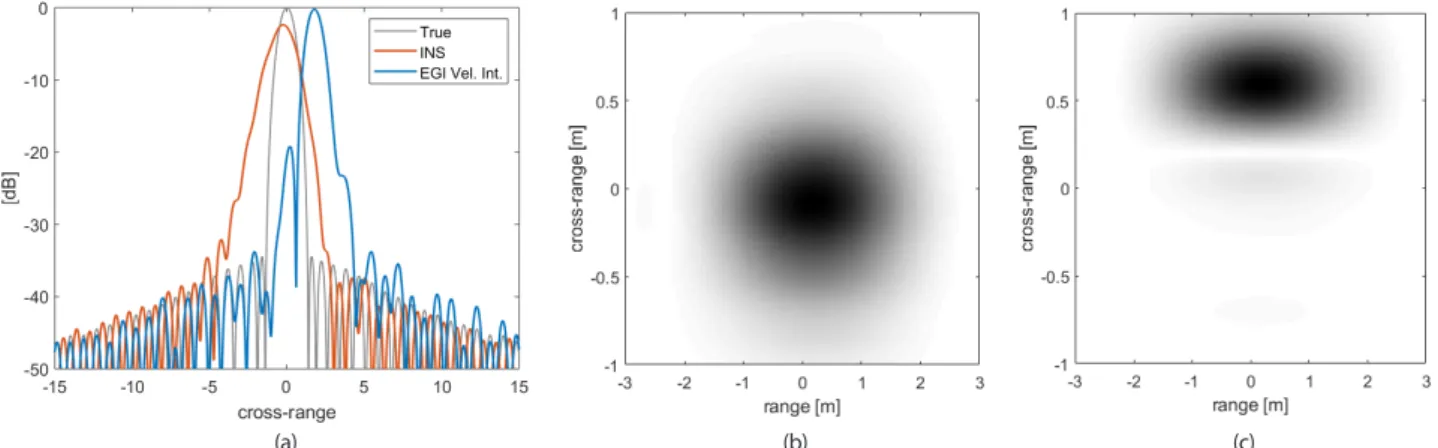
To verify whether the EGI velocity integration removed the discontinuity error of EGI position information effectively, the SAR images obtained using EGI position information and through EGI velocity integration were compared, as shown in Fig. 3. The quality of SAR image obtained through EGI was not good because the discontinuity due to the measurement update was reflected in the position information. However, as for EGI velocity integration, the quality of SAR image was improved compared to EGI, as it employed velocity integration information instead of EGI position information where the discontinuity was reflected. This result verified that the image noise was reduced because EGI velocity integration reduced the discontinuity errors of EGI position information. Table 4 presents the means of SAR image quality indices obtained through each of the methods. Table 4 shows that the EGI velocity integration had better performance in all three indices than EGI. In particular, a substantial difference was exhibited in PSLR and ISLR, which were significantly affected by the discontinuity error.
Fig. 2. Simulation trajectory.
Table 1. EGI specification (navigation grade IMU).
Sensor Parameter Value (1-σ)
Accelerometer Gyroscope GPS
Bias
Velocity random walk Sampling rate Bias
Angular random walk Sampling rate Position accuracy Sampling rate
25 μg 2.5 μg 50 Hz 0.003 deg/hr 0.001 deg/rhr 50 Hz 1 m 1 Hz
Table 3. Specification of spotlight SAR simulation.
Parameter Value
Pulse repetition frequency SAT
Range distance of target area Bandwidth
1,000 Hz 10 sec 45 km 50 MHz Table 2. Specification of IMU mounted on SAR antenna (tactical grade).
Sensor Parameter Value (1-σ)
Accelerometer Gyroscope
Bias
Velocity random walk Sampling rate Bias
Angular random walk Sampling rate
200 μg
20 μg
200 Hz
1 deg/hr
0.07 deg/rhr
200 Hz
Fig. 3. IRF and SAR images by EGI position and EGI velocity integration. (a) IRFs (b) SAR image by EGI position (c) SAR image by EGI velocity integration
(a) (b) (c)
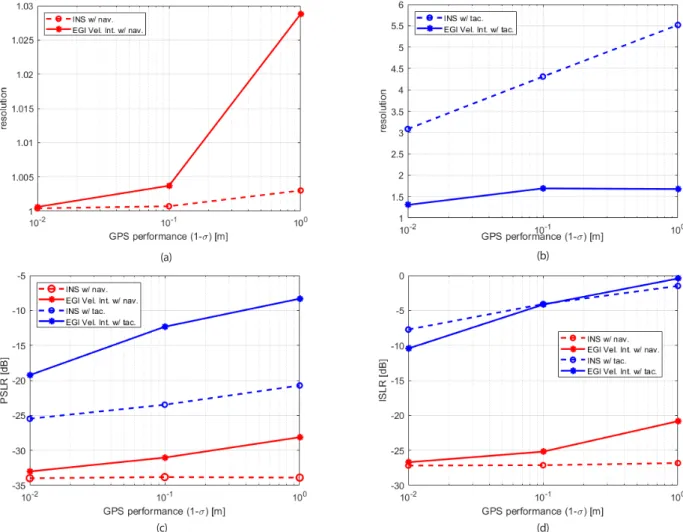
Fig. 4. SAR image quality by INS and EGI velocity integration according to performances of IMU and GPS. (a) Resolution with navigation grade IMU (b) Resolution with tactical grade IMU (c) PSLR (d) ISLR
(a)
(c) (d)
(b) Table 4. Mean of SAR image quality index by EGI and EGI velocity
integration.
Algorithm Resolution PSLR [dB] ISLR [dB]
EGI position
EGI velocity integration 1.4414
1.029 -6.0143
-28.3459 7.1953 -20.7891
Table 5. Mean of SAR image quality index by INS and EGI velocity integration.
Algorithm Resolution PSLR [dB] ISLR [dB]