Geosciences Journal
Vol. 12, No. 1, p. 83−93, March 2008 DOI 10.1007/s12303-008-0010-0
Evaluation of geotechnical properties of saturated soil using dielectric responses
ABSTRACT: In the field of geotechnical environment, physical parameters of soil such as volumetric water content, degree of sat- uration, porosity and effective porosity are important hydrological factors. Especially, these parameters can be applied to the analysis of slope failure, groundwater recharge and infiltration of various substances into the ground by rainfall. In the case of a landslide induced by heavy rainfall, landslide monitoring is one of impor- tant technologies that detects the distribution of volumetric water content, wetting front movement, and infiltration characteristics for the earth materials. The infiltration of water mainly occurs through pores of porous media. Infiltration of fluid substances is controlled by the connectivity of pore spaces. Therefore, it is explained by the concepts of porosity and effective porosity. In this study, the applicability of dielectric methods and proposed dielec- tric mixing models (DMMs) are discussed, and a soil column lab- oratory test is performed for measuring effective porosity of fully saturated sand using the permittivity method. This study showed that the ratios of effective porosity to porosity of saturated stan- dard sands and river sands were 0.856 and 0.843, respectively.
Based on the experimental results, using the frequency domain reflectometry (FDR) and frequency domain reflectometry with vector network analyzer (FDR-V) systems, the relative effective porosity is almost over 85 % of the relative porosity in the satu- rated standard sands and river sands. Consequently, the dielectric measurement systems are considered to be effective in measuring the physical parameters of saturated soil. Moreover, this dielectric method can contribute to estimate porosity and effective porosity of saturated porous media because it is easier and faster than the previous in-situ methods.
Key words: dielectric constant, dielectric mixing models (DMMs), saturated soil, porosity, effective porosity
1. INTRODUCTION
Dielectric technology has been applied to a variety of research for the measurement of physical properties of the ground using dielectric responses (Oh et al., 2007; Alimi- Ichola and Gaidi, 2006; Turesson, 2006; Campbell et al., 2002). This technology plays an important role in estimat- ing the groundwater and contaminant movements in porous media. Dielectric constant is an electrical property and has
unique characteristics for all porous materials. For example, dielectric constants of water, air and soil particle are 80, 1 and 3, respectively. These dielectric characteristics show the physical values of soil. Using the dielectric properties of earth materials, volumetric water content in the soil can be computed.
In the case of a landslide induced by heavy rainfall, land- slide monitoring is one of important technologies that detects a distribution of volumetric water content in porous media. The infiltration of water mainly occurs through the pores of porous media. Infiltration of fluid substances is controlled by the connectivity of pore spaces. Therefore, it is explained by concepts of porosity and effective porosity.
The former is the ratio of pore space to the total volume, and the latter is the degree of interconnection of pores in porous media. Effective porosity generally plays an impor- tant role in the fluid path of porous media.
In order to estimate physical parameters in porous media, many researchers have conducted in-situ experiments with a variety of applied tracer tests and well tests using bore holes in the field (Kim et al., 2005; Tonder et al., 2002;
Singh, 2002; Ii et al., 1996). Furthermore, several research- ers carried out laboratory column tests for measuring phys- ical parameters of a fine grained material such as clay, silt and bentonite (Zheng et al., 2002; Kim et al., 1997). Li et al. (1996) reported that the hydrologic properties governing fluid flow in the sub-surface are porosity, permeability, pore spatial distribution, and grain particle size distribution.
Therefore, variations of movement and attenuation of the tracer material easily change hydrologic properties in the sub-surface porous media due to chemical and bio-chemical processes. The aims of these applied tracer experiments can be explained to estimate the velocity of groundwater, coef- ficient of advection or dispersion, porosity or effective porosity of saturated porous media due to movement veloc- ity of tracer materials in the field or in the laboratory. How- ever, the previous studies required long experiment periods and high costs for estimating these physical parameters by an applied tracer experiment. Despite these experiments, Man-Il Kim
Byung-Gon Chae*
Makoto Nishigaki
Geological and Environmental Hazards Division, Korea Institute of Geoscience and Mineral Resources, Daejeon 305-350, Korea
Geological and Environmental Hazards Division, Korea Institute of Geoscience and Mineral Resources, Daejeon 305-350, Korea
Department of Environmental and Civil Engineering, Faculty of Environmental Science and Technology, Okayama University, Okayama 700-8530, Japan
*Corresponding author: [email protected]
quantitative results show difficulties in estimating an exact parameter. Hence, a practical measurement method with low cost is required to know the parameters in the field and in the laboratory.
In order to understand the characteristics of geological texture of porous media, many researchers have used an applied time domain reflectometry (TDR) study method which has been carried out for soils and rocks related to the response of the relative dielectric constant. It is also applied in estimating the volumetric water content, soil density, concentration of salinity and other parameters in the sub-sur- face (Drnevich et al., 2001 and 2005; Chenaf and Amara, 2001; Jones and Or, 2001; Kan et al., 2001; Rassam and Williams, 1997; Topp et al., 1980). These studies explain that TDR method is able to provide quantitative physical profiles of porous media as well as a short measurement period. Physical parameters of porous media can also be easily estimated using the response of dielectric properties of the ground.
In this study, the authors proposed a dielectric measure- ment method using permittivity systems such as frequency domain reflectometry (FDR) and frequency domain reflec- tometry with vector network analyzer (FDR-V) systems to estimate porosity and effective porosity of saturated soil media. In order to discuss an in-situ experiment using per- mittivity systems, a soil column injection experiment was performed using fully saturated standard sands and river sands by the FDR and FDR-V systems in the laboratory. It is mainly composed of two kinds of column experiments:
one is an injection test, and the other is a replacement test using the two permittivity systems. The calculated effective porosity was compared with results from both the permit- tivity methods and the soil column replacement test. The authors examined the feasibility of the permittivity method using the FDR and FDR-V systems and the relationship between porosity and effective porosity through the whole experiment. Especially, the authors verified an accuracy of effective porosity from the relationship between injection, replacement and tracer tests.
2. DEVELOPMENT OF DIELECTRIC MIXING MODELS
2.1. Theory of Dielectric Mixing Models
Soil is mainly composed of three phase materials such as soil particles, air and water in the geological environment.
Air and water exist in the pore spaces between soil parti- cles. Therefore, the difference between the saturated and unsaturated condition can be explained as the nature of dis- tribution of water in the soil pore spaces. Soil contains water between soil particles as well as bound water around soil grain particles. Volumetric water content might conse- quently represent a degree of saturation for artificial or nat-
ural soil, and determined by a response of the dielectric constant by the permittivity methods. Dielectric responses have a strong influence for water because the dipole struc- ture of water is greatly larger than other porous materials such as air and soil particles. Therefore, the measurement of the dielectric constant for a sample material is influenced by the amount of volumetric water content in soil pores.
For detecting the variation of dielectric constant in the soil the authors used ethanol liquid as a dielectric tracer material. It is easily detected because its dielectric constant is lower than that of water. Ethanol liquid was used as a tracer injection material with a function of replacement for pore water in soil particles. During the tracer injection, soil composition does not change during the infiltration of the injected ethanol liquid to the connected effective pores in saturated soil media. Therefore, saturated soil is changed to an ethanol-saturated condition. The dielectric constant is changed slowly, dependent on the effect of infiltrated eth- anol around soil particles. The variations of dielectric con- stant by ethanol liquid can be detected through the ethanol injection with travel time.
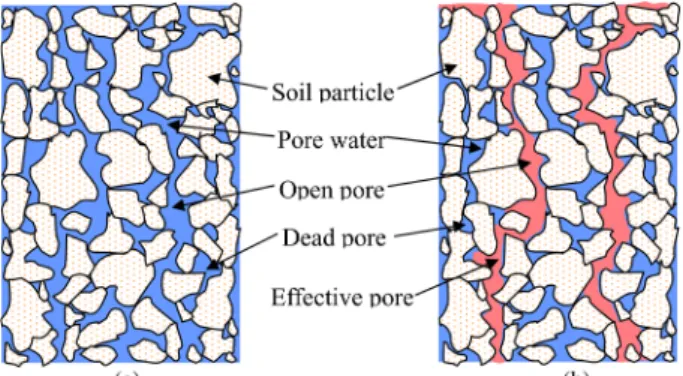
Figure 1 shows the displacement processes by injecting ethanol into saturated soil media. The soil structure is com- posed of soil particles, micro and macro pores, and mobile and immobile water. Most fluid materials infiltrate along connected pores which are called effective porosity. The ratio of effective porosity for soil is smaller than the ratio of porosity which differs in soil conditions between saturated and unsaturated status (Stephens, 1995). The influence of ethanol infiltration is represented by the response of the dielectric constant shown in Figure 2. It shows the variation of the dielectric constant by injecting ethanol which infil- trates along with the distribution of effective porosity.
The standard values of the dielectric constant for a variety of porous materials have already been reported by Curtis and Defandorf (1929). For example, the dielectric constant of water, air and soil particles are about 80, 1 and 2-3, respectively, at 20oC. Using variations of the measured dielectric constant of saturated soil media, dielectric mixing
Fig. 1. Displacement processes by injecting ethanol liquid into sat- urated soil porous media: (a) Saturated soil constituent filled with water in pores (b) Fluid passage along effective pores.
models (DMMs) were proposed. The proposed DMMs are original models in this study and are based on each dielec- tric constant of the porous media which can adapt to the limitation of a fully saturated soil condition. The DMMs were conducted to calculate the porosity and the effective porosity for manufactured soil columns using the FDR and the FDR-V systems.
The DMMs are composed of several physical parameters of soil porosity, dielectric constant of water and soil parti- cle. They measure the initial and/or final dielectric constant of saturated soil which is detected on permittivity systems.
The proposed DMMs can be described by the following dielectric formula:
(1) where εs, εw, εinitial, and n are the dielectric constants of soil particle, water, saturated soil before injecting ethanol, and soil porosity, respectively.
The initial dielectric constant is determined by the response of the dielectric constant of soil particles and pore water in the saturated soil. These dielectric processes could be acquired by a change of micro position between pre-exist- ing pore water and injected ethanol liquid under saturated soil conditions. This replacement reaction has a close rela- tionship with soil porosity that is a physical micro constit- uent of soil.
In general, pores of soil are connected or dead-end between soil particles. Therefore, porosity can be explained as a concept of micro-space distribution of pores under soil physical conditions. Effective pores are designated as a con- nected micro-space with the infiltration of fluids in soil.
They should be considered as a concept of effective poros- ity that offers a micro path of fluid material through the connected effective pores.
An effective porosity for saturated soil can determine a response of the dielectric constant during the injection of
ethanol liquid into pore water in the soil. The infiltration process of pore water occurs through the effective pores which make a micro path in the soil constituent. Variations of dielectric constant of ethanol liquid have a relationship between εeth·ne and εw(n−ne) because ethanol liquid move- ment is controlled by effective porosity. The final dielectric constant is measured after injecting ethanol liquid into sat- urated soil. The proposed DMMs can be described by the following dielectric formula:
(2) where εeth, εfinal and ne are the dielectric constant of ethanol liquid, saturated soil after injecting ethanol, and effective porosity, respectively. After rearranging equations (1) and (2), the following equations can be derived for a porosity and an effective porosity using the response of dielectric constant of materials which is measured by FDR and FDR- V measurement systems.
(3) (4)
2.2. Dielectric Permittivity Systems Based on DMMs The purposes of this experiment are to understand the effects of dielectric response in saturated soil using two per- mittivity systems, and to attempt to measure physical parame- ters, porosity and effective porosity by dielectric mixing models (DMMs).
One of the two permittivity systems is a frequency domain reflectometry (FDR) system and the other is a fre- quency domain reflectometry with vector network analyzer εinitial =(1–n)εs+n ε⋅ w
εfinal =(1–n)εs+(n n– e)εw+ne⋅εeth
n εs–εinitial
εs–εw
---
=
ne εinitial–εfinal
εw–εeth
---
= Fig. 2. Conceptual diagram of the response of dielectric constant
during ethanol injection in the saturated soil; (a) determination of the initial dielectric constant (not injection work); (b) reaction of dispersion by injection material during the injection; (c) determi- nation of the final dielectric constant after the injection.
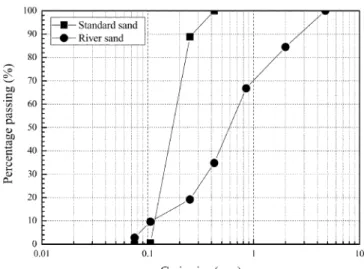
Fig. 3. Soil particle distribution curve.
(FDR-V) system. These permittivity systems were used to measure a relative dielectric constant of fully saturated sands under various experimental conditions. The authors used the back pressure method (Shackelford and Redmond, 1995; Shackelford, 1994; Tada, 1994; Campbell, 1973) in order to understand the degree of saturation for manufac-
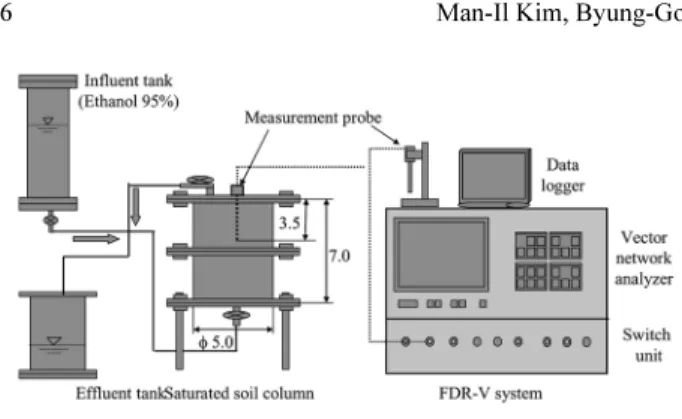
tured soil columns. The FDR-V system consists of mainly three components such as vector network analyzer, switch unit and data logger (Fig. 4a). The vector network analyzer controls all system functions. The switch unit is connected to a coaxial measurement probe with a 50-ohm coaxial transmit cable. The data logger controls the FDR-V system and collects experimental data with constant travel time during the whole experiment. FDR-V system utilizes a microwave frequency ranging from 0.1 to 3.0 GHz. The measurement range of its probe is about 0.2 cm in diameter at the end of measurement probe tip in soil, and measure- ment frequency is only 1 GHz. The FDR system using a response of impedance of the frequency range is one of the permittivity methods measuring soil physical parameters at certain depths of the sub-surface. It consists of three com- ponents such as spectrum analyzer, switch unit and data logger (Fig. 4b). A FDR measurement probe is installed as a measurement point on the sample, and then, it measures a relative dielectric constant of soil material, instanta- neously. The measurement range of an FDR measurement probe in soil is at least 4 cm in diameter and 2 cm at the end of the probe tip. The frequency range of FDR system is 0.1 to 1.7 GHz.
2.3. Calibration of Permittivity Systems
Measurement of the dielectric constant using the time domain reflectometry (TDR) method uses a response of travel time of electromagnetic wave in the soil medium.
The travel time with a TDR waveform shows the influence of reflection wave and attenuation in conductive media dependent at a contact point between the measurement probe and soil media which is an insulation material (O’Connor and Dowding, 1999; Santamarina et al., 2001).
In this study the authors used the FDR and the FDR-V systems which have a specific frequency range and the measurement of the dielectric constant by its frequency property. As mentioned above, the frequency range of FDR system is 0.1 to 1.7 GHz and its FDR-V system uses 0.1 to 3.0 GHz. From the frequency property of both permittivity systems, the authors used a frequency range of 1 GHz for determining a dielectric constant for porous media. Mea- surements of the dielectric constant for soil medium under the FDR and the FDR-V systems were easier and faster than TDR system method. It can be explained that two per- mittivity systems are used at a specific frequency property of 1 GHz which has no dependency of travel time during measurement of the dielectric constant. On the other hand, Fig. 4. Schematic diagram of the whole soil column experiments
by the FDR system and the FDR-V system.
Table 1. Physical properties of soils
Soil Distribution of Particle Size, % Specific
Gravity, g/cm3
Uniformity Coefficient, U Gravel 60-2 mm Sand 2-0.06 mm Silt 0.06-0.002 mm Clay >0.002 mm
Standard 0.00 99.90 0.10 0.00 2.65 1.61
River 15.50 81.70 2.80 1.00 2.69 6.93
TDR system method is used over the whole travel time of electromagnetic waveform (O’Connor and Dowding, 1999).
The calibration processes of the measurement probe for the FDR and the FDR-V systems were performed using a calibration liquid such as acetone and purified water. The dielectric constants of calibration liquid are already known to be 21 for acetone and 80 for purified water at 20oC. And then, the authors were able to confirm the dielectric con- stants of air (εa=1), tap water (εw=80), ethanol (εeth=15), and soil (εs=2-5) by comparing with reference values reported by Curtis and Defandorf (1929) for materials, respectively (Table 3).
3. EXPERIMENTS 3.1. Soil Materials
In order to estimate porosity and effective porosity, two soil materials such as standard sands and river sands were prepared. Table 1 and Figure 3 show the results of grain size distribution for each sand from the sieve test. Accord- ing to the soil particle size distribution curves, standard sands represent a very sharp gradient because it is com- posed of coarse size material of more than 90%; river sands show an irregular feature because they contain variable
grain sizes from very coarse to fine grain size. Therefore, standard sands can be considered to be the uniform sand, i.e., most of the grains are the same grain size and the uni- formity coefficient was 1.61 from plotted soil particle dis- tribution curve. The uniformity coefficient of river sands was also calculated as 6.93. However, the uniformity coef- ficient of uniform soil was theoretically assumed to be 1.00 (Head, 1980). Here, the river sands showed different grad- ing curve from coarse gravel to fine silt. The content of fine grained material such as silt and clay for river sands showed larger values than standard sand, which plays an important role in interrupting the movement of some liquid material.
3.2. Experiment Procedure
In this study, the authors carried out three kinds of soil column experiments such as soil column injection test, soil column replacement test and soil column tracer test. The authors used the ethanol liquid for injection and replace- ment tests and a tracer of saline water at 3% NaCl for tracer test (Fig. 4c).
For measurement of the soil physical parameters, the response of the dielectric constant on saturated soil was measured with the measurement probes which were installed in saturated soil media, and it was detected in the range of frequency at 1 GHz of two permittivity systems.
In the dielectric experiments, dielectric measurement probes used a one-line-type coaxial probe with 3 cm in length and 0.5 cm in diameter for FDR-V system and a one- line-type coaxial copper probe with 15 cm in length and 0.22 cm in diameter for FDR system. The manufactured acrylic column has 6cm in diameter and 20 cm in height for FDR system, and 5 cm in diameter and 7 cm in height for FDR-V system that applied the soil injection and soil replacement tests. These measurement probes were verti- cally set up at the upper center point in the saturated soil column. In case of the soil column tracer test, the measure- ment of saline concentration change using an acrylic col- umn with 5 cm in diameter and 15 cm in height was carried out in the lower part of soil column with installation of FDR measurement probe. The degree of saturation for soil column was calculated using the back pressure method (Shackelford and Redmond, 1995; Tada, 1994; Campbell, 1973).
The saturated standard sands and the river sands were used in all tests, which were conditioned to have an estab- lished porosity of 0.35, 0.40 and 0.45, respectively. The soil column molds, having established porosity for soil column tests, were manufactured by using equation (5) as follow:
(5) where Ws, Vt, Gs, and n is soil weight (g), total volume of soil (cm3), specific gravity of soil, and established porosity,
Ws Gs 1 n= ( – ) V⋅ t
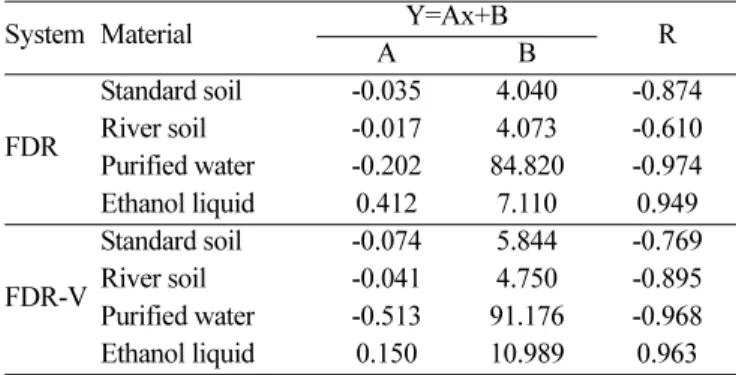
Table 2. Linear regression for each material for dielectric systems
System Material Y=Ax+B
A B R
FDR
Standard soil -0.035 4.040 -0.874
River soil -0.017 4.073 -0.610
Purified water -0.202 84.820 -0.974
Ethanol liquid 0.412 7.110 0.949
FDR-V
Standard soil -0.074 5.844 -0.769
River soil -0.041 4.750 -0.895
Purified water -0.513 91.176 -0.968
Ethanol liquid 0.150 10.989 0.963
Table 3. Dielectric constants of several materials
Material Dielectric constant, ε
Air 1(0.85-1.21 at 20oC)*
Water 80 at 20oC (79.50-80.24)*
Ice 3 at -5oC*
Basalt 12
Granite 7-9
Sandstone 9-11
Dry loam 3.5
Dry sand 2.5 (2.5-3.5 at 20oC)*
Ethanol liquid 15.21 at 20oC*
Ethanol Mixing Liquid 39.82 at 20oC*
Acetone 21.20 at 20oC*
*measured dielectric constant in this study
respectively. The authors considered the term of porosity;
one of which is a physical porosity, and the other is a cal- culated porosity. The former is measured by the gravimetric method which calculates the proportion of total volume of soil column and volume of soil. And the latter is estimated by dielectric mixing models (DMMs) using the responses of initial dielectric constant.
In the soil column injection test, the FDR and the FDR- V systems were used to measure dielectric constants of the initial and the final values through the whole injection test.
Using the initial dielectric constant and the final dielectric constant, the calculated porosity and the calculated effective porosity were estimated by using the proposed DMMs.
Soil column replacement tests were simultaneously con- ducted with the soil column injection test to measure the simple parameters such as total effluent quantity, total injected ethanol quantity and concentration of effluent quantity.
Another tracer test was also performed to know an actual flow velocity from the relationship between variations of tracer concentration using a fraction collector. Soil column replacement test and tracer test were calculated to the effec- tive porosity according to the ratio of ethanol concentration infiltrated along to effective pores in the soil medium.
Soil physical parameters were calculated to substitute the measured dielectric constants, εinitial and εfinal, for the DMMs in the soil column injection and replacement tests. The cor- relation of the Darcy velocity with actual velocity determines a breakthrough curve having a saline water concentration related to time in the soil column tracer test.
4. EXPERIMENTAL RESULTS AND DISCUSSION 4.1. Response of Dielectric Constant Due to the Volumetric Water Content
The calibration curve reported by Topp et al. (1980) of the soils is very important to understand the relationship between volumetric water content and relative dielectric constant. It makes it easy to estimate a volumetric water content, soil density and degree of saturation by comparing
the measured relative dielectric constant of various porous media in the laboratory or in the field. The variations of dielectric constant are induced by the difference of dielec- tric constants for each porous material (Noborio, 2001).
From the dielectric variation influenced by pore water, mea- surement of volumetric water content using the responses of dielectric constant is possible. The most commonly used relationship between dielectric constant and volumetric water content was proposed by Topp et al. (1980):
(6) where θ and ε are the volumetric water content and relative dielectric constant. This dielectric equation was determined empirically for mineral soils containing various soil textures.
The dielectric constant measured by permittivity methods can be used to determine a variety of physical parameters such as volumetric water content, degree of saturation, and bulk density from earth materials in both laboratory and in- situ experiments. In order to confirm these parameters, cal- ibration curves based on relationships between volumetric water content and dielectric constants are needed to esti- mate the dielectric property of soil media.
The equation reported by Topp et al. (1980) shows the relationships between dielectric constant and volumetric water content for the soils. Also, it is used to calculate the volumetric water content of soil using the response of dielec- tric constant under TDR system. In this study, the authors derived the relationships between dielectric constant and volumetric water content for the standard sand and the river sand. Derived equations for the two sands can be applied to the measurement of volumetric water content using the response of the dielectric constant under FDR and FDR-V systems. Table 4 shows the derived equations concerned with porosity for the standard sands and the river sands using the FDR and the FDR-V systems.
Figure 5 shows the measured calibration curves for the standard sands and the river sands in the initial porosity range 0.40 to 0.45. The calibration point of standard sands θ 4.3 10= × –6ε3–5.5 10× –4ε2+2.92 10× –2ε–5.3 10× –2
Table 4. Derived equations for the relationships between volumetric water content and dielectric constant under FDR and FDR-V sys- tems
System Sand θ=Aε3 + Bε2 + Cε + D
R2
A B C D
FDR-V
SS (n=0.40) -6×10⁻⁵ 1.7×10⁻³ 2.6×10⁻² -6.9×10⁻² 0.979
SS (n=0.45) 1×10⁻⁴ -5.8×10⁻³ 9.6×10⁻² -2.1×10⁻¹ 0.980
RS(n=0.40) 2×10⁻⁵ -1×10⁻³ 2.9×10⁻² -5.2×10⁻² 0.998
RS(n=0.45) 9×10⁻⁶ 7×10⁻⁴ 2.8×10⁻² 7.5×10⁻² 0.996
FDR
SS (n=0.40) 3×10⁻⁵ -2.2×10⁻³ 5.6×10⁻² -1.6×10⁻¹ 0.998
SS (n=0.45) 3×10⁻⁶ 8×10⁻⁴ 3.8×10⁻² -1.2×10⁻¹ 0.999
RS(n=0.40) 3×10⁻⁵ -2.1×10⁻³ 5.6×10⁻² -1.8×10⁻¹ 0.997
RS(n=0.45) 3×10⁻⁵ -1.9×10⁻³ 5.2×10⁻² -1.6×10⁻¹ 0.994
SS: standard sand, RS: river sand
in Figure 5 is plotted lower than Topp’s empirical curve (Topp et al., 1980) in the volumetric water content range 0.00 to 0.30 for the measured dielectric constant. However, the volumetric water content larger than 0.40 is represented as higher than the Topp’s empirical curve. In the river sands, the calibration curve shows almost the same relative feature of Topp’s result. All other curves for the standard sands and the river sands are assumed to have almost sim- ilar distributions compared with Topp’s empirical curve until volumetric water content 0.30. The calibration curves based on the responses of the dielectric constant due to pore water have influenced the content of soil particle materials.
Topp’s study using TDR measurement system was only used for soils with clay and slit loam with very fine soil materials.
The porosity of all soils in the saturated conditions has an equal meaning to the volumetric water content (Wilson et al., 1995). Therefore, an exact calibration curve can be used
to calculate volumetric water content, degree of saturation, and other parameters from an acquired relative dielectric constant by the permittivity methods. The natural volumet- ric water content of the in-situ porous media can be con- firmed by comparing each of the calibration curve for the soil types.
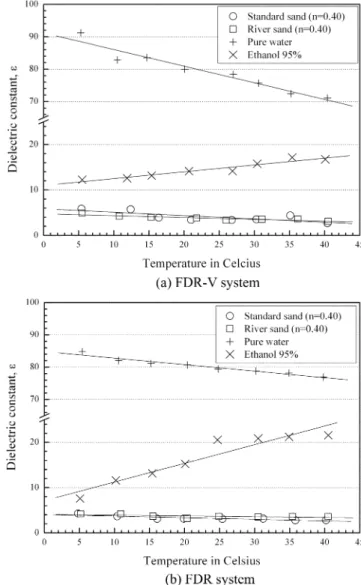
4.2. Dielectric Temperature Dependency
The effect of temperature dependency might account for some differences between the calibration of this study and that of Topp et al. (1980), because the experiments were conducted in the temperature range 5 to 40oC. The relative dielectric constant is known to be very sensitive to the effect of temperature in the laboratory or in the field. There- fore, the authors discussed a temperature dependency for the relative dielectric constant at an estimated constant tem- perature by using a dry oven container. Table 2 and Figure Fig. 5. Calibration curves for the dielectric constant versus volu-
metric water content of sands.
Fig. 6. Temperature effect of dielectric constant of several mate- rials.
6 show the variations of dielectric constant by temperature under FDR and FDR-V systems and the linear formula for calibration dielectric constant due to the effect of temperature.
According to Jacobsen and Schjønning (1993), under cli- matic temperature conditions, in-situ soil temperature is normally lower than room temperature. Table 3 shows a list of relative dielectric constants for selected substances at 20oC, measured in this study, compared with the empirical data in the literature (Curtis and Defandorf, 1929). In the case of water, the relative dielectric constant would vary in the range of 75 to 84 if the temperature is changed from 10 to 36oC (Kim and Jeong, 2005). In this study, the relative dielectric constant of water varied from 72 to 85 in the same temperature range mentioned by Kim and Jeong (2005), showing a similarity of temperature dependency.
4.3. Relationships Between Dielectric Constant and Phys- ical Parameters of Saturated Soils
For the measurement of porosity from the relationship between relative dielectric constant and volumetric water content using the FDR and FDR-V systems, the authors used only the initial value which indicates the range of measured relative dielectric constant of the fully saturated soil. The response of relative dielectric constant always changes with soil physical properties such as soil density, porosity, soil particle size, temperature and volumetric water content. That is why the authors conducted the tests with a predetermined porosity and at a constant temper- ature (20oC).
For the derived DMMs, soil porosity was determined from the response of relative dielectric constant of saturated soil before the injection test. The measured initial relative dielectric constants indicate the correlation of soil particles and water in the pores of soil, and we can compare the pre- determined porosity of 0.35, 0.40 and 0.45 by using the DMMs for the two permittivity systems.
Figure 7 shows that the distribution characteristics between porosity and effective porosity calculated by the response of relative dielectric constant of the saturated soil. The poros- ities measured in the soil column injection tests were plot- ted and shown to be within the range of nearly 95% with the physical porosities for the standard sands and river sands using both the systems. The measured effective porosities were also distributed within the range of 94% for the two fully saturated sands compared on a 1:1 fixed scale.
From these results of porosity profiles, two permittivity sys- tems could measure relatively physical parameters, such as volumetric water content, degree of saturation, porosity, and effective porosity for the saturated soils.
According to the relationship between dielectric constant and relative porosity in Figure 8, the dielectric responses of both systems increase with increasing porosity of saturated soil. This dielectric phenomenon indicates that the relation-
ships between pore distribution in soil and volumetric water content are in close connection with the variations of dielec- tric constant.
4.4. Comparison of Effective Porosity of Soil Column Tests The values of effective porosity are generally as much as 80% to 90% for the natural soil (Stephens, 1995). The effective porosity is an indicator of the pore volume occu- pied by mobile water. This is used to exclude the immobile pore water such as the water in dead-end pores or the water strongly bounded to fine-textured porous media (Reddi, 2003).
Figure 9 shows the relationship between porosity and effective porosity of saturated soils. In the case of the stan- dard sands, the ranges of calculated effective porosity between the injection test and replacement test were similar to the result from the dielectric constant measured with the FDR and FDR-V systems. They are distributed within a range of Fig. 7. Distributions of measured values for porosity and effective porosity of the saturated sands under injection and replacement tests using the FDR system and the FDR-V system.
85% as compared with the estimated range of physical porosity. The effective porosity of the river sands measured with the FDR-V system indicated a similar tendency with the FDR system ranging from 0.40 to 0.45 for the estimated porosity. In the estimated range 0.35 to 0.40 for physical porosity of the saturated soil, however, the measurement result of the FDR system showed a little lower porosity than that of the FDR-V system. These results are reasonable because of the content of fine particle materials such as clay and silt, which have an influence of the relative dielectric constant of soil.
In case of the standard sands using the two systems, the relationship of effective porosities was within a range of almost ±10% to the 1:1 fixed scale. However, the river sands were within a range of almost ±13% compared on a 1:1 fixed scale. As compared with the replacement and tracer tests, the results of injection test were plotted a little
smaller around 0.35 of effective porosity for the fully sat- urated standard sands than other tests under the FDR and the FDR-V systems. However, the effective porosity of the river sands, calculated by the injection test, was distributed within a similar range from 0.25 to 0.40 for other values.
Considering the measurement ranges of the probes for the two permittivity systems, the FDR probe can be measured in a 2 cm-diameter area along with a whole probe length of 15 cm. However, The FDR-V probe is very sensitivite and has a narrow measurement point of almost 0.36 cm wide and 0.1 cm deep at the tip of probe for the saturated sands.
5. CONCULUSIONS
This study obtained an estimation of porosity and effec- tive porosity of the saturated standard sands and the satu- rated river sands in three different soil column tests such as Fig. 8. Relationship between dielectric constant and porosity of the
saturated sands by the FDR system and the FDR-V system. Fig. 9. Relationships between the relative effective porosity and physical porosity of the saturated sands.
injection, replacement and tracer tests by frequency domain reflectometry with vector network analyzer and frequency domain reflectometry systems.
The measurement probes were used at a fixed length of 5 cm for the FDR-V system and 15 cm for the FDR system.
Several conditions were managed to calculate the porosity and the effective porosity using the dielectric mixing mod- els (DMMs). This study was also conducted by estimating saturated conditions using the back pressure method, and determining the physical porosity by the oven dry gravi- metric method. It also identified a range of the corrective dielectric constant for pure materials such as water, sand and ethanol liquid at a constant temperature. During all the experiments, the concentration of ethanol injection material has a tendency to decrease slowly with travel time, which measured about 20% to 30% of the initial tracer concen- tration.
The sensitivity of dielectric constant, measured by the FDR system and the FDR-V system, indicated similar fea- tures, which was determined at about 27 to 38 for the initial relative dielectric constant with each established porosity as 0.35, 0.40 and 0.45, respectively. However, the final dielec- tric constant was different: soil column injection test with the FDR system and the FDR-V system was represented by the range of 9 to 12 by ethanol liquid. The discrepancies of initial and final dielectric constants for the injection tests are considered as the variations of ethanol concentration of the injection materials of ethanol liquid.
From the results of the DMMs study, the mean effective porosity of the standard sands and the river sands were 0.344, 0.347 and 0.333 with 0.402, 0.411 and 0.395 for mean initial porosity, respectively. On the other hand, the ratios of effective porosity to porosity of the standard sands and the river sands were 0.856 and 0.843. From the rela- tionship between the relative porosities and the relative effective porosities, all measured values are distributed over almost 85% for the standard sands and the river sands under all the experiments by permittivity systems. The calculated porosity by DMMs can be easily determined using an initial dielectric constant which measures the dielectric correlation with water and soil particles when a measurement probe was inserted into the saturated soil. Considering these devi- ations, the physical porosity measured by the oven dry gravimetric method can be calculated to be a value similar to them. Furthermore, the measured effective porosities for soil column injection test and replacement test were shown within the limits of approximately 88% compared on a 1:1 fixed scale. These differences were considered to be related to the sensitivity of the measured relative dielectric constant under the saturated soil by two permittivity systems.
The above results were obtained from the relationship that exists between the effective porosity and the relative dielectric constant determined by the permittivity systems.
Consequently, the physical parameters such as porosity,
effective porosity, volumetric water content, and degree of saturation of the saturated soil can be determined easily and quickly from the response of relative dielectric constants obtained from both permittivity systems for the saturated soil. Therefore, these proposed dielectric methods can con- tribute to estimating the porosity and the effective porosity of saturated soil because it is easier and faster than the pre- vious in-situ methods.
ACKNOWLEDGMENTS: This research was supported by a grant from “Development of Technologies for Landslide Prediction and Damage Mitigation” among “Natural Hazards Mitigation Researches”
of NEMA, Korea.
REFERENCES
Alimi-Ichola, I. and Gaidi, L., 2006, Influence of the unsaturated zone of soil layer on the solute migration. Engineering Geology, 85, 2−8.
Campbell, C.G., Ghodrati, M. and Garrido, F., 2002, Using time- domain reflectometry to characterize shallow solute transport in an oak woodland hillslope in northern California, USA. Hydro- logical Processes, 16, 2921−2940.
Campbell, J.D., 1973, Pore pressures and volume changes in unsat- urated soils. Ph.D. thesis, University of Illinois, Urbana, Illinois.
Chenaf, D., and Amara, N., 2001, Time domain reflectometry for the characterization of diesel contaminated soils. TDR 2001: Inno- vative Applications of TDR Technology, Infrastructure Technol- ogy Institute, Northwestern University, Evanston, Illinois, September 5−7, 2001.
Curtis, H.L. and Defandorf, F.M., 1929, Dielectric constant and dielectric strength of elementary substances, pure inorganic com- pounds, and air. Washburn, E.D. (Ed.), International Critical Tables of Numerical Data, Physics, Chemistry and Technology, McGraw-Hill, New York.
Drnevich, V.P., Ashmawy, A.K., Yu, X. and Sallam, A.M., 2005, Time domain reflectometry for water content and density of soils:
study of soil-dependent calibration constants. Canadian Geotech- nical Journal, 42, 1053−1065.
Drnevich, V.P., Siddiqui, S.I., Lovell, J. and Yi, Q., 2001, Water con- tent and density of soil in situ by the Purdue TDR method. TDR 2001: Innovative Applications of TDR Technology, Infrastruc- ture Technology Institute, Northwestern University, Evanston, Illinois, September 5−7, 2001.
Head, K.H., 1980, Manual of soil laboratory testing. Vol. 1: Soil clas- sification and compaction test, London, Pentech Press.
Ii, H., Ohtsuka, Y., Mori, N., Inagaki, T. and Misawa, S., 1996, Effec- tive porosity and specific yield of a sedimentary rock determined by a field tracing test using tritium as a tracer. Environmental Geology, 27, 170−177.
Jacobsen, O.H. and Schjønning, P., 1993, A laboratory calibration of time domain reflectometry for soil water measurement including effects of bulk density and texture. Journal of Hydrology, 151, 147−157.
Jones, S.B. and Or, D., 2001, Frequency-domain methods for extend- ing TDR measurement range in saline soils. TDR 2001: Inno- vative Applications of TDR Technology, Infrastructure Technology Institute, Northwestern University, Evanston, Illinois, September 5−7, 2001.
Kan, W.F., Beck, T.J. and Hughes, J.−J., 2001, Applications of time
domain reflectometry to landslide and slope monitoring. TDR 2001: Innovative Applications of TDR Technology, Infrastruc- ture Technology Institute, Northwestern University, Evanston, Illinois, September 5−7, 2001.
Kim, J.W., Choi, H.C. and Lee J.Y., 2005, Characterization of hydro- geologic properties for a multi-layered alluvial aquifer using hydraulic and tracer tests and electrical resistivity survey. Envi- ronmental Geology, 48, 991−1001.
Kim, J.Y., Edil, T.B. and Park, J.K., 1997, Effective porosity and seepage velocity in column tests on compacted clay. Journal of geotechnical and geoenvironmental engineering, 123(12), 1135− 1142.
Kim, M.I. and Jeong, G.C., 2005, Properties of moisture distribution on bentonite by the responses of complex dielectric constant.
Journal of Engineering Geology, 15(3), 281−288 (in Korean with English abstract).
Li, H., Y. Ohtsuka, N. Mori, T. Inagaki and S. Misawa, 1996, Effec- tive porosity and specific yield of a sedimentary rock determined by a field tracing test using tritium as a tracer. Environmental Geology, 27(3), 170−177.
Noborio, K., 2001, Measurement of soil water content and electrical conductivity by time domain reflectometry: a review. Computers and Electronics in Agriculture, 31, 213−237.
O’Connor, K.M. and Dowding, C.H., 1999, GeoMeasurements by pulsing TDR cables and probes. CRC Press, New York.
Oh, M., Kim, Y. and Park, J., 2007, Factors affecting the complex permittivity spectrum of soil at a low frequency range of 1 kHz- 10 MHz. Environmental Geology, 54, 821-833.
Rassam, D.W. and Williams, D.J., 1997, Application of time domain reflectometry to mine waste rehabilitation. GeoEnvironment 97, Bouazza, Kodikara & Parker (eds), 433−438.
Reddi, L.N., 2003, Seepage in soils: principles and applications. John Wiley & Sons, Inc., Hoboken, New Jersey.
Santamarina, J.C., Klein, K.A. and Fam, M.A., 2001, Soils and
waves. Wiley, New York.
Shackelford, C.D., 1994, Critical concepts for column testing. Jour- nal of Geotechnical Engineering, 120(10), 1804−1828.
Shackelford, C.D. and Redmond, P.L., 1995, Solute breakthrough curves for processed kaolin at low flow rates. Journal of Geo- technical Engineering, 121(1), 17−32.
Singh, S.K., 2002, Estimating dispersion coefficient and porosity from soil-column tests. Environmental Microbiology, 128(11), 1095−1099.
Stephens, D.B., 1995, Vadose zone hydrology. CRC press, Florida.
Tada, H., 1994, Study on the infiltration characteristics of the clay soils. Master thesis, Okayama University, Japan (in Japanese).
Tonder, G.V., Riemann, K. and Dennis, I., 2002, Interpretation of sin- gle-well tracer tests using fractional-flow dimensions. Part 1:
Theory and mathematical models. Hydrogeology Journal, 10(3), 351−356.
Topp, G.C., Davis, J.L. and Annan, A.P., 1980, Electromagnetic determination of soil water content: Measurements in coaxial transmission lines. Water Resource Researches, 16(3), 574−582.
Turesson, A., 2006, Water content and porosity estimated from ground-penetrating radar and resistivity. Journal of Applied Geo- physics, 58, 99−111.
Wilson, L.G., Everett, L.G. and Cullen, S.J., 1995, Handbook of vadose zone characterization & monitoring: Part V- Preliminary monitoring-related activities (Ch. 12). Lewis Publishers, USA, 177−188.
Zheng, Z., Aagaard, P. and Breedveld, G.D., 2002, Sorption and anaerobic biodegradation of soluble aromatic compounds during groundwater transport. 1. Laboratory column experiments. Envi- ronmental Geology, 41, 922−932.
Manuscript received October 22, 2007 Manuscript accepted March 26, 2008