Vol. 12, No. 3, p. 277−284, September 2008 DOI 10.1007/s12303-008-0028-3
ⓒ The Association of Korean Geoscience Societies and Springer 2008
Analysis of ground subsidence in coal mining area using SAR interferometry
ABSTRACT: This study presents the application of interferometric synthetic aperture radar (InSAR), small baseline subset (SBAS) algorithm and GIS for subsidence analysis in a mining area located at Gangwon-do, Korea. Several mining areas at the Sam- chuk coalfield had operating coalmines until 2002–2003. Ground deformation has occurred as a form of subsidence due to the con- tinuous mining activity or the collapse of residual cavities. Twenty- three scenes from a JERS-1 satellite acquired from 1992 to 1998 are used to detect the ground movement by means of the differ- ential InSAR process. Distinctive phase variations induced by sub- sidence were observed in several interferograms. The SBAS algorithm was applied for a detailed analysis. As a result, it was confirmed that deformation was occurring between September 21, 1992 and September 30, 1998 and attained 22 cm at the most sig- nificantly subsiding site. The mean and standard deviation of RMS error were 2.0 cm and 0.78 cm, respectively, showing the level of the error due to the used digital elevation model, unwrap- ping and atmospheric effect. The SBAS-derived cumulative sub- sidence map was validated with the underground workings and geological maps in order to find the spatial relations and subsiding mechanism. From the spatial comparison with these data, it was shown that the subsidence has taken place above excavations and fault lines.
Keywords: interferometric SAR, ground subsidence, coal mining area, SBAS
1. INTRODUCTION
Differential interferometric synthetic aperture radar (DIn- SAR) using the phase difference of two correlated syn- thetic aperture radar (SAR) images has the ability to detect surface displacements to within a few millimeters accuracy over several kilometers (Massonnet and Feigl, 1998). Recently, these methods have been used in various fields to measure ground displacement and to retrieve three-dimensional sur- face information effectively (Amelung et al., 2007).
The emergence of the InSAR technique has enabled us to observe the Earth regardless of weather or time condi- tions (day/night). It has been applied successfully to esti-
mate subtle surface deformation caused by earthquake, volcanic activity and urban subsidence (Burgmann et al., 2000; Massonnet and Feigl, 1998). The technique has also become an important remote sensing tool over the last decade in the estimation of temporal and spatial surface motions due to subsidence, particularly in mining subsid- ence cases (Herrera et al., 2007; Jung et al., 2007). In this context, new approach such as SBAS (Small BAseline Subset) algorithms that contribute to the detection of defor- mation in coal mining are applied for more accurate anal- ysis.
The Samchuk coalfield located at Kangwon-do in Korea was in operation since the 1930s and was recently aban- doned under a coal industry policy (Coal Industry Promo- tion Board, 2004a). Mining activity may lead to surface deformation, changes in the local ecosystem, and have impact on manmade structures (Chang et al., 2005). In coal min- ing area, surface displacement can take place above coal- bearing layer or underground workings because of the coal extraction procedure. The consequence, commonly related to underground coal mining, is known as a sag subsidence, which in theory shows a gentle, gradual settling of the overlying ground surface (Perski and Jura, 2003).
Such subsidence may be accurately quantified using land survey measurements in selected areas, but it is labor- intensive work and cannot produce an instant map because the survey takes several days. Use of a Global Navigation Satellite System (GNSS) is another way to detect elevation change using satellites and receivers. This would however, require many monitoring stations along with a surveyed base line to produce a meaningful map of surface change (Stancliffe and Kooji, 2001). InSAR offers many advan- tages in measuring surface deformation. When compared with the traditional methods, it can produce an observed deformation map over a wide and continuous area.
This research used JERS-1 (Japanese Earth Resources Satellite-1) L-band descending SAR images acquired from 1992 to 1998 to investigate the mining-induced ground Jin Baek
Sang-Wan Kim*
Hyuck-Jin Park Hyung-Sup Jung Ki-Dong Kim Jeong Woo Kim
}
Department of Geoinformation Engineering, Sejong University, Seoul 143-747, Korea Department of Geomatics Engineering, University of Calgary, Calgary, AB, Canada Department of Geoinformation Engineering, Sejong University, Seoul 143-747, Korea Department of Earth System Sciences, Yonsei University, Seoul 120-749, Korea Department of Geoinformation Engineering, Sejong University, Seoul 143-747, Korea Department of Geomatics Engineering, University of Calgary, Calgary, AB, Canada
*Corresponding author: [email protected]
subsidence at the Samchuk coalmine area. Although JERS- 1 was not originally designed for the application of InSAR in terms of its orbit accuracy, it has provided interfero- grams caused by deformation. In addition, L-band inter- ferometry is capable of penetrating the vegetation canopy, and thus we could achieve high coherence interferograms over vegetated areas (Strozzi et al., 2005; Kim et al., 2001).
With the interferograms generated for this study, the SBAS algorithm was applied for a time series analysis of the observed subsidence. The SBAS algorithm is an appro- priate method for monitoring the temporal evolution of surface deformation. It uses a combination of differential interferograms defined as a small baseline subset in order to decrease baseline decorrelation (Berardino et al., 2002;
Lanari et al., 2004). Moreover, the accumulated subsidence map based on the SBAS result may be validated with other spatial information such as a geological formation map and underground pit map.
2. DESCRIPTION OF STUDY AREA
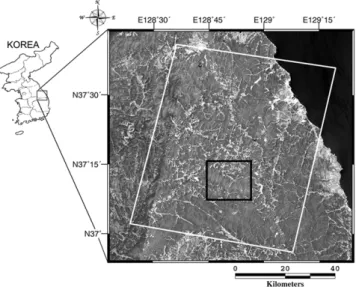
The study area is located in the eastern part of South Korea defined by 37°06'N–37°10'N and 128°41'E–128°57'E and covered with dense vegetation (Fig. 1). The height above mean sea level is about 950 m on average, and small scale N–S fault zones occur. This area covers the Samchuk coalfield from where 13% of the past coal production in South Korea was formerly mined.
The coal resource of South Korea consists almost entirely of anthracite, 85% of which was deposited during the Upper Paleozoic and the Lower Mesozoic in the Jang- seong Formation of the Pyeongan Supergroup (Geological Society of Korea, 1999). The Samchuk coalfield, comprised
in the Paleozoic coal measures, is elongated from east to west and divisible into the eastern and western parts in point of geologic structure. The two parts are bounded by the Hambaegsan fault which runs north to south on the east side of the Mt. Hambaegsan (Cheong, 1969). This coalfield formation contains sediments of Carboniferous to Triassic age, surrounded by older sediments of Ordovician and Cambrian ages. Into all of these sediments have been intruded felsic igneous materials of Late Jurassic to Cre- taceous age (Thomas, 1977). Currently, most of the coalm- ines have been virtually closed since 2002, following Korean coal industry policy.
Sudden surface collapse or small-scale subsidence of an order of several meters has often been reported in news- papers and official reports for the study area. The reasons for this surface displacement are mostly due to underground mining activities, outflow of groundwater from abandoned mines, or rock weathering and solution of limestone that occurs in the underlying strata of the study area. Notably, to prevent serious accidents, the government carried out an investigation in 336 abandoned coalmine areas between 1989 and 2003 (Coal Industry Promotion Board, 2004b), and several mines were reinforced as a result. More effec- tive method is required in order to perform monitoring of subsidence over broad areas that can be affected by the mining activities.
3. METHODOLOGY AND DATA PROCESSING InSAR can be applied to the measurement of surface dis- placement by phase difference of the SAR signals with two or more complex SAR images acquired from the similar orbital positions. Differences in the line-of-sight (LOS) path length from the radar antenna to the surface (i.e., the slant range) can be measured with centimeter scale accu- racy (Rosen et al., 2000; Hanssen, 2001). In this study, the DInSAR technique was used to obtain surface displace- ments.
The complex signals in the SAR images are used for the generation of the interferograms by creating a pixel-wise complex conjugate multiple of each signal at the same coordinates. In the differential interferograms, the phase (Φ) results from the following components;
(1) where ΦDEMerror is the phase due to an error component of the Digital Elevation Model (DEM) used for removing the topo- graphic phase. Φdis is the phase contribution of ground dis- placement occurring between the two SAR images acquisition dates. Φatm is related to the atmospheric state change, and Φn
represents the phase resulting from the residual noise effect such as a speckle and system noise.
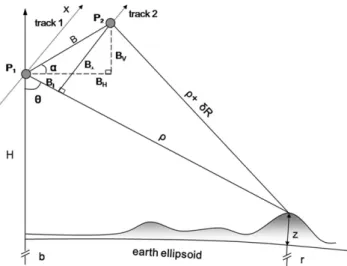
Figure 2 shows the geometry of InSAR. The backscat- Φ Φ= DEMerror+Φdis+Φatm+Φn
Fig. 1. Location map of the study area, seen by Landsat ETM image acquired on July 7, 2001. The white and red squares in Landsat image outline the ground swath of JERS-1 (83/238) and the study area corresponding to Figure 4, respectively.
tered signals measured from the antenna positions P1 and P2 are related to the variation of the ground displacement in the LOS direction if ground deformation occurred within the SAR image acquisition period;
(2) where Φdis, λ and δR are the ground surface deformation component of the phase difference, the wavelength of SAR signal and the ground displacement in LOS direction, respectively.
Since the phases measured in the interferogram are wrapped in modulo of 2π, the ground displacement can be retrieved by phase unwrapping of the interferogram (Gold- stein et al., 1988). Consequently, it is possible to calculate the deformation extent from the differential interferograms.
The phase information used in interferometry gives a mil- limeter-centimeter level of vertical precision (Burgmann et al., 2000; Massonnet and Feigl, 1998). The ground displace- ment causing a phase change of 2π (i.e., one fringe) in an interferogram corresponds to λ/2 for LOS direction, which is about 11.8 cm for the JERS-1 radar interferometry.
The SAR sensor onboard JERS-1 operated in L-band frequency, Horizontal-Horizontal polarization, with an off- nadir side-looking angle of 35o, a ground surface resolution of 18 m in both range and azimuth directions, and a swath width of 75 km. (Carn, 1999). Table 1 shows the more detailed informations about JERS-1. After focusing the raw SAR image using Gamma software (Wegmuller and Werner, 1997), the 23 single look complex (SLC) images acquired between September 21, 1992 and September 30, 1998 were com- bined into the interferometric pairs as described in Figure 3, considering the baseline and time interval of each pair.
The number of all generated interferograms is 41.
In general, we can expect more accurate results when we analyze interferograms as many as possible, because mul-
tiple interferograms are preferred for cross-validation. In this way, the misinterpretation of topography, atmosphere, and noise as displacement could be mitigated (Storizzi et al., 2005). The topographic phase due to terrain elevation was removed using the SRTM-3 (Shuttle Radar Topogra- phy Mission-3) DEM (Farr and Kobrick, 2000) and resid- ual striped phase according to the baseline error of SAR data as corrected.
For detailed observation, a subarea of about 22 km × 20 km that indicates the mining district of the Samchuk coalfield was selected from the full-scene image. Among the gen- erated interferograms, several that provide a good repre- sentation of the phase anomalies resulting from surface displacement with high coherence were selected for the SBAS analysis. The accumulated subsidence estimation and time series analysis of observed subsidence were mea- sured by means of the SBAS algorithm using the selected and cropped interferograms. Finally, for validation of the Φdis
4π ---λδR –
=
Fig. 2. Geometry of interferometric synthetic aperture radar (InSAR).
Fig. 3. Relative perpendicular baseline of JERS-1 SAR data set and SBAS subset pair. Dashed line and solid line indicate inter- ferometric pair used for SBAS analysis.
Table 1. Acquisition date of JERS-1 L-band SAR data (descend- ing, path:83/row:238) used in this study
No. Acquisition Date No. Acquisition Date
1 1992/09/21 13 1997/01/22
2 1992/11/04 14 1997/08/30
3 1992/12/18 15 1997/10/13
4 1993/01/31 16 1997/11/26
5 1993/03/16 17 1998/01/09
6 1993/04/29 18 1998/02/22
7 1993/06/12 19 1998/04/07
8 1993/09/08 20 1998/05/21
9 1993/10/22 21 1998/07/04
10 1993/12/05 22 1998/08/17
11 1996/07/30 23 1998/09/30
12 1996/10/26
spatial relations, the accumulated subsidence map, under- ground mining pit map, and geological map of the study area were superimposed.
4. RESULTS
4.1. Differential Interferogram Analysis
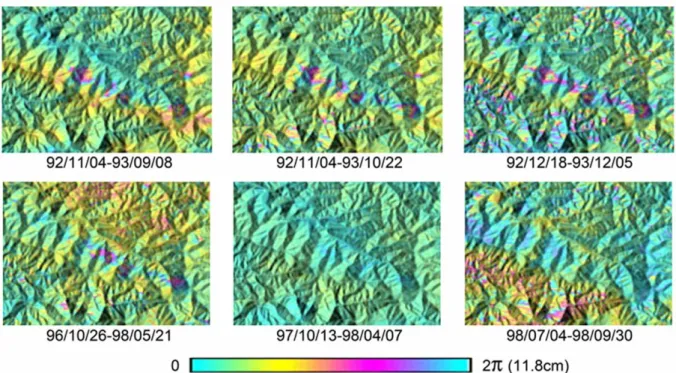
After removing the topographic phase caused by the ter- rain elevation, several differential interferograms with suf- ficient coherence (>~0.2) showed the apparent phase variation that resulted from surface displacement within the mining area along the mountain slope face. It is clear that the interferometric phase with a long temporal term is considerably noisier than with a shorter term, as we could not identify the phase components due to the surface motion, because considerably long temporal term between two SAR data causes low correlation in general. Therefore, interferograms with a small perpendicular baseline or a short acquisition time interval were used to analyze the ground subsidence (Fig. 4).
Figure 4 shows some example of the generated interfer- ogram, showing relatively little noise. From November 1992 to December 1993, it is evident that subsidence observed as distinctive fringe features occurred within a configura- tion of four deformation zones. The location and extent of monitored subsidence that occurred between acquisition times of the master and slave radar images is also shown.
Notably, the interferogram from December 1992 and December 1993 presents the maximum 1-fringe corre- sponding to about 11.75 cm as the extent of LOS displace-
ment. On the other hand, most interferograms from the SAR images acquired after 1997 show no significant fringe patterns (see Fig. 4). The interferogram from October 1996 and May 1998 SAR images is the last one showing a clear deformation pattern. It is accordingly confirmed from these interferograms that ground subsidence respectively took place between 1992 and 1993 and from 1996 to 1997.
4.2. SBAS Analysis
Unfortunately, due to the limitations imposed by the temporal baseline and a lack of data acquisition between 1994 and June 1996, we were not able to make good inter- ferograms using SAR images for this period. Moreover, undesired components in each interferogram such as DEM error, atmospheric effects, phase unwrapping errors, and noise, made the interpretation of the interferometric phase more difficult. For these reasons, it was not possible to com- plete an accurate analysis of subsidence over the whole time span considered. We therefore carried out a continu- ous time series analysis by using the SBAS algorithm, which can help to minimize undesired phase components from differential interferograms.
The permanent scatterer InSAR (PSInSAR) technique is also used to make time series analyses based on pixels with high coherence called permanent scatterer (PS) (Ferretti et al., 2001). Although we tried to find PS candidates from the amplitude dispersion index as well as the coherence (Jung et al., 2007), only a few PS candidates were found, so that we could not apply the PSInSAR technique. How- ever, the SBAS method is preferable to the PSInSAR tech-
Fig. 4. Representative interferograms derived from JERS-1 SAR images over the study area. Each interferogram is overlaid on DEM.
nique in this case, because our study area is almost completely covered with dense vegetation.
SBAS algorithm was developed in 2002 to monitor the temporal evolution of surface deformations using Small Baseline (SB) subset which was defined by a pair of data with a small orbital separation (i.e., baseline) in order to reduce spatial decorrelation. For example, Usai (2001) defined a ‘small baseline’ of an ERS image as not exceed- ing about 150 m in length of perpendicular baseline. In the case of JERS-1, since the theoretical baseline to generate a meaningful interferogram is known as about 6 km, inter- ferograms with perpendicular baselines of 1 km or less were considered as SB subsets in this study.
The SB subset can be combined for more precise inter- pretation of generated interferograms. The combination is based on a minimum-norm criterion of the velocity defor- mation by means of a Singular Value Composition (SVD) method. The purposes of the SBAS algorithm are to increase the temporal sampling rate by using all the data included in the different SB subsets and to preserve the capabilities of the system to provide spatially dense deformation maps (Berardino et al., 2002). Further, the SBAS algorithm approach enabled us not only to measure the quantitative
final subsidence, but also to analyze 2-D characteristics of the detected subsidence using a small baseline-defined interferogram group after eliminating the unwanted noise components. The SBAS algorithm proved, therefore, to be the most appropriate approach for our study in this sense and 25 interferograms are used for application of the SBAS algorithm.
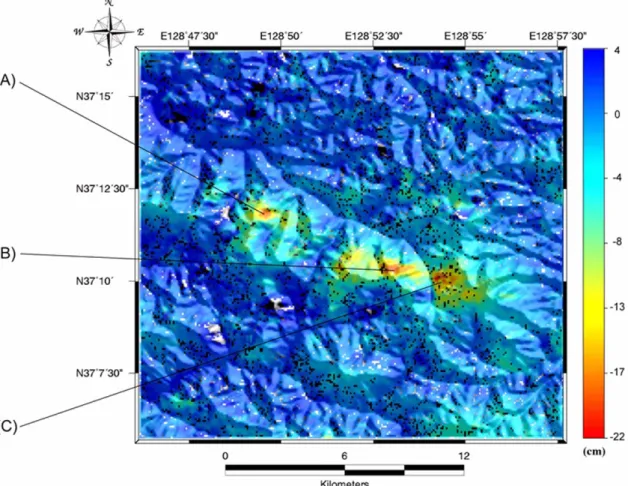
The general time evolution of the subsidence and cumu- lative subsidence map over six years were studied by means of the results of the SBAS application. In order to provide an overall image of detected subsidence, we present the deformation map showing the cumulative displacement measurements on the SRTM DEM for each pixel having coherence value greater than 0.12 (Fig. 5). The maximum displacement was approximately 22 cm for six years in a LOS direction. Assuming that deformation was dominantly vertical, it attained about 27 cm (=22 cm/cos(38.5°), where 38.5° is the incidence angle of JERS-1) of a vertical dis- placement. The time series plot (Fig. 6) shows the general trend in gradual ground displacement, but the partial dis- placement pattern is a little different according to the loca- tion of a selected pixel. For example, the temporal subsidence pattern at A shows that the subsidence was in
Fig. 5. Ground displacement in a LOS direction for 6 years overlaid on DEM after removing the pixel with the correlation value greater than 0.12 overlaid on DEM.
progress during 1992, whereas the subsidence at B and C principally occurred from 1993, as shown in Figure 6. In addition, a large hiatus in data acquisition from June 1994 to June 1996 obscures the analysis of subsidence trend through this period, even when applying the SBAS algo- rithm. At site C, the insignificant subsidence from 1994 to 1997 obviously differs from the previous subsidence rate, consequently showing a phased pattern. This discontinuous rate may reflect either a true history of ground deformation or a processing error due mainly to the phase unwrapping of a long time scale pair with low coherence. Ground truth measurements can be used to confirm the facts, but these were not available in our area of interest.
The removed phase value that is filtered out during the SBAS process represents the phase of DEM error, atmo- spheric effect, unwrapping error, and noise. The root-mean- square (RMS) error of phase difference between the opti- mum measurements estimated from SBAS and 25 DIn- SAR interferograms were calculated and the mean and the standard deviation of RMS error are 2.0 cm and 0.78 cm, respectively. These statistics may provide the accuracy of the information that can be achieved from an independent analysis of each interferogram.
4.3. Comparison with Geological and Mine Maps
To validate the spatial relation between the SBAS- derived subsidence value and other geological information, a GIS analysis was carried out using ArcGIS software (Ormsby et al., 2004). Two layers, the geological and underground mine maps, were used to distinguish the ori- gins of the subsidence. We attempted to overlay the two layers on an accumulated subsidence extent image (Fig. 7).
When the geological map is superimposed (Fig. 7(a)), subsidence is mainly apparent over the coal seams, a stra- tum of coal thick enough to be mined with profit, shown as the second and the third geological horizons, which are steeply dipping (close to vertical), and called Hambaegsan and Jangseong formations, respectively. These geological layers were the object of the mining activity, so excava- tions were distributed along the coal seams. The observed subsidence occurred within the mined coal seams, and this fact was clarified by overlying the underground pit map as well (Fig. 7(b)). Note that the spatial distribution of under- ground mine is well in accordance with the coal seams in the geological map because of the steep dip of the seams.
In addition, some subsidence has occurred around the small-scale fault zones. As a result, it can be concluded that subsidence was caused by collapse of mined galleries for exploiting coal, and by the fault zones.
5. DISCUSSIONS AND CONCLUSIONS
The differential interferometric synthetic aperture radar (DInSAR) process was applied for subsidence detection over a period of six years in a closed coal mining area in Samchuck, Korea. The series of interferograms derived from JERS-1 (Japanese Earth Resources Satellite-1) L- band SAR images demonstrates that progressive subsid- ence occurred in the zone and shows the spatial extent of the subsiding area. Since the interferograms alone could not allow a time series analysis of the observed subsid- ence, the small baseline subset (SBAS) algorithm was used not only for a time series analysis but also for the removal of the unexpected components in the interfero- grams such as the atmospheric effect phase, unwrapping error, and other noise. From the SBAS application, it was Fig. 6. Time series plots of deformation at the points A, B, and C.
The locations of the points are shown in Figure 5.
confirmed that deformation between September 1992 and September 1998 reached 22 cm in the mining area. Over- all, most of the subsidence took place from 1993 to 1997, and the ground seems to have stabilized since 1998 (or the middle of 1998 in the case of Fig. 6(c)). By overlap- ping the accumulative subsidence map produced by SBAS and the underground workings map, strong spatial correlation was found.
Overlaying accumulated subsidence map with the geo- logical and underground mine map shows good spatial agreement. The subsidence accumulation map shows that all the subsiding areas are located above the underground workings. The cumulative subsidence map superimposed on the geological map also indicates a high spatial corre- lation. Most of the subsidence area lies above the coal seams developed as workings for coal, and above small- scale fault zones. The spatial comparison for each seam tells us that the ground subsidence monitored by the inter- ferograms was induced by mining as the coal was removed, and by geological faulting.
This result suggests further detailed investigation. A DInSAR analysis using available radar images obtained by recent missions like Japanese ALOS (Advanced Land Observ- ing Satellite) PALSAR should be processed to detect any motion in the study area after 1998. Although the present study shows that subsidence had generally been stabilized by 1998, this is a preliminary conclusion, because JERS-1 radar images were not provided after 1998. Important future work would therefore be to verify whether or not the subsidence was continuous after this date. In addition, more detailed GIS analysis, and other data layers such as in-situ observations or more circumstantial pit data, could be used for modeling.
ACKNOWLEDGMENTS: This study was supported by National Research Lab project (M1-0302-00-0063) of the Ministry of Science and Technology of Korea.
REFERENCES
Amelung, F., Yun, S.H., Walter, T.R., Segall, P. and Kim, S.W., 2007, Stress control of deep rift intrusion at Mauna Loa volcano, Hawaill. Science, 316, 1026−1030 p.
Berardino, P., Lanari, R. and Sansosti, E., 2002, A new algorithm for surface deformation monitoring based on small baseline differ- ential SAR interferograms. IEEE Transactions on Geoscience and Remote Sensing, 40, 2375−2383 p.
Burgmann, R., Rosen, P.A. and Fielding, E.J, 2000, Synthetic aper- ture radar interferometry to measure earth’s surface topography and its deformation. Annual Review of Earth & Planetary Sci., 28, 169−209 p.
Carn, S.A., 1999, Application of synthetic aperture radar (SAR) imagery to volcano mapping in the humid tropics: a case study in East Java, Indonesia. Earth and Environmental Science, 61, 92−105 p.
Chang, H.C., Ge, L. and Rizos, C., 2005, DInSAR for mine subsid- ence monitoring using multi-source satellite SAR images. IGARSS 2005, Seoul, Korea, 25−29 p.
Cheong, C.H., 1969, Stratigraphy and paleontology of the Samcheog Coalfield, Gangweondo, Korea (1). Journal of the Geological Society of Korea, 5, 13–56 p.
Coal Industry Promotion Board, 2004a, Fundamental investigation report of the stability test for Jeongam. Coal Industry Promotion Board, Seoul, Korea, 99-01, 11−18 p.
Coal Industry Promotion Board, 2004b, Report on the establishment of AMGIS (Abandoned Mine Geographic Information System).
Coal Industry Promotion Board, Seoul, Korea, 04-04, 1−15 p.
Farr, T.G. and Kobrick, M., 2000, Shuttle Radar Topography Mission produces a wealth of data, Amer. Geophys. Union Eos, 81, 583− 585 p.
Ferretti, A. Prati, C., and Rocca, C., 2001, Permanent scatterers in Fig. 7. The superimposed accumulated ground subsidence map overlaid with the geological (a) and the underground pit (b) maps. The color bar below indicates subsidence extent in centimeters.
SAR interferometry.
IEEE Transactions on Geoscience and Remote Sensing, 39, 8–20 p.
Geological Society of Korea, 1999, Geology of Korea, Sigma Press, 550−556 p.
Goldstein, R.M., Zebker, H.A. and Werner C.L., 1988, Satellite radar interferometry: two-dimensional phase unwrapping. Radio Sci- ence, 23(4), 713−720 p.
Hassen, R.F., 2001, Radar Interferometry, Kluwer Academic Pub- lishers, Dordrecht.
Herrera, G., Toms, R., Lopez-Sanchez, J.M., Delgado, J., Mallorqui, J.J., Duque, S. and Mulas, J., 2007, Advanced DInSAR analysis on mining area : La Union case study (Murcia, SE Sapin). Engi- neering Geology, 90, 148−159 p.
Hoffmann, J., 2003, The Application of Satellite Radar Interferom- etry to the Study of Land Subsidence over Developed Aquifer Systems. Ph.D. thesis, Department of Geophysics, Stanford Uni- versity, California, 1–211 p.
Jung, H.C., Kim, S.W., Jung, H.S., Min, K.D. and Won, J.S., 2007, Satellite observation of coal mining subsidence by persistent scatterer analysis. Engineering Geology, 92, 1−13 p.
Kim S.W., Won, J.S., Kim, J.W., Moon, W.M. and Min, K.D., 2001, Multi temporal JERS-1 SAR investigation of Mt. Baekdu stra- tovolcano using differential interferometry. Geosciences Journal, 5(4), 301−312 p.
Lanari, R., Mora, O., Manunta, M., Mallorquí, J.J., Berardino, P. and Sansosti, E., 2004, A small-baseline approach for investigating deformations on full-resolution differential SAR interferograms.
IEEE Tracsactions on Geoscience and Remote Sensing, 42, 1377−1386 p.
Massonnet, D. and Feigl, K.L., 1998, Radar interferometry and its application to changes in the earth's surface. Reviews Of Geo-
physics, 36, 441−500 p.
Ormsby, T., Napoleon, E., Burke, R., Groessl, C. and Feaster, L., 2004, Getting To Know ArcGIS, ESRI Press, California.
Perski, Z. and Jura, D., 2003, Identification and measurement of min- ing subsidence with SAR interferometry: potentials and limita- tions. Proceedings of the 11th FIG Symposium on Deformation Measurements, Santorini, Greece.
Rosen, P.A., Hensley, S., Joughin, I.R., Li, F.K., Rodriquez, E. and Goldstein, R.M, 2000, Synthetic aperture radar interferometry.
Proc. IEEE, 88, 333−385 p.
Stancliffe, R.P.W. and Kooji, M.W.A., 2001, The use of satellite- based radar interferometry to monitor production activity at the Cold Lake heavy oil filed, Alberta, Canada. AAPG Bulletin, 85, 781−793 p.
Strozzi, T., Farina, P., Corsini, A., Ambrosi, C., Thüring, M., Zilger, J., Wiesmann, A., Wegmüller, U. and Werner, C., 2005, Survey and monitoring of landslide displacements by means of L-band satellite SAR interferometry. Landslides, 2, 193−201 p.
Thomas, L.P., 1977, The Geology and Shaft Sinking at Jangseong Anthracite Mine, Gangweon-Do, Republic of Korea, Jour. Kor.
Inst. Mining Geol., 10(2), 93−96 p.
Usai. S, 2001, A New Approach for Long Term Monitoring of Deformations by Differential SAR Interferometry. Ph.D. thesis, Delft University, Delft.
Wegmuller, U. and Werner, C., 1997, Gamma SAR processor and interferometry software. Third ERS Scientific Symposium, Flo- rence, Italy.
Manuscript received June 11, 2008 Manuscript accepted August 9, 2008