GENERATION OF HIGH-PRECISE DEM FROM ERS-2/ENVISAT CROSS-INTERFEROMETRIC SAR PAIR
Won-Jin Lee1, Hyung-Sup Jung2, Zhong Lu3 and Lei Zhang4
1Dept. of Geoinformatics, University of Seoul, [email protected],
2Dept. of Geoinformatics, University of Seoul, [email protected],
3U.S. Geological Survey (USGS), Cascades Volcano Observatory, [email protected]
4Dept. of Land Surveying and Geo-Informatics, Hong Kong Polytechnic University, [email protected] ABSTRACT: Interferometric synthetic aperture radar (InSAR) technique has been used to produce a digital elevation model (DEM). However, this technique largely depends on the baseline length, temporal decorrelations and height sensitivity of the InSAR image. The shorter baseline leads to higher InSAR coherence but decreases the height sensitivity, while longer baseline increases the height sensitivity but leads to lower coherence. This baseline requirement makes it difficult to produce a precise DEM based on an InSAR image. Cross-interferometric SAR (CInSAR) method dramatically overcomes the baseline constraint and enables the production of a precise DEM by using tandem ERS-2 and Envisat SAR images whose baseline of about 2 km compensates the slight difference of radar carrier frequencies. The repeat-time of ERS-2 and Evnisat CInSAR image is about 28min, which enhances the temporal coherence. However, it is often difficult to produce a high-quality CInSAR-derived DEM due to the difference in the azimuth and range pixel size between ERS-2 and Envisat images as well as the small height sensitivity of CInSAR interferogram. In this paper, we proposed an efficient CInSAR processing method to generate a high precision DEMWe validated the height accuracy of the CInSAR-derived DEM by comparing it with an airborne InSAR-derived DEM having a spatial resolution of 5 m and height error of 10 cm. The mean and the standard deviation of the height difference between CInSAR-derived DEM and the airborne InSAR-derived DEM over northern Alaska were about 0.07 m and 0.60 m, respectively. This result means that the proposed method is capable of generating a high precision DEM of submeter accuracy.
KEY WORDS: Cross-Interferometry, DEM generation, SAR
1. INTRODUCTION
Synthetic aperture radar interferometric (InSAR) technique has been used to generate a digital elevation model (DEM), observing natural hazard, topographic change detection, etc (Gens et al., 1996).
The InSAR method can generate the precise DEM using the phase difference of SAR interferometric pair, because it relates with the topographic height, and then many researchers have studied on the generation of the precise DEM by this method since the late 1980s (Zebker et al., 1995). And this method has been also used for constructing the global DEM, which is SRTM (Shuttle Radar Topography Mission) DEM. It has the spatial resolution of 90 m and the vertical accuracy of about 16 m (Rabus et al., 2003).
The quality of DEM generated by this method depends largely on 1) temporal decorrelation, 2) baseline decorrelation and 3) atmospheric artifact. The temporal decorrelation is occurred by acquisition time interval of interferometric SAR pair. A long time interval of repeat- pass acquisitions causes loss of coherence, especially for the snow, forest, sands, etc. To derive a high quality DEM, a short time interval is required. The baseline decorrelation depends on the length of the perpendicular baseline (Lee and Liu, 1999). This may dominate any other decorrelation factors in a relief terrain. For good coherence, the short perpendicular baseline is required, but the vertical accuracy is poor due to large height of ambiguity. This trading-off makes the generation of a
precise DEM very difficult. For the generation of good quality DEM, both of large baseline and the good coherence are required, but it is impossible to satisfy both of them together in the case of conventional InSAR method. And, the atmospheric artifact is caused by the difference of an atmospheric delay between two SAR acquisitions. This artifact should be removed because it leads to a serious DEM error. In general, this effect is ignored by using an InSAR pair acquired from the close time interval.
Recently, cross-interferometric synthetic aperture radar (CInSAR) technique using ERS-2 and Envisat images has been developed. This technique is capable of generating submeter-accuracy DEM because it overcomes the trading-off between the perpendicular baseline and height of ambiguity by using the difference of radar carrier frequencies. This ERS-2/Envisat cross-interferometry has the advantages 1) that the removal of the atmospheric artifact is not necessary to be considered because the InSAR pair of the short repeat-time of about 28 minutes is used and 2) that the small ambiguity of height is achieved with high coherence because the long baseline of more than 2 km and radar carrier frequency difference of about 31MHz are used.
Many researchers have investigated on the feasibility of the high-precise DEM generation using the CInSAR method (Hong and Won., 2005, Wegmuller et al., 2009), but the optimal procedure for the generation of CInSAR- derived DEM and the vertical accuracy has been not reported, because it is very difficult to co-register the
CInSAR pair because of spatial decorrelation large baseline and to unwrap the CInSAR interferogram the small height ambiguity of CInSAR interferogram.
In this paper, we propose an efficient cross- interferometric method to generate a high precise DEM, and assess the height accuracy of the CInSAR-derived DEM by comparing it with an airborne InSAR-derived DEM having a spatial resolution of 5 m and vertical error of 10 cm.
2. CROSS-INTERFEROMETRY
Generally, a SAR system observes the Earth surface under specific radar carrier frequency and incidence angle.
If the incidence angle or radar carrier frequency are changed, the range reflectivity spectrum will be changed.
The changes of the range reflectivity spectrum (Δf) can be defined as (Gatelli et al., 1994):
) tan(
θ α
λ
−−
=
Δ ⊥
R
f cB , (1)
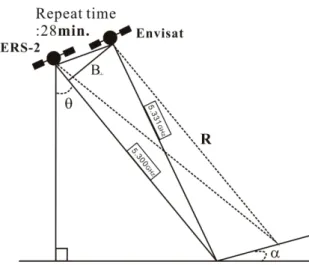
where c is velocity of light, is the perpendicular baseline, is the radar wave length, R is the slant range distance, is the incidence angle, is the terrain slope angle. The parameters are represented in Figure 1.
Figure 1. Geometry of ERS-2 and Envisat cross- interferometry
If the interferometric SAR pair has the same carrier frequency, the change of the range reflectivity spectrum needs to be small so that the reflectivity spectra of the two signals are overlapped. Otherwise, the change of the reflectivity spectrum defined by (1) can be considered, because there is a condition under which the effect of the incidence angle can be exactly compensated by the difference of radar carrier frequencies between two SAR acquisitions. From (1), for a given frequency difference, the perpendicular baseline component ( ) compensated by the incidence angle effect can be defined as (Colesanti et al, 2003) :
( )
1 1
2 tan( )
f R f
Bcomp⊥ ≈− f −
θ
−α
(2)where f1 and f2 are radar carrier frequencies of two SAR acquisitions.
The 31MHz carrier frequency difference between ERS-2 and Envisat SAR images can be compensated by the perpendicular baselines of approximately 2 km over a flat surface. Consequently, the cross-interferometry of ERS-2 and Envisat pair enables to preserve the high coherence in spite of long baseline of about 2 km.
The ambiguity height of the cross-interferometry can be defined from (2) as given by (Guarnieri et al., 2000):
) cos(
2 5 )
cos(
θ α θ α
α ≈ −
Δ
−
= ×
f h c
(3) In case of the cross-interferometry of ERS-2 and Envisat, the height ambiguity is about 4.6m in flat area.
This small height ambiguity enables to generate high precise DEM over flat area. Moreover, the short repeat- time interval of about 28 minutes can avoid the atmosphere artifact.
3. DATA PROCESSING
The azimuth and range pixel size of ERS-2 SAR image are different from those of Envisat SAR image because their pulse repetition frequency (PRF) and sampling frequency are different. And ERS-2 and Envisat SAR imaging geometries are largely different due to large perpendicular baseline. These differences make the co- registration of ERS-2 and Envisat SAR images difficult.
And the small height ambiguity of CinSAR interferogram also leads to the serious phase unwrapping error.
To solve the problems, an efficient CInSAR processing is proposed, and the detailed processing flow of the proposed method is summarized in Figure 2. This procedure includes:
1) generation of ERS-1 and Envisat SLC images using the azimuth common band filtering and oversampling;
2) co-registration of ERS-1 and Envisat SLC images using the DEM-assisted method;
3) cross-interferogram generation by the range common band filtering;
4) differential cross-interferogram generation using the simulated interferogram acquired from low quality DEM (e.g. SRTM DEM);
5) generation of the unwrapped differential cross- interferogram ;
6) summation of the unwrapped differential cross- interferogram and the simulated interferogram;
7) conversion of unwrapped interferometric phases into topographic heights
To minimize the mis-registration of ERS-2 and Envisat SAR image, the azimuth common band filtering is applied to RAW data processing step, and DEM-assisted co-registration is used. And data oversampling and differential interferometric SAR methods are adopted to reduce the unwrapping error.
Figure 2. Block diagram of the proposed CInSAR processing
4. RESULT
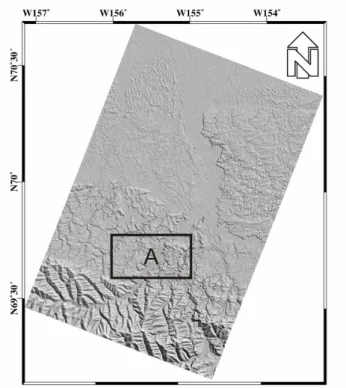
DEM generation by the proposed approach was carried out using ERS-2 and Envisat data listed in Table 1 acquired on the descending orbit of Jan. 25, 2008. The test site was northern Alaska. We used the national elevation dataset (NED) DEM to generate differential cross-interferogram. The ground resolution and vertical accuracy of the NED DEM are about 30 m and 2.5 m, resepectively.An airborne InSAR-derived DEM, which has a spatial resolution of 5 m and height error of 10 cm, is used for assessing the vertical accuracy of the DEM generated by the proposed CInSAR method. Figure 3 shows location map of the study area over northern Alaska.
Figure 3. Location map of the study area Table 1. characteristics of ERS-2 and Envisat pair
Parameters ERS-2 Envisat
Central frequency (GHz) 5.3 5.331 Study area Alaska(69N~71N,153W~158W) Acquisition date 2008-01-25
Time interval (min.) 28 (Envisat – ERS2)
Perpendicular Baseline (m) 2400
The ERS-2 and Envisat SLC images were generated using the same Doppler centoid and Doppler bandwidth calculated by the azimuth common band filtering to minimize the mis-registration, and then oversampled two times to reduce the unwrapping error. After DEM- assisted co-registration method for the precise registration of ERS-1 and Envisat SLC images is applied, the cross- interferogram was generated. And then, the differential cross-interferogram was generated by using interferogram simulated from the NED DEM, multi-looked by two looks in range and five looks in azimuth, resepctively, and unwrapped. Final unwrapped cross-interferogram was generated by the summation of the multi-looked and unwrapped differential cross-interferogram and the simulated unwrapped interferogram, and converted into topographic height map.
By this procedure, we can generate the CInSAR- derived DEM with the spatial resolution of 15 m. To assess the vertical accuracy of the CInSAR-derived DEM, we compared it with the airborne InSAR-derived DEM, which has the spatial resolution of 5 m and was produced in July, 2002. Figure 4 shows the CInSAR-derived DEM generated by the proposed method over the study area. As seen in Figure 4, we selected the area of “A” for accuracy assessment. The average height of area A is about 80 m.
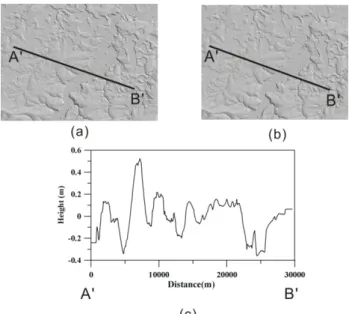
Figure 4. CInSAR-derived DEM over study area Figure 5 (a) and (b) shows the CInSAR-derived DEM and the airborne InSAR-derived DEM in the area A of Figure 4, respectively, and Figure 5 (c) represents the heigh difference between CInSAR-derived DEM and the airborne InSAR-derived DEM in the profile A-A’ shown in Figure 5 (a) and (b). The mean and standard deviation of the difference over study area are 0.01 m and 0.39 m,
resepctively. Figure 6 shows the height difference histogram. The histogram generally follows a Gaussian distribution with no bias. Mean of height difference was approximately zero. From these results, the vertical accuracy of the CInSAR-derived DEM is considered as about 38 cm, because the vertical accuracy of the airborne InSAR-derived DEM is 10 cm. If the seasonal height variation of the test site used for this study and the acquisition date difference of about 6 years between CInSAR-derived and airborne InSAR-derived DEM are considered, the vertical accuracy of the CInSAR-derived DEM would be less than 38 cm.
Figure 5. Comparison of (a) the airborne InSAR-derived DEM and (b) CInSAR-derived DEM. (c) represents the height difference between them in the profile of A-B shown in (a) and (b).
Figure 6. Histogram for height difference between the airborne InSAR-derived and CInSAR-derived DEM.
Although the proposed method dramatically overcomes the coregistration and unwrapping problems, the unwrapping of CInSAR interferogram can fail if the vertical accuracy of low quality DEM is more than the height ambiguity of cross-interferogram. In this case, the
InSAR-derived DEM generated by terraSAR-X and tanDEM-X system might be required.
5. CONCLUSION
The CInSAR method dramatically overcomes the baseline limitation of the conventional InSAR method and enables to produce a precise DEM by using a slight difference of radar carrier frequencies between ERS-2 and Envisat SAR images, which have the long baseline of more than 2 km and the short repeat-time of about 28min.
In this paper, we proposed an efficient CInSAR method to generate a high precise DEM, and assessed the height accuracy of the CInSAR-derived DEM by comparing it with an airborne InSAR-derived DEM having a spatial resolution of 5 m and height error of 10 cm. The mean and standard deviation of the height difference between CInSAR-derived DEM and the airborne InSAR-derived DEM over northern Alaska were about 0.07 m and 0.60 m, respectively. This result means that the proposed method enables to generate a high precise DEM of half-a- meter accuracy.
ACKNOWLEDGEMENTS
This research was supported by USGS Volcano Hazards Program. The airborne DEM was provided by USGS Alaska Science Center. This work was also supported by a National Research Foundation of Korea grant (No.
2010-0028194) funded by the Ministry of Educational Science and Technology of Korea, and funding to support the education of GIS experts.
REFERENCES
Colesanti, C., De Zan, F., Ferretti, A., Prati, C. and Rocca, F., 2003, Generation of DEM with sub-metric vertical accuracy from 30′ ERS–ENVISAT pairs, Proc. ‘Fringe 03’ Workshop, ESA-ESRIN.
Gatelli, F., Monti Guarnieri, A., Parizzi, F., Pasquali, P., Prati, C., Rocca, F., 1994, The Wavenumber Shift in SAR Interferometry, IEEE Transactions on Geoscience and Remote sensing, vol.31, no.4, pp.855-865.
Gens, R., Van Genderen, J.L., 1996, SAR Interferometry- issues, techniques, applications, International Journal of Remote Sensing, vol.17, no.10, p.1803-1835.
Guarnieri, A.M. and Prati, C., 2000, ERS-ENVISAT Combination for Interferometry and Super-Resolution.
Proceedings of ERS-Envisat symposium.
Hong, S.-H. and Won, J.-S., 2005, ERS-Envisat cross- interferometry for coastal DEM construction. Proceedings of 'Fringe 05' Workshop, ESA-ESRIN.
Lee, H. and J. G. Liu, 1999, Spatial Decorrelation due to Topography in the Interferometric SAR Coherence Imagery.
IGARSS1999.
Rabus, B., Eineder, M., Roth, A, Bameler, R., 2003, The shuttle radar topography mission-a new class of digital elevation models acquired by spaceborne radar, ISPRS Journal of Photogrammetry & Remote Sensing, vol.57, pp.241-262.
Wegmuller, U., Maurizio S., Werner, C., Strozzi, T., 2009, DEM generation using ERS-Envisat interferometry, Journal of Applied Geophysics, vol.69, no.1, pp.51-58.
Zebker, H.A., Werner C.L, Rosen, P.A, Hensley S., 1995, Accuracy of topographic maps derived from ERS-1 interferometric radar, IEEE Transactions on Geoscience and Remote Sensing, vol.32, no.4, pp.823-836.