Thiadiazolopyrimidines as Acid Corrosion Inhibitors for Mild Steel
S.Chitra†, K.Parameswari, M.Vidhya, M.Kalishwari, and A.Selvaraj1
Dept. of Chemistry, P.S.G.R. Krishnammal College for Women, Coimbatore
1Dept. of Chemistry, CBM College, Coimbatore
(Received October 25, 2010; Revised February 23, 2011; Accepted February 25, 2011)
The inhibitive action of thiadiazolopyrimidines on mild steel in 1 M H2SO4has been studied using weight loss, gasometric studies and electrochemical polarization and AC impedance measurements. The effect of temperature on the corrosion behaviour of mild steel in 1 M H2SO4 with optimum concentration of inhibitors was studied in the temperature ranging from 313-333K The adsorption of the inhibitor on the surface of mild steel was found to be exothermic, spontaneous and followed the mechanism of physisorption. The adsorption of these compounds on mild steel surface was found to obey Langmuir adsorption isotherm.
The protective film formed on the surface of mild steel by the adsorption of inhibitor in 1 M H2SO4 solution was confirmed by optical microscopic technique. Synergistic effect of halide ions on mild steel in 1 M H2SO4 was studied by weight loss technique.
Keywords : corrosion, inhibitor, thiadiazolopyrimidines, mild steel
†Corresponding author: [email protected]
1. Introduction
The corrosion of steel is a fundamental academic and industrial concern that has received a considerable amount of attention.1) Acid solutions are widely used in industry.
Some of the important fields of application being acid pickling of iron and steel, chemical cleaning and process- ing, ore production and oil well acidification. The heavy loss of metals as a result of its contact with acids can be minimized by the use of inhibitors.2) Inorganic com- pounds like chromates, phosphates, molybdates etc., and a variety of organic compounds containing hetero atoms like N, S and O are being investigated as corrosion inhi- bitors.3)-6) Among them, nitrogen containing heterocyclic compounds are considered to be effective corrosion in- hibitors on steel in acid media.7) N-heterocyclic compound inhibitors act by adsorption on the metal surface and the adsorption takes place through nitrogen hetero atom as well as the triple or conjugated double bonds or aromatic rings in their molecular structures.
2. Experimental method
Mild steel strips containing C, 0.084%, P, 0.025%, Mn, 0.369%, S, 0.027% and the remaining iron were used for the measurement of weight loss and gasometric studies.
For electrochemical studies, a cylindrical mild steel rod of the same composition embedded in Teflon with an ex- posed area of 0.785 cm2 was used. All the chemicals used for the synthesis of the inhibitors are of analar grade.
2.1 Synthesis of inhibitors
Thiadiazolopyrimidines (PTDA 1-6) were synthesized by the procedure reported byPandhy et al.8)
Synthesis was carried out in three steps. In the first step carboethoxy pyrimidine-2- one/thione were prepared by the condensation of urea/thiourea, ethylacetoacetate and aromatic aldehyde in ethanol in the presence of catalytic amount of con. HCl. The esters werethen converted into the corresponding hydrazides by reaction with hydrazine hydrate. The hydrazides were cyclised to thiadiazoles by reaction with KOH/CS2.
The reactions are presented in scheme 1.
Scheme 1
Table 1. Structure of the synthesised inhibitors
4-(phenyl)-5-(5’-mercaptothiadiazolo)6- methylpyrimidine-2-one
PTDA 1
4-(phenyl)-5-(5’-mercaptothiadiazolo)6- methylpyrimidine-2-thione
PTDA 2
4-(3’-methoxy, 4’-hydroxyphenyl)-5- (5’-mercaptothiadiazolo)-6-methyl pyrimidine-2-one
PTDA 3
4-(3’-methoxy, 4’-hydroxyphenyl)-5- (5’-mercaptothiadiazolo)-6-methyl pyrimidine-2-thione
PTDA 4
4-(4’-N, N-dimethylaminophenyl)-5- (5’-mercaptothiadiazolo)-6-methyl-2- pyrimidine-2-one
PTDA 5
4-(4’-N, N-dimethylaminophenyl)-5- (5’-mercaptothiadiazolo)-6-methyl-2- pyrimidine-2-thione
PTDA 6
Structures of synthesized inhibitors are presented in Table 1.
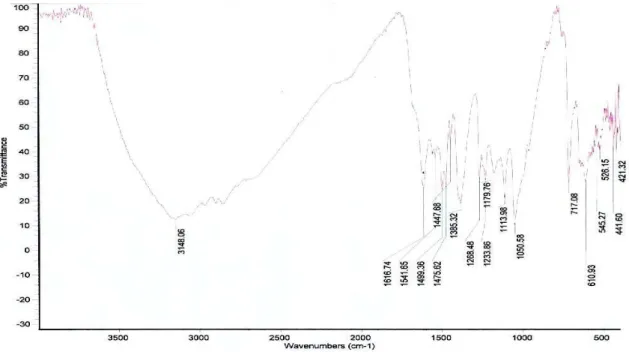
The synthesised inhibitors were characterized by IR spectra. The IR spectra of PTDA 6 is given in Fig. 1 2.2 Non-electrochemical methods
2.2.1 Weight loss (coupon) method
Mild steel specimens of size 5 cm × 2 cm × 0.05 cm were used for weight loss method. The mild steel speci- mens were polished with emery papers of 1/0 to 4/0 grades and degreased with trichloroethylene. The specimens were suspended into the experimental solution (200 ml) contain- ing 1 M H2SO4 and different concentrations of the inhi- bitors. The initial weights of the specimens were noted.
After three hours, the specimens were removed, washed with running water, dried and weighed. From the initial and final masses of the specimens, the loss in mass was calculated. Inhibition efficiency (IE) and corrosion rate were calculated using the following equations.
Efficiency of inhibitor =
×100
Corrosion Rate (mpy) =
× ×
×
Fig. 1. IR SPECTRA OF PTDA 6.
The weight loss method was repeated at higher temper- atures from 313-333K at a concentration of 2.5 mM of the inhibitors.
2.3 Gasometric method
The efficiency of the inhibitors was also determined by gasometric technique from the volume of H2 gas collected in the absence and presence of inhibitors at 30 ± 1℃. The inhibition efficiency was calculated using the formula,
×
where VB & VI are volume of H2 evolved in the absence and presence of inhibitors.
2.4 Electrochemical techniques
Electrochemical measurements were carried out using the potentiostat Solartron, U.K. model 1208 B.
2.4.1 Potentiodynamic polarisation studies
Polarisation studies were carried out in a conventional three electrode glass cell assembly with a platinum counter electrode and saturated calomel electrode (SCE) as refer- ence from a potential range of -200 mV to + 200 mV with respect to open circuit potential at a scan rate of 1 mV/sec for mild steel, both in the presence and absence of inhi- bitors. Polarisation measurement were performed to eval- uate the corrosion kinetic parameters such as ICorr, ECorr
and Tafel slopes ba and bc.
×
where Icorr and Icorr(inh) are the corrosion current in the ab- sence and presence of inhibitors.
2.4.2 Electrochemical impedance measurements
The electrochemical impedance measurements were car- ried out at corrosion potential over a frequency range of 10 KHz to 0.01 Hz with single amplitude of 10 mV for mild steel in acidic media. Impedance measurements were carried out for mild steel in 1 M H2SO4 with and without inhibitors for the selected concentrations of the inhibitors.
Inhibitor efficiency was calculated using the formula,
×
where Rt(inh) & Rt(blank) are charge transfer resistance obtained in the absence and presence of the inhibitors.
2.5 Synergistic effect
The synergistic inhibitions of mild steel in 1 M H2SO4
by a combination of PTDA and halide ions have been studied using weight loss method. The mild steel speci- mens were immersed in 1 M H2SO4 containing various concentrations of the inhibitor and 1 mM halide ions each for a duration of 3hrs. From the weight loss, the inhibition efficiency and corrosion rate were calculated.
Table 2. Inhibition efficiencies of various concentrations of the inhibitors for corrosion of mild steel in 1 M H2SO4 obtained by weight loss measurement at 30±1℃
Name of the inhibitor
Concentration (mM)
Weight loss (g)
Inhibition efficiency (%)
Degree of surface coverage (θ)
Corrosion rate (mpy)
PTDA1
Blank 0.5056 - - -
0.1 0.2564 49.29 0.4929 1945.05 0.15 0.2129 57.89 0.5789 1615.05 0.25 0.1881 62.79 0.6279 1426.9
0.5 0.1131 77.63 0.7763 857.9
1 0.0399 92.11 0.9211 302.76
1.5 0.0313 93.81 0.9381 237.5 2.5 0.0248 95.09 0.9509 188.21
PTDA2
Blank 0.5056 - - -
0.1 0.2238 55.74 0.5574 1697.75 0.15 0.1455 71.22 0.7122 1103.76 0.25 0.0505 90.01 0.9001 383.47
0.5 0.0236 95.13 0.9513 179.41
1 0.0092 98.18 0.9818 69.79
1.5 0.0107 97.88 0.9788 81.17 2.5 0.0067 98.67 0.9867 51.36
PTDA3
Blank 0.5056 - - -
0.1 0.3613 28.54 0.2854 2740.8 0.15 0.3522 30.34 0.3034 2671.78 0.25 0.3317 34.39 0.3439 2516.27 0.5 0.2947 41.71 0.4171 2235.59
1 0.2365 53.22 0.5322 1794.09 1.5 0.2285 54.81 0.5481 1733.4 2.5 0.2142 57.63 0.5763 1624.9
PTDA4
Blank 0.5056 - - -
0.1 0.4066 19.58 0.1958 3084.47 0.15 0.3852 23.81 0.2381 2922.13 0.25 0.3328 34.18 0.3418 2524.6
0.5 0.3156 37.57 0.3757 2394.14 1 0.2635 47.88 0.4788 1998.91 1.5 0.2325 54.01 0.5401 1763.75 2.5 0.1829 63.82 0.6382 1387.5
PTDA5
Blank 0.5056 - - -
0.1 0.0970 80.81 0.8081 735.84 0.15 0.0606 88.01 0.8801 459.71 0.25 0.0293 94.20 0.9420 222.27 0.5 0.0195 96.14 0.9614 147.9
1 0.0155 96.93 0.9693 117.58
1.5 0.0110 97.82 0.9782 83.45 2.5 0.0079 98.43 0.9843 59.93
PTDA6
Blank 0.5056 - - -
0.1 0.0854 83.11 0.8311 647.9 0.15 0.0262 94.81 0.9481 198.8 0.25 0.0184 96.36 0.9636 139.7 0.5 0.0118 97.67 0.9767 89.60
1 0.0069 98.63 0.9863 52.34
1.5 0.0053 99.05 0.9905 40.21
2.5 0.0009 99.82 0.9982 7.05
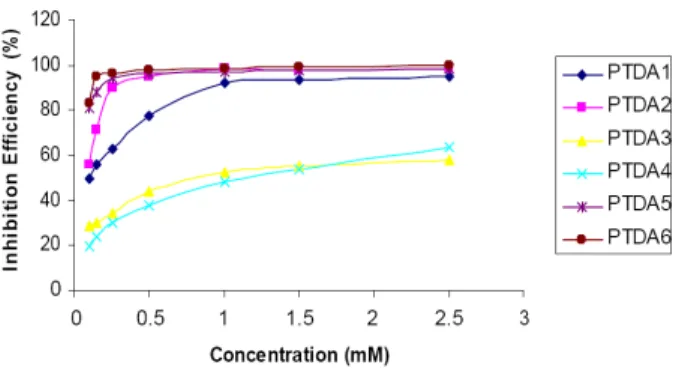
Fig. 2. Plot of Inhibition efficiency (%) Vs concentration (mM) for the inhibition of corrosion of mild steel in 1 M H2SO4.
3. Results and discussion
3.1 Weight loss studies
Table 2 shows the values of inhibition efficiency (IE) and corrosion rate (CR) obtained from weight loss meas- urements at different concentrations of inhibitors at 30 ℃.
It has been found that the weight loss decreases and in- hibition efficiency of the thiadiazolopyrimidine derivatives (PTDA 1-6) increases with increase in inhibitor concen- tration (Fig. 2). The maximum inhibition efficiency was achieved at 2.5 mM concentration for all the inhibitors (except PTDA 3 and PTDA 4). The efficiency of the com- pounds is due to the presence of π-electrons of aromatic rings and lone pair of electrons on nitrogen and sulphur atoms. Schmitt9) reported that a mixture of nitrogen and sulphur containing compounds are better inhibitors than either type alone. The decrease in corrosion rate with in- crease in inhibitor concentration is due to increase in sur- face coverage θ, which shows that the compounds form a protective adsorptive layer on the surface. Thus adsorp- tion forms the mechanism of inhibition.
3.2 Effect of temperature
The results obtained for the corrosion of mild steel in 1 M H2SO4 in the absence and presence of PTDA 1-6 in the temperature range 30-60 ℃ (Table 3) revealed that increase in temperature increases corrosion rate and de- creases the inhibition efficiency at 2.5 mM concentration of the inhibitors. According to Dehri and Ozcan10) the rela- tionship between temperature dependence of inhibition ef- ficiency (%) of an inhibitor and the activation energy (Ea) found in its presence is as follows (a) Inhibitors whose inhibition efficiency (%) decrease with temperature in- crease, the value of activation energy (Ea) found is greater than that in the uninhibited solution.(b)Inhibitors whose inhibition efficiency (%) does not change with temperature variation, the activation energy (Ea) does not change with
the presence or absence of inhibitors. (c) Inhibitors whose inhibition efficiency (%) increases with temperature in- crease, the value of activation energy (Ea) is less than that in the inhibited solution.
In an acidic solution the corrosion rate is related to tem- perature by the Arrhenius equation,
log
log (1)
where 'CR' is the corosion rate, 'Ea' is the apparent activa- tion energy, 'R' is the molar gas constant, 'T' is the absolute Table 3. Inhibition efficiencies of 2.5 mM concentration of various inhibitors for corrosion of mild steel in 1 M H2SO4 obtained by weight loss measurement at higher temperature
Name of the inhibitor
Temperature (K)
Weight loss (g)
Inhibition efficiency
(%)
Corrosion rate (mpy)
Blank
303 05056 - - 313 0.3029 - - 323 0.4865 - - 333 0.8084 - -
PTDA1
303 0.0248 95.09 188.13 313 0.0239 92.11 543.89 323 0.0410 91.57 933.04 333 0.0684 91.53 1556.58
PTDA2
303 0.0067 98.67 50.82 313 0.0049 98.38 111.51 323 0.0104 97.86 236.67 333 0.0213 97.37 484.72
PTDA3
303 0.2142 57.63 1624.9 313 0.1426 52.92 3245.15 323 0.2813 42.18 6401.54 333 0.5504 31.91 12525.45
PTDA4
303 0.1829 63.83 1387.48 313 0.1200 60.38 2730.84 323 0.1957 59.77 4453.54 333 0.329 59.30 7487.05
PTDA5
303 0.0079 98.44 59.93 313 0.005 98.35 113.79 323 0.009 98.15 204.81 333 0.0202 97.50 459.69
PTDA6
303 0.0009 99.82 6.827 313 0.0015 99.50 34.14 323 0.0031 99.36 70.55 333 0.0052 99.35 118.34
temperature and 'A' is the frequency factor.
The values of Ea were computed from the slope of the Arrhenius plots (Fig. 3) and are listed in Table 4. It is clear from the Table 4 that Ea values in the presence of additives are higher than that in the absence. The higher activation energies imply a slow reaction and that the re- action is very sensitive to temperature. The increase in Ea signifies physical adsorption. This conclusion is de- noted by the decrease in inhibition efficiency with increas- ing temperature.
The standard free energy of adsorption ΔG0ads was cal- culated using the relation
°
(2)where 55.5 is the concentration of water in solution in moles/litre. The negative values of ΔG0ads (Table 4) ensure the spontaneity of the adsorption process and the stability of the adsorbed layer. Generally values of ΔG0ads upto -20 KJmol-1 are consistent with physisorption, while those around -40 KJ mol-1 or higher is associated with chem- isorption as a result of sharing or transfer of electrons from organic molecules to metal surface.11) Enthalpy and Entropy of activation ΔH0 and ΔS0 were obtained by applying the transition state equation. Plots of log (CR/T) as a function of 1/T were made (Fig. 4). Straight lines were obtained with slope (-ΔH0/R) and an intercept (ln R/Nh+ΔS0/R) from which the values of ΔH0 and ΔS0 were calculated and listed in Table 5. While an endothermic adsorption process (ΔH0>0) is attributed unequivocally to chem- isorptions, an exothermic adsorption process (ΔH0 <0) may involve either physisorption or chemisorption or a mixture of both processes. In the present work, the neg- ative value obtained may introduce both chemisorption and physisorption processes. This may be interpreted by the presence of hetero atoms nitrogen, oxygen/sulphur which leads to co-ordinate bonds, and aromatic rings which get physisorbed. Also the negative values of ΔH0 show that the adsorption is exothermal with an ordered phenomenon
Fig. 3. Arrhenius plots for mild steel in 1 M H2SO4 solution in the absence and presenceof inhibitors.
Table 4. Activation energies (Ea) and free energy of adsorption (ΔG°ads) for the corrosion of mild steel in 1 M H2SO4 at 2.5 mM concentration of the inhibitors
Name of the
inhibitor Ea (kJ) ΔG°ads at various temperatures (kJ) 303 K 313 K 323 K 333 K Blank 43.63 - - - - PTDA1 68.34 -6.63 -6.28 -6.39 -6.58 PTDA2 76.24 -10.30 -9.49 -9.50 -9.77 PTDA3 55.43 -3.03 -3.64 -3.25 -2.82 PTDA4 68.03 -8.10 -8.14 -8.14 -8.07 PTDA5 63.91 -7.93 -8.12 -8.25 -8.13 PTDA6 56.94 -4.01 -3.98 -4.08 -4.18
Table 5. Kinetic/Thermodynamic Parameters for mild steel corrosion in 1 M H2SO4
Name of the Inhibitor
Ea
KJ/mole
-∆H°
KJ/mole
-∆S°
KJ/mole Blank 0.0408 0.0177 0.130 PTDA1 0.0641 0.0278 0.106 PTDA2 0.0637 0.0277 0.116 PTDA3 0.0526 0.0229 0.116 PTDA4 0.0507 0.0220 0.120 PTDA5 0.0511 0.0222 0.126 PTDA6 0.0631 0.0274 0.104
Fig. 4. Transition state plot for mild steel corrosion in 1 M H2SO4 in the absence and presence of 2.5 mM concentration of the inhibitor.
ascribed by the negative values of ΔS0.12) The negative value of ΔS0 decreases in the presence of inhibitor as com- pared to that in their absence ie., there is an increase in entropy in the presence of inhibitor. This indicates that the adsorption process is spontaneous and there is an in- crease in randomness or disorder on the surface due to the adsorption process and also desorption at higher tem- peratures.
3.3 Adsorption isotherm
It is generally accepted that organic molecules inhibit corrosion by adsorption at the metal/solution interface and that the adsorption depends on the chemical composition of the molecule, the temperature and the electrochemical potential at the metal/ solution interface. The solvent water molecules could also adsorb at metal/solution interface.13) Hence the adsorption of organic inhibitor molecules from the aqueous solution can be regarded as a quasi sub- stitution process between the organic compound in the aqueous phase (org(sol)) and water molecules at the elec- trode surface (H2O(ads)).14)
Org(sol) + x H2O(ads) ↔ Org(ads) + x H2O(sol) (3) where 'x' is the size ratio, (ie.,) the number of water mole- cules replaced by one molecule of organic inhibitor. Basic information of the adsorption of inhibitor on metal surface can be provided by an adsorption isotherm. Attempts were made to fit experimental data to various isotherms includ- ing Frumkin, Langmuir, Temkin, Freundlich, Bockris- Swinkels and Flory-Huggins isotherms. The Langmuir iso- therm was found to fit well with the experimental data.
The adsorption isotherm of Langmuir is represented by the following equation,
(4)
Rearranging this equation,
(5)
where 'θ' is the degree of surface coverage, 'K' is the equi- librium constant of the adsorption process and 'C' is the inhibitor concentration. It was found that a plot of C/θ Vs C is a straight line for all the inhibitors. Fig. 5 depicts the graph of the Langmuir adsorption isotherm for the compounds. As adsorption is of Langmuir character it can be concluded that the organic molecules are attached as a monolayer and through a physical mechanism.
Fig. 5. Langmuir plot of inhibitors in 1 M H2SO4.
Table 6. Inhibition efficiencies for the selected concentrations of the inhibitors for the corrosion of mild steel in 1 M H2SO4
obtained by gasometric measurement Name of the
inhibitor
Concentration (mM)
Volume of gas (cc)
Inhibition efficiency (%) Blank 26.4 -
PTDA1
0.1 13.6 48.48 0.25 9.5 64.02 1 2.37 91.02 2.5 0.88 96.67
PTDA2
0.1 11.97 54.66 0.25 2.45 90.73 1 0.44 98.35 2.5 0.29 98.89
PTDA3
0.1 19.11 27.61 0.25 17.05 35.40
1 12.64 52.12 2.5 10.83 58.99
PTDA4
0.1 21.02 20.38 0.25 16.19 38.69
1 13.32 49.55 2.5 9.25 64.98
PTDA5
0.1 4.89 81.44 0.25 1.74 93.42
1 1.06 95.98 2.5 0.39 98.52
PTDA6
0.1 4.16 84.21 0.25 1.21 95.43
1 0.50 98.11 2.5 0.084 99.68
3.4 Gasometric studies
Table 6 gives the values of inhibition efficiency ob- tained using gasometric method from the volume of gas collected in the absence and presence of inhibitors at con- stant temperature of about 30 ± 1℃ for the corrosion of mild steel in 1 M H2SO4. The volume of gas collected decreased with increase in the concentration of the inhi- bitor. There is a good agreement between the values of inhibition efficiency obtained from weight loss method and gasometric measurements.
3.5 Electrochemical studies
3.5.1 Electrochemical behaviour of impedance
A simple electrode reaction such as metal deposition or metal dissolution can be represented by a modified equivalent circuit
Rs - series resistance
Rt - charge transfer resistance Cdl - double layer capacitance
By adopting complex plane analysis for the total cell impedance Z, Sluyters et al.,15) have resolved it into real and imaginary components as,
′
(6)
″
(7)
The simplified equation for cell impedance is
′
″
(8)
which is the equation of a semi circle (Z" vs. Z' -constant concentration) with its centre on Z' axis at Z' = RsT1/2Rt
and radius 1/2 Rt. The interactions with the Z' axis are at Z' = Rs for ω = α and at Z' = Rs+ Rt for ω = 0. These are called Nyquist plots. With an increase in inhibitor con- centration, the radius of the semicircle increases, the dou- ble layer capacitance Cdl decreases. In the current inves- tigation also for all the tested inhibitors Cdl decreases with increase in inhibitor concentration(Table 7, Fig. 6) ob- viously due to increased adsorption as required by theory.
These observations have been supported by the findings of Selvaraj16),17) in the study of effect of adsorption of eth- ylamine on the reduction of Pd (II) on the dropping mer- cury electrode.
3.5.2 Polarization behaviour of inhibition
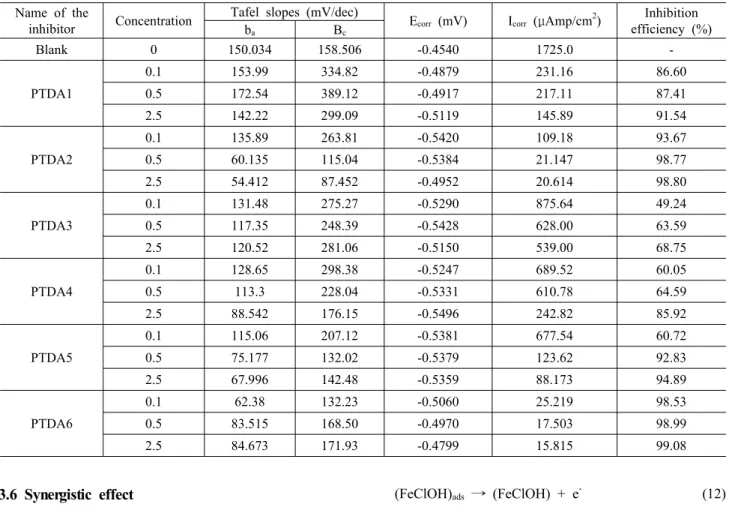
Analysis of the polarization data in Table 8 reveals that Ecorr values are only slightly shifted in the presence of the inhibitors, Icorr values decrease with increase in the concentration of the inhibitors. The Tafel constants ba and bc are both affected but bc is affected to a greater extent (Fig. 7). Hence it can be concluded that although all the inhibitors behave as mixed type but more cathodic in nature.
Table 7. AC-impedance parameters for corrosion of mild steel for selected concentrations of the inhibitors in 1 M H2SO4
Name of the inhibitor
Concentra- tion (mM)
Rt
(ohm cm2) 2Cdl
(μF/cm2)
Inhibition efficiency
(%) Blank 0 10.5299 34.2381 - PTDA1
0.1 60.54 9.0297 82.62 0.5 80.23 6.9159 86.89 2.5 117.46 5.5556 91.04 PTDA2
0.1 65.74 11.56 83.98 0.5 118.03 6.933 91.08 2.5 359.72 5.8049 97.07 PTDA3
0.1 22.94 11.397 54.10 0.5 26.89 9.6651 60.84 2.5 62.54 7.7213 83.16 PTDA4
0.1 63.55 7.4837 83.43 0.5 69.11 7.1954 84.76 2.5 78.64 6.2964 86.61 PTDA5
0.1 81.07 8.3109 87.01 0.5 83.27 7.8445 87.37 2.5 186.44 7.6712 94.35 PTDA6
0.1 277.82 3.8764 96.21 0.5 751.01 2.6752 98.60 2.5 802.34 1.9733 98.69
Fig. 6. Nyquist diagram for mild steel in 1 M H2SO4 for selected concentrations of inhibitor PTDA 6.
Fig. 7. Polarization curves for mild steel in 1 M H2SO4 for selected concentrations of inhibitor PTDA 6.
Table 8. Corrosion parameters for corrosion of mild steel with selected concentrations of the inhibitors in 1 M H2SO4 by potentiodynamic polarization method
Name of the
inhibitor Concentration Tafel slopes (mV/dec)
Ecorr (mV) Icorr (μAmp/cm2) Inhibition efficiency (%) ba Bc
Blank 0 150.034 158.506 -0.4540 1725.0 - PTDA1
0.1 153.99 334.82 -0.4879 231.16 86.60 0.5 172.54 389.12 -0.4917 217.11 87.41 2.5 142.22 299.09 -0.5119 145.89 91.54 PTDA2
0.1 135.89 263.81 -0.5420 109.18 93.67 0.5 60.135 115.04 -0.5384 21.147 98.77 2.5 54.412 87.452 -0.4952 20.614 98.80 PTDA3
0.1 131.48 275.27 -0.5290 875.64 49.24 0.5 117.35 248.39 -0.5428 628.00 63.59 2.5 120.52 281.06 -0.5150 539.00 68.75 PTDA4
0.1 128.65 298.38 -0.5247 689.52 60.05 0.5 113.3 228.04 -0.5331 610.78 64.59 2.5 88.542 176.15 -0.5496 242.82 85.92 PTDA5
0.1 115.06 207.12 -0.5381 677.54 60.72 0.5 75.177 132.02 -0.5379 123.62 92.83 2.5 67.996 142.48 -0.5359 88.173 94.89 PTDA6
0.1 62.38 132.23 -0.5060 25.219 98.53 0.5 83.515 168.50 -0.4970 17.503 98.99 2.5 84.673 171.93 -0.4799 15.815 99.08
3.6 Synergistic effect
The synergistic influence of the added halide ions on the inhibition of mild steel corrosion by thiadiazolopyr- imidine derivatives can be explained on the basis of a con- cept proposing the direct participation of halide ions in the mechanism of corrosion. According to this concept, corrosion of steel in acidic solution is the sum of the fol- lowing reactions.
Anodic : Fe → Fe2+ + 2e- (9)
Cathodic : H+ + e- → 1/2 H2 (10) However each of these reactions proceeds through many consecutive steps depending on pH and type of anions present in the solution. There are two main theories for inhibition based on the work of Heusler18) and Bockris.19) Both theories indicate the participation of anions of the solutions directly. Anodic dissolution of iron in acidic me- dium can be written as
Fe + Cl- + H2O → (FeClOH)ads + H+ + e- (11)
(FeClOH)ads → (FeClOH) + e- (12) (FeClOH) → Fe2+ + Cl- + H2O (13) Adsorption of halide ions on the metal surface affects the above kinetics of dissolution of steel.
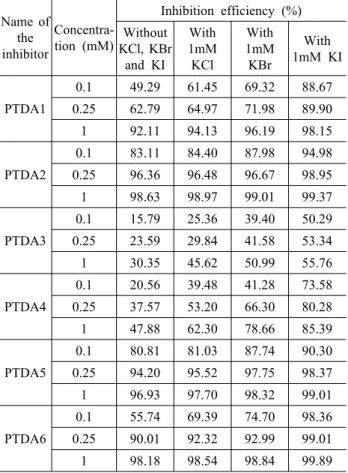
The inhibition efficiency values for the inhibitors in the presence of three halide ions are presented in Table 9.
It indicates that the enhancement of efficiency follows the order I-> Br->Cl-. Such an observation has also been re- ported by early workers who found that the adsorption and inhibiting action of organic cations and halide ions on metals of iron group increases in sequence from Cl- to Br- and becomes maximum for I- ions.
The gradation in synergism observed in the current work is due to the difference in the anion adsorption which is found to be the highest for I- ions, little lesser for Br- and least for Cl-. In the adsorption process, the radii and electronegativity of the halides seem to have played a sig- nificant role. I- ions with largest deformable electron shells and with least electronegativity ought to have formed strongest chemical bonds with the metal surface and hence exhibit highest degee of synergism compared to other halides.20)
Table 9. Synergistic effect of 1 mM KCl / KBr / KI on the inhibition efficiency of inhibitors by weight loss method at 30±1℃
Name of the inhibitor
Concentra- tion (mM)
Inhibition efficiency (%) Without
KCl, KBr and KI
With 1mM KCl
With 1mM KBr
With 1mM KI
PTDA1
0.1 49.29 61.45 69.32 88.67 0.25 62.79 64.97 71.98 89.90 1 92.11 94.13 96.19 98.15 PTDA2
0.1 83.11 84.40 87.98 94.98 0.25 96.36 96.48 96.67 98.95 1 98.63 98.97 99.01 99.37 PTDA3
0.1 15.79 25.36 39.40 50.29 0.25 23.59 29.84 41.58 53.34 1 30.35 45.62 50.99 55.76 PTDA4
0.1 20.56 39.48 41.28 73.58 0.25 37.57 53.20 66.30 80.28 1 47.88 62.30 78.66 85.39 PTDA5
0.1 80.81 81.03 87.74 90.30 0.25 94.20 95.52 97.75 98.37 1 96.93 97.70 98.32 99.01 PTDA6
0.1 55.74 69.39 74.70 98.36 0.25 90.01 92.32 92.99 99.01 1 98.18 98.54 98.84 99.89
3.7 Visual examination
The mild steel plates immersed for 3 hours in 1 M H2SO4 and in 1 M H2SO4 containing 2.5 mM PTDA1-6 were air dried and examined using an optical microscope (OLYMPUS BX51M).The photographed mild steel plates are shown in the Fig. 8. Much information about the sur- face morphology cannot be obtained from the photographs.
Visual examination of the photographs reveals that the ad- dition of the inhibitors results in the formation of a pro- tective layer on the mild surface and protects it from corrosion.
3.8 Mechanism of inhibition
It is generally assumed that the adsorption of the in- hibitors at the metal/aggressive solution interface is the first step in the inhibition mechanism.21) Considering the dependence of inhibition efficiency on the concentration as represented in Fig. 2, it can be concluded that the in- hibitor acts by adsorbing and blocking the available active centres for steel dissolution. The adsorption process is made possible due to the presence of hetero atoms such as N, O and S which are regarded as active adsorption
Fig. 8. Optical Microscope images of mild steel surface without and with the addition of PTDA 6.
centres. The thiadiazolopyrimidines PTDA 1,3,5 contain four nitrogen, two sulphur and one oxygen atoms and PTDA 2,4,6 contain four nitrogen and three sulphur atoms.
Besides these compounds, contain a phenyl ring and two
>C=N groups. The compounds could be adsorbed by the interaction between the lone pair of electrons of the oxy- gen, nitrogen and sulphur atoms, the electron rich πsys- tems of the aromatic rings and the >C=N groups on the mild steel surface. This process as earlier reported by Umoren and Ebenso22) may be facilitated by the presence of vacant d-orbital of iron. The thiadiazolopyrimidines in- hibit the corrosion by controlling both the anodic and cathodic reactions. In acidic solutions these compounds exist as protonated species. These protonated species ad- sorb on the cathodic sites of the mild steel and decreases the evolution of hydrogen. The positively charged proto- nated species facilitates adsorption of the compound on the metal surface through electrostatic interactions be- tween the organic molecules and the metal surface.23) 3.9 Evaluation of inhibitors
The order of inhibition efficiency of thiadiazolopyr- imidin-2-one is
PTDA5> PTDA1>PTDA3
and thiadiazolopyrimidine-2-thione is PTDA6> PTDA2>PTDA4
From the analysis of the inhibition efficiency data pre- sented in Table 2, it is evident that due to the presence
of electron donating group -NMe2 in the benzene rings.
PTDA 5 & PTDA 6 display a maximum inhibition effi- ciency of 98.43 and 99.82 respectively. This may be due to the presence of 2-CH3 groups (+I effect) which enhan- ces the electron density on the nitrogen and thereby pro- vide additional anchoring sites for adsorption. PTDA5 &
PTDA6 have higher inhibition efficiency (IE) compared to the parent compounds PTDA1 & PTDA2 respectively.
Similarly the inhibitors PTDA3 & PTDA4 are also ex- pected to exhibit a higher inhibition efficiency due to the presence of electron donating -OCH3 & -OH group. But their inhibition efficiency values are less compared to the parent compounds PTDA1& PTDA2. This decrease in in- hibition efficiency may be attributed to the greater sol- ubility of the hydroxy compound in aqueous acid medium leading to the dissolution of the inhibitor film from the metal surface. This is supported by the findings of Quraishi etal.24) In general pyrimidine-2-thiones PTDA 2,4 & 6 have slightly higher inhibition efficiency compared to pyr- imidine-2-ones PTDA 1,3 & 5. This may be due to pres- ence of an additional sulphur atom in the pyrimidine- thiones.
4. Conclusions
The conclusions arrived based on the investigations are 1) The order of inhibition efficiency of the synthesized compounds at 2.5 mM concentration is
PTDA 5 > PTDA 1 > PTDA 3 PTDA 6 > PTDA 2 > PTDA 4
2) All the synthesised compounds are effective in- hibitors for corrosion of mild steel in 1 M H2SO4. 3) The inhibition efficiency increases with increase in inhibitor concentration and decreases with increasing temperature.
4) They inhibit corrosion by getting adsorbed on the metal surface following Langmuir adsorption isotherm.
5) The Tafel slopes obtained from potentiodynamic po- larization curves indicate that all the inhibitors behave as mixed type but cathodic effect is more pronounced.
6) Addition of halide ions to the inhibitors shows an increase in inhibition efficiency. The synergistic influence of halide ion follows the order I-> Br->Cl-.
7) The inhibitive performance of pyrimidin-2-thiones is higher compared to pyrimidin-2one.
References
1. F. Bentiss, M. Traisnel, and M. Lagrenee, Corros. Sci., 42, 127 (2000).
2. G. Trabanelli, Corrosion, 47, 410 (1991).
3. S. A. M. Refacy, Appl. Surf. Sci., 240, 396 (2005).
4. M. A. Quraishi and H. K. Sharma, J. Appl. Electrochem, 35, 33 (2005).
5. A. Ashassi-Sorkhavi, B. Shaaban, and D. Seifzadeh, Appl. Surf. Sci., 239, 239 (2005).
6. M. Bouklah, A. Ouassini, B. Hammouti, and A. E. Idrissi, Appl. Surf. Sci., 252, 2178 (2006).
7. F. Bentiss, M. Traisnel, L. Gengembree, and M.
Lagrenee, Appl. Surf. Sci., 161, 194 (2000).
8. A. K. Pandhy, M. Bardhan, and S. Panda, Indian J.
Chem., 42B, 910 (2003).
9. G. Schmitt, British Corros. J., 19, 99 (1984).
10. I. Dehri and M. Ozcan, Mater. Chem. Phys., 98, 316 (2006).
11. F. M. Donahue and K. Nobe, J. Electrochem. Soc., 112, 886 (1965).
12. E. E. Ebenso, H. Alemu, S. A. Umoren, and I. B. Obot, Int. J. Elctrochem. Sci., 3, 1325 (2008).
13. J. Y. Zou and B. H. Yang, Mater. Prot., 21, 4 (1988).
14. M. Sahin, S. Bilgic, and H. Yilmaz, Appl. Surf. sci., 195, 1 (2002).
15. J. H. Sluyters, RECUEIL, 79, 1092 (1960).
16. A. Selvaraj and R. S. Subrahmanya, J. Electrochem.
Soc., 32, 193 (1988).
17. A. Selvaraj and R. S. Subrahmanya, J. Electrochem.
Soc., 32, 225 (1987).
18. K. E. Heusler, J. Electrochem. Soc., 62, 529 (1958).
19. J. O. M. Bockris, B. Drazic, and A. R. Drazic, Electro- chem. Acta, 4, 325 (1961).
20. Z. A. Iofa, V. V. Batrokov, and Cho NgokBa, Zaschita Metallor, 1, 56 (1995).
21. L. Niu, H. Zhang, F. Wei, S. Wa, X. Cao, and P. Lui, Appl. Surf. Sci., 252, 1634 (2005).
22. S. A. Umoren and E. E. Ebenso, Mater. Chem. Phys., 106, 387 (2007).
23. M. A. Quraishi, A. S. Mideen, M. A. W. Khan, and M. Ajmal. Indian, J. Chem. Technol., 1, 329 (1994).
24. S. Muralidharan, M. A. Quraish, and V. K. Iyer, Corros.
Sci., 37, 1739 (1995).