Evaluation of the inhibitive characteristics of 1,4-dihydropyridine derivatives for the corrosion of mild steel in 1M H
2SO
4P. Sounthari, A. Kiruthika, J. Sai santhoshi, S. Chitra†, K. Parameswari, and A. Selvaraj1 P.S.G.R.Krishnammal College for Women, Peelamedu, Coimbatore–641004, Tamil Nadu, India.
1CBM College, Coimbatore–641004, Tamil Nadu, India.
(Received March 16, 2013; Revised April 24, 2013; Accepted April 25, 2013)
The present investigation deals with the corrosion inhibition of mild steel in 1M H2SO4 with 1, 4-dihydro pyridine and its derivatives prepared using microwave activation method. The synthesis of inhibitor was confirmed by IR spectra. The effect of 1, 4-dihydropyridine derivatives on the corrosion inhibition of mild steel in 1M H2SO4 was studied using weight loss and electrochemical polarization techniques. Influence of temperature (303-333K) and synergistic effect of halide ions (I–, Br– and Cl–) on the inhibition behaviour was also studied. Corrosion products on the metal surface were analyzed by scanning electron microscopy (SEM) and a possible mechanism of inhibition by the compounds is suggested. Thermodynamic parameters were calculated using weight loss data in order to elaborate the mechanism of corrosion inhibition. Polarization measurements revealed that the studied compounds acted as mixed type inhibitor but slightly anodic in nature. Electrochemical impedance measurements revealed that the compounds were adsorbed onto the carbon steel surface and the adsorption obeyed the Langmuir adsorption isotherm. The synergistic effect of halide ions on the IE increases with increase in concentration. The IE obtained from atomic absorption spectrophotometric studies was found to be in good agreement with that obtained from the conventional weight loss method. SEM revealed the information of a smooth, dense protective layer in presence of the inhibitors.
Keywords :dihydro pyridine, IE, impedance, polarization, SEM
†Corresponding author: [email protected]
1. Introduction
Acid solutions are widely used in industrial processes.
The most important field of applications are in acid pickling, industrial acid cleaning, descaling and oil well acidizing.
Acids are also used in numerous manufacturing processes.
Due to the general aggressive nature of acid solutions, in- hibitors are commonly employed to reduce corrosive attack on metallic materials.1) Compounds containing nitrogen, sul- phur and oxygen have been reported as inhibitors.2) Organic inhibitors are widely used in various industries. Recently more study shows that the inhibitive effect is found to en- hance several nitrogen containing organic compounds for mild steel in acid solutions. The efficiency of an organic compound as an inhibitor is mainly dependent on its ability to get adsorbed on metal surface which consists of a replace- ment of water molecule at a corroding interface as Org(Sol)+nH2O(ads)→Org(ads)+nH2O(Sol) (1)
The adsorption of these compounds is influenced by the electronic structure of inhibiting molecules, steric factor, aromaticity and electron density at donor site, presence of functional group such as –CHO, –N =N, R–OH, etc., molecular area and molecular weight of the inhibitor molecule.3) Organic nitrogen compounds which usually employed for their rapid action in acidic solutions specifies the corrosion behaviour of iron and steel.4) The most effi- cient organic inhibitors are organic compounds having π -bonds in their structures.5) Compounds with π-bonds also generally exhibit good inhibitive properties by providing electrons to interact with metal surface.6) Among them heter- ocyclic compounds comprise a potential class of inhibitors.
Compounds with functional groups containing hetero-atoms, which can donate lone pair electrons are found to be partic- ularly useful as inhibitors for metal corrosion.7-10) The corro- sion inhibiting properties of these compounds are attributed to their molecular structures.
Thus, compounds with nitrogen and oxygen function group as well as multiple bonds or aromatic rings are con-
sidered to be one of the effective chemicals for inhibiting the corrosion of metals.11) These compounds can adsorb on the metal surface and block the active sites on the sur- face and thereby reduce the corrosion rate. Even though compounds containing different type of function groups are easily accessible and known for many decades. The literature available to date about the corrosion efficiencies of multiple hydroxyl compounds which simultaneously possess other function groups is very scarce.
The present investigation deals with the corrosion in- hibition of mild steel in 1M H2SO4 with 1,4-dihydro pyr- idine prepared using microwave activation method and its derivatives by weight loss, gasometric, potentiodynamic polarization and AC-impedance techniques. The syner- gistic effect by the addition of halide ions has been carried out. The effect of temperature on corrosion and inhibition processes was also assessed
2. Experimental method
Mild steel electrode having composition 0.084% C, 0.369% Mn, 0.129% Si, 0.025% P, 0.027% S, 0.022%
Cr, 0.011% Mo, 0.013% Ni and the reminder iron were used. For weight loss and gasometric measurements, cold rolled mild steel rectangular specimens of size 5 cm ´ 2 cm ´ 0.05 cm were used in this investigation.
For electrochemical methods, a mild steel rod of same composition with an exposed area of 0.785 cm2 was used.
The electrodes were polished with 1/0, 2/0, 3/0 and 4/0 grades of emery sheets and degreased with trichloro ethylene. The inhibitors were synthesized from ethylacetoacetate, ammonia
& benzaldehyde.
2.1 Preparation of 1,4-dihydropyridine by microwave activation method
- Microwave activation method was used to prepare the 1, 4- dihydropyridine derivatives using two different sol- vent systems.
(ⅰ) Solvent 1: Dry ethanol (ⅱ) Solvent 2: Water
The same procedure was followed for both the solvents
(i.e.,) the one-pot multi component reaction activated by microwaves. A mixture of ethylacetoacetate (0.05M) and benzaldehyde (0.025M) in 20ml of their respective sol- vents namely one in dry ethanol and the other in water were taken. Initially 4ml of 40% NH3 solution was added.
The reaction was carried out for 7 minutes at 750 W. At regular intervals 2ml of 40% NH3 solution was added thrice within seven minutes.
The dihydropyridine crystals obtained by both the methods were collected separately and washed with petroleum ether 2 to 3 times and dried. The dried samples were recrystallized from 70% ethanol. The percentage yields obtained by both the methods using different solvents were calculated. The same procedure was repeated with different aldehydes name- ly anisaldehyde, furfuraldehyde, 3,4,5- trimethox- ybenzaldehyde, 2-bromobenzaldehyde, veratraldehyde and 2-nitrobenzaldehyde. The compounds were characterized by IR spectra. The molecular formula of the compounds is giv- en in Table 1. For the preparation of Analar grade 1M H2SO4
and double distilled water was used.
2.2 Weight loss studies
The initial weight of the polished plate was taken. The 1M H2SO4 solutions was taken in a 200 ml beaker and the specimens were suspended in triplicates into the sol- ution using glass hooks. Care was taken to ensure the com- plete immersion of the specimen. After a period of 3 hours the specimens were removed, washed with running water, dried and weighed using chemical balance. From the initial and final masses of the specimen (ie., before and after immersion in the solution) the loss in weight was calculated.
The experiment was repeated for various inhibitor concen- trations in 1M H2SO4. A blank was carried out without inhibitor. The percentage IE at different concentrations of inhibitors was calculated from the weight loss. The method was repeated at higher temperature from 313 to 333K at a concentration of 10mM of inhibitors.
The IE, corrosion rate and surface coverage were calcu- lated from the weight loss results using the formula,
(Weight loss without inhibitor - Weight loss with inhibitor )
Efficiency of inhibitor 100
Weight loss without inhibitor
= ´
(2)
534 Weight loss in mgms Corrosion rate (mpy)
Density Area in sq. inch Time in hours
= ´
´ ´
(3)
(Weight loss without inhibitor - Weight loss with inhibitor) Surface coverage(θ)
Weight loss without inhibitor
=
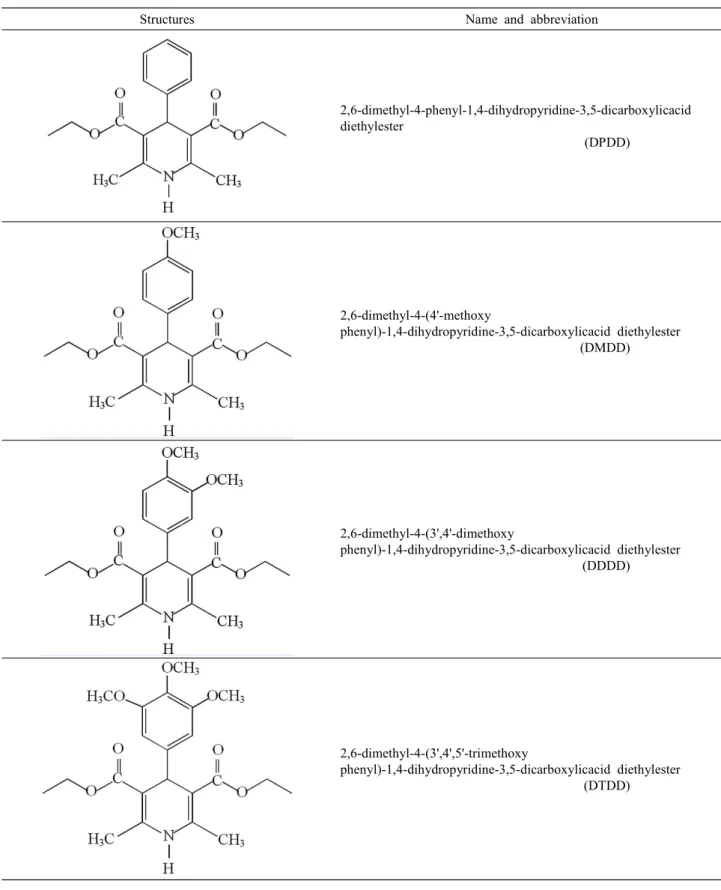
(4)Structures Name and abbreviation
2,6-dimethyl-4-phenyl-1,4-dihydropyridine-3,5-dicarboxylicacid diethylester
(DPDD)
2,6-dimethyl-4-(4'-methoxy
phenyl)-1,4-dihydropyridine-3,5-dicarboxylicacid diethylester (DMDD)
2,6-dimethyl-4-(3',4'-dimethoxy
phenyl)-1,4-dihydropyridine-3,5-dicarboxylicacid diethylester (DDDD)
2,6-dimethyl-4-(3',4',5'-trimethoxy
phenyl)-1,4-dihydropyridine-3,5-dicarboxylicacid diethylester (DTDD)
Table 1. Molecular Structure of the inhibitor
2,6-dimethyl-4-(2'-nitro
phenyl)-1,4-dihydropyridine-3,5-dicarboxylicacid diethylester (DNDD)
2,6-dimethyl-4-(2'-bromo phenyl)-1,4-dihydropyridine 3,5-dicarboxylicacid diethylester
(DBDD)
2,6-dimethyl-4-furfuryl-1,4-dihydropyridine 3,5-dicarboxylicacid diethylester
(DFDD)
2.3 Gasometry
Mild steel specimen of size 1cm x3cm x0.1cm were given fine mechanical polishing and degreased with trichloroethylene. The specimens were stored in a desi- ccator. The net area exposed was 0.35cm2 approximately.
The specimen was suspended from a hook on a glass stop- per and introduced into the gasometric cell containing 100ml of the acid. The temperature was maintained con- stant throughout the experiments at 303±1K (Thermos- tated) and at constant atmospheric pressure. Gas measure- ments were made for a period of an hour in all the cases.
Simultaneously a duplicate was also performed in all the cases to check the results. Experiments were repeated un- der identical conditions for inhibitor solutions of different concentration and the gas volume was measured for dura- tion of an hour.
Table 2. Inhibition efficiencies of various concentrations of the inhibitors for corrosion of mild steel in 1M H2SO4 obtained by weight loss and gasometric measurement at 30 ± 1 °C
Name of the inhibitor Concentration (mM) Weight loss method I.E (%)
Gasometric method I.E (%)
DPDD
0.25 0.5 2.5 5.0 7.5 10.0
37.1 37.6 79.2 88.3 88.4 89.2
38.4 40.9 72.7 86.3 87.3 91.2
DMDD
0.25 0.5 2.5 5.0 7.5 10.0
52.3 65.4 87.8 89.9 91.4 91.5
45.6 67.7 80.4 92.3 92.4 94.5
DDDD
0.25 0.5 2.5 5.0 7.5 10.0
65.4 86.2 97.1 98.4 98.9 99.5
60.4 78.3 90.7 97.5 98.0 98.6
DTDD
0.25 0.5 2.5 5.0 7.5 10.0
75.4 81.8 91.8 91.8 94.4 99.6
71.3 80.7 86.3 88.4 90.5 98.2
DNDD
0.25 0.5 2.5 5.0 7.5 10.0
34.3 40.6 55.7 56.7 59.0 97.6
30.3 44.6 56.7 58.4 60.5 80.9
DBDD
0.25 0.5 2.5 5.0 7.5 10.0
66.3 73.0 87.7 92.8 93.6 98.2
70.4 73.2 80.6 90.7 92.4 95.6
DFDD
0.25 0.5 2.5 5.0 7.5 10.0
72.1 85.4 85.9 95.2 95.7 99.1
69.4 80.3 84.8 92.2 94.6 98.7 From the volume of hydrogen gas liberated the in-
hibition efficiency was calculated using the formula
I.E(%) =
×
• VB and V1= the volume of hydrogen evolved in the
absence and presence of inhibitor.
2.4 Potentiodynamic polarization studies
Potentiodynamic polarization studies were carried out using Solartron model-1280B electrochemical unit. The potentiodynamic polarization curves were obtained from -200mV to +200mV (versus OCP) with a scan rate of
Table 3. Inhibition efficiencies of 10mM concentration of various inhibitors for corrosion of mild steel in 1M H2SO4 obtained by weight loss measurement at higher temperature
Name of the inhibitor IE (%)
303K 313K 323K 333K
DPDD DMDD DDDD DNDD DBDD DFDD
89.4 93.2 96.2 88.7 98.5 99.2
86.3 90.3 94.7 65.0 95.8 97.1
83.2 89.1 93.7 50.2 94.5 95.5
80.4 87.5 92.2 34.5 93.5 94.6
Table 4. Activation energies (Ea) and free energy of adsorption (DG°ads) for the corrosion of mild steel in 1M H2SO4 at 10mM concentration of the inhibitors
Name of the
inhibitor Ea (kJ) △G°ads at various temperatures (kJ)
303 K 313 K 323 K 333 K
Blank DPDD DMDD DDDD DNDD DBDD DFDD
33.51 43.08 52.65 57.44 52.65 62.23 86.16
- -9.69 -10.91 -12.47 -9.50 -14.84 -16.59
- -9.25 -10.25 -11.98 -6.07 -12.58 -13.59
- -8.89 -10.23 -11.86 -4.63 -12.22 -12.77
- -8.65 -10.14 -11.59 -2.97 -12.12 -12.68
1 mV/s. A platinum foil of surface area 2cm2 was used as the auxiliary electrode and a saturated calomel electrode as the reference electrode. Both anodic and cathodic polar- ization curves were recorded in the absence and presence of inhibitors.
2.5. Electrochemical Impedance spectroscopy (EIS):
EIS were made at corrosion potentials over a frequency range from 10 KHz to 1MHz with a superimposed sine wave of amplitude 10mV.The real Z¢ and imaginary Z² parts were measured at various frequencies. From the plot of Z¢ Vs Z², the charge transfer resistance (Rt) and double layer capacitance (Cdl) were calculated. EIS were carried out both in the presence and absence of inhibitors at se- lected concentrations. The IE was calculated using the fol- lowing equation
( )
*t t *t
IE % =R - R 100 R ´
(5)
Where, Rt and Rt*
are the charge transfer resistance obtained in the absence and presence of the inhibitors.
3. Results
3.1 Weight loss method
Table 2. shows the results of weight loss and gasometric measurements for mild steel in 1M H2SO4 at 303K both in the absence and presence of the inhibitors at various
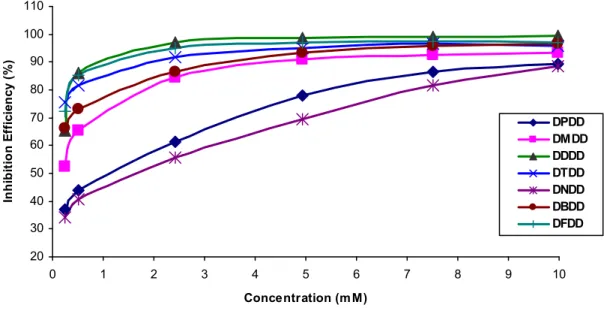
concentrations. Analysis of the data shows that the parent compound has minimum IE. The IE increases with in- crease in concentration is shown in Fig. 1. All the com- pounds exhibit I.E >89%.
Effect of temperature
The effect of temperature in the range 303 – 333 K on the IE for selected concentrations of the inhibitor is shown in Table 3. Arrhenius plots log corrosion rate Vs 1000/T (K) shown in Fig. 2 were used for the calculation of activation energies. Values of Ea for pure acid solution and in the presence of inhibitors are given in Table 4.
The values of Ea in the inhibited acid solution are appreci- ably greater than those obtained in the uninhibited solution. This suggests that the presence of reactive cen- tres on the inhibitor can block the active sites for corro- sion, resulting in an increase in activation energy.12) The free energy of adsorption DG°ads has been calculated from the equilibrium constant of adsorption using the equation
DG°ads = - RT ln (55.5k) (6)
Where,
C ( 1 θ )
k θ
= -
and q is the degree of surface coverage. The negative values of DG (Table 2.) show the interaction of inhibitor molecule and spontaneous adsorp- tion on the metal surface. But the values are less negative, which are indicative of physical adsorption of the in- hibitors on the metal surface.
20 30 40 50 60 70 80 90 100 110
0 1 2 3 4 5 6 7 8 9 10
Concentration (m M)
Inhibition Efficiency (%)
DPDD DMDD DDDD DTDD DNDD DBDD DFDD
Fig. 1. Plot of IE (%) Vs concentration (mM) for the inhibition of corrosion of mild steel in 1M H2SO4.
Fig. 2. Arrhenius plot of corrosion rate of mild steel in 1M H2SO4 solution in the absence and presence of inhibitors.
3.2 AC-impedance measurements
The corrosion behavior of mild steel in the absence and presence of inhibitor in 1M H2SO4 was also investigated by EIS method at 30 ± 1 °C after 10 minutes of immersion (Table 5.). The impedance diagrams obtained were perfect semi circles (Fig. 3-6.) indicating that a charge transfer
process mainly controls the corrosion of steel. The pres- ence of the inhibitors enhances the value of Rt in the acidic solution. Values of double layer capacitance (Cdl) were brought down to the maximum extent in the presence of the inhibitors. The decrease in Cdl may be due to the ad- sorption of the compounds on the metal surface leading to the formation of a film.
Table 5. AC-impedance parameters for corrosion of mild steel for selected concentrations of the inhibitors in 1M H2SO4
Name of the inhibitor Concentration (mM) Rt (ohm cm2) Cdl (μF/cm2) IE (%)
DPDD
Blank 0.5 5.0 10.0
13.85 47.96 62.58 66.50
35.07 33.55 30.85 27.95
- 71.1 77.9 79.2
DMDD
0.5 5.0 10.0
58.68 61.55 78.98
30.50 30.05 25.69
76.4 77.5 82.5
DBDD
0.5 5.0 10.0
61.88 66.88 77.01
33.25 32.86 31.74
77.6 79.3 82.0
DFDD
0.5 5.0 10.0
58.66 192.54 206.26
32.55 31.41 26.26
76.4 92.8 93.3
Fig. 3. Nyquist diagram for mild steel in 1M H2SO4 for selected concentrations of inhibitor (DPDD).
Fig. 4. Nyquist diagram for mild steel in 1M H2SO4 for selected concentrations of inhibitor (DMDD).
Fig. 5. Nyquist diagram for mild steel in 1M H2SO4 for selected concentrations of inhibitor (DBDD).
Fig. 6. Nyquist diagram for mild steel in 1M H2SO4 for selected concentrations of inhibitor (DFDD).
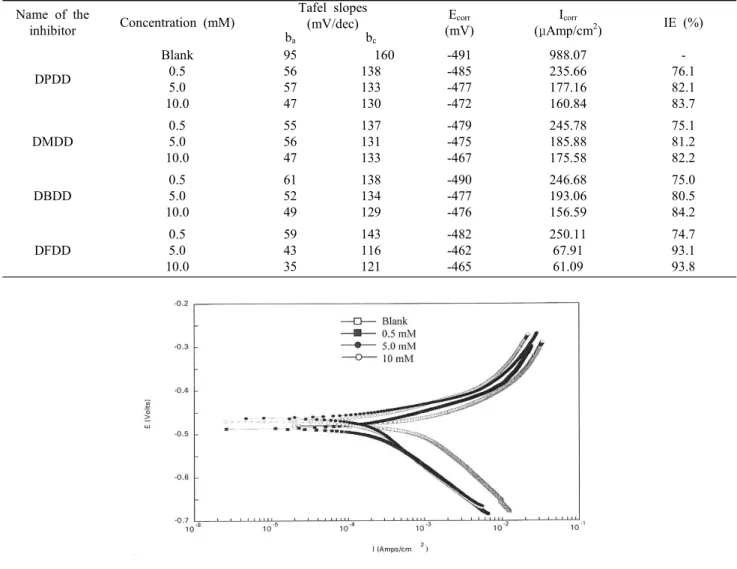
3.3 Polarization measurements
Anodic and cathodic polarization curves were obtained for mild steel in 1M H2SO4 with and without inhibitors at various concentrations are shown in Fig. 7-10. The val- ues of corrosion kinetic parameters such as Tafel slopes (ba, bc), corrosion potential (Ecorr), corrosion current den- sity (Icorr) obtained from the anodic and cathodic Tafel curves are represented in Table 6. It is evident from the table that Icorr decrease with increasing inhibitor concen- tration resulting in an increase in IE.
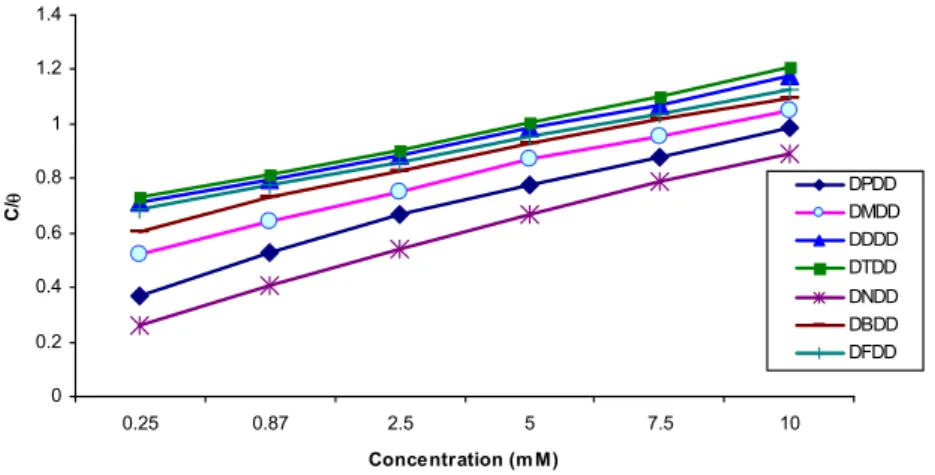
3.4 Adsorption isotherm
Adsorption is the primary step in all corrosion inhibition
processes. Organic compounds are mostly adsorption type inhibitors. The surface coverage values (q) for different concentrations of the inhibitors were calculated from weight loss studies. These values were graphically tested for fitting a suitable adsorption isotherm. The plot of C/q Vs C yields a straight line (Fig. 11.) for all the compounds, suggesting that the adsorption of the inhibitor in acid sol- ution obey Langmuir adsorption isotherm.
3.5 Synergistic Effect of Iodide ion
It has been reported that iodide ion is the most absorb- able of halide ions on steel.13) Therefore, addition of iodide ion to inhibitors enhances the IE. Hence an attempt was made to study the synergistic effect provided by the addi
Table 6. Corrosion parameters for corrosion of mild steel with selected concentrations of the inhibitors in 1M H2SO4 by potentiodynamic polarization method
Name of the
inhibitor Concentration (mM)
Tafel slopes
(mV/dec) Ecorr
(mV)
Icorr
(μAmp/cm2) IE (%)
ba bc
DPDD
Blank 0.5 5.0 10.0
95 56 57 47
160 138 133 130
-491 -485 -477 -472
988.07 235.66 177.16 160.84
- 76.1 82.1 83.7
DMDD
0.5 5.0 10.0
55 56 47
137 131 133
-479 -475 -467
245.78 185.88 175.58
75.1 81.2 82.2
DBDD
0.5 5.0 10.0
61 52 49
138 134 129
-490 -477 -476
246.68 193.06 156.59
75.0 80.5 84.2
DFDD
0.5 5.0 10.0
59 43 35
143 116 121
-482 -462 -465
250.11 67.91 61.09
74.7 93.1 93.8
Fig. 7. Polarization curves for mild steel recorded in 1M H2SO4 for selected concentrations of inhibitor (DPDD).
Fig. 8. Polarization curves for mild steel recorded in 1M H2SO4 for selected concentrations of inhibitor (DMDD).
Fig. 9 Polarization curves for mild steel recorded in 1M H2 SO4 for Selected concentrations of inhibitor (DBDD).
Fig. 10. Polarization curves for mild steel recorded in 1M H2 SO4 for selected concentrations of inhibitor (DFDD).
0 0.2 0.4 0.6 0.8 1 1.2 1.4
0.25 0.87 2.5 5 7.5 10
Concentration (m M)
C/q DPDD
DMDD DDDD DTDD DNDD DBDD DFDD
Fig. 11. Langmuir plot of inhibitors in 1M H2SO4.
Table 7. Synergistic effect of 1mM KCl / KBr / KI on the IE of DPDD, DMDD and DFDD by weight loss method at 30 ± 1 °C
Name of the
inhibitor Concentration (mM)
IE (%) Without KCl, KBr
and KI With 1mM KCl With 1mM KBr With 1mM KI
DPDD
0.25 0.50 0.75 1.00 1.50
39.6 42.6 75.9 81.5 90.3
83.1 90.1 90.5 91.9 92.4
89.2 91.6 92.2 94.0 97.1
91.5 91.8 95.4 96.6 98.0
DMDD
0.25 0.50 0.75 1.00 1.50
47.8 60.1 60.9 68.7 69.6
51.7 68.7 70.8 76.0 78.9
64.5 77.4 77.5 79.8 85.4
87.7 88.7 89.8 90.5 92.2
DFDD
0.25 0.50 0.75 1.00 1.50
77.4 90.9 91.8 92.5 94.3
92.0 92.6 93.1 93.5 94.8
95.3 96.5 96.8 97.7 97.9
96.4 97.2 97.4 97.7 98.0
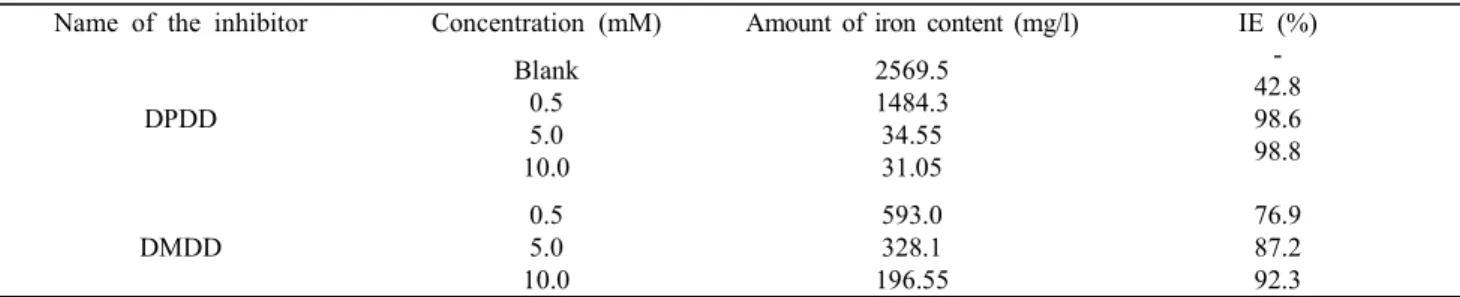
Table 8. Amount of dissolved iron present in the corrosive solution with and without inhibitors in 1M H2SO4 measured using atomic absorption spectroscopy
Name of the inhibitor Concentration (mM) Amount of iron content (mg/l) IE (%)
DPDD
Blank 0.5 5.0 10.0
2569.5 1484.3 34.55 31.05
- 42.8 98.6 98.8
DMDD
0.5 5.0 10.0
593.0 328.1 196.55
76.9 87.2 92.3
tion of halide ions, I–, Br– and Cl– to the solution contain- ing 1M H2SO4 and the synthesized compounds were stud- ied by weight loss method and the data are presented in Table 7. Analysis of the data revealed that the synergistic influence of halide ions follows the order, I– > Br– > Cl–. Since these compounds are highly active, only lower con- centrations were used for synergism study.
3.6 Atomic absorption spectrophotometric studies Percentage IE of the inhibitors (DPDD, DMDD) to- wards the dissolution of iron was calculated and the results are given in Table 8. The percentage IE obtained by this technique was found be in good agreement with that ob- tained from the conventional weight loss method.
3.7 Scanning electron microscopy
Surface of polished mild steel specimen immersed in 1M H2SO4 in the absence and presence of inhibitors were examined by scanning electron microscope (SEM). In the case of blank the corroded metal surface with edged grain
boundaries and corrosion products are clearly shown in Fig. 12 (a). But in the presence of inhibitors (DPDD, DMDD, DDDD), there is a formation of adsorbed layer of inhibitors on the metal surface without any corrosion product as seen in Fig. 12 (c-d). Only some original sur- face defects of the specimens are seen. Hence these in- hibitors have higher IE.
4. Discussion
The order of IE of the synthesized compounds at 0.25 mM concentration is
DNDD < DPDD < DMDD < DDDD ≈ DBDD <
DFDD < DTDD.
The compound DNDD has lowest IE at 0.25 mM in comparison to the IE values of all the inhibitors. IE of DNDD is even lower than that of the parent compound DPDD which may be attributed to the electron with-
(a) (b)
(c) (d)
Fig. 12. Scanning electron microscopy photographs in the absence and presence of inhibitors (a) Blank (b) DPDD (c) DMDD (d) DDDD.
drawing ability of the – NO2 group which reduces the electron density on the benzene ring and hence leads to lower adsorption on the mild steel surface. The compound DBDD has an IE of 66% at 0.25 mM concentration and 98.24% at 10mM concentration. The higher IE of this com- pound is due to mesomeric effect. In the case of the me- thoxy substituted derivatives DMDD, DDDD and DTDD, it is evident that IE increases with increase in the number of methoxy groups both at the lower and higher concen- trations. The above results are in accordance with Ita and Offiong,14) who have reported that as the number of elec- tron donating substituents on the benzene ring increases the inhibitive power in general increases. The above results also confirm the involvement of the benzene ring in the adsorption process.
Hackerman and Makrides,15) observed that for inhibit- ors of high molecular weight, a widely spread film is formed on the metal surface which prevents corrosion.
Thus the synthesized compounds, due to their high molec- ular weight form a functional blanket preventing the metal from coming into contact with the acid in the corrosive environment. The efficiency decreases with increasing
temperature for all the inhibitors. The fact that the in- hibitive effect persists at higher temperature (333K) in- dicates that the adsorption mechanism operates via the for- mation of a barrier film on the metal surface. However, the reduced efficiency on increasing the temperature may be due to desorption of the inhibitor from the metal sur- face, exposing the fresh metal surface for attack by acid .16) The synthesized compounds were found to be good inhibitor that is evident from their IE values. These com- pounds were able to adsorb on the metal surface through the nitrogen atom, \/
C=N
, \/C=O
and aromatic rings that can cause effective adsorption process leading to the formation of an insoluble protective surface film which suppresses the metal dissolution reaction.5. Conclusions
The conclusions arrived based on the investigations are
• The order of IE of the synthesized compounds at 0.25mM concentration is
DNDD < DPDD < DMDD < DDDD ≈ DBDD <
DFDD < DTDD.
• All investigated inhibitors are effective inhibitors for corrosion of mild steel in 1M H2SO4.
• The IE increases with increase in inhibitor concentration.
• The adsorption of inhibitors on the mild steel surface obey Langmuir adsorption isotherm.
• The IE decreases with rise in temperature.
• The activation energy (Ea) is higher for inhibited acids than for uninhibited acids showing the temperature de- pendence of IE.
• The less negative values of DG°ads with increase in tem- perature indicate the spontaneous adsorption of the in- hibitors on the metal surface.
• Electrochemical impedance spectroscopy experiments have shown that an increase in inhibitor concentration causes an increase in charge transfer resistance Rt and a decrease in Cdl value, owing to the increased thickness of the adsorbed layer and the decreased exposed area of steel.
• The Tafel slopes obtained from potentiodynamic polar- ization curves indicate that all the inhibitors behave as mixed type inhibitors but slightly anodic in nature.
• Addition of halide ions to the inhibitors shows an in- crease in IE.
• The IE obtained from atomic absorption spectrophoto- metric studies was found to be in good agreement with that obtained from the conventional weight loss method.
• SEM reveals the information of a smooth, dense pro- tective layer in presence of the inhibitors.
References
1. F. Bentiss, M. Lebrini and M. Lagrenee, Corros. Sci., 47, 2915 (2005).
2. M. A. Quraishi and S. Khan, J. Appl. Electrochem., 36, 539 (2006).
3. F. Bentiss, M. Lagrenee, M. Traisnel and J. C. Hornez, Corros. Sci., 41, 789 (1999).
4. A. Chetouani, B. Hammouti, T. Benhadda and M. Daoudi, Appl. Surf. Sci., 249, 375 (2005).
5. G. Schmitt, Brit. Corros. J., 19, 165 (1984).
6. H. L. Wang, H. B. Fan and J. S. Zheng, Mater. Chem.
Phy., 77, 655 (2003).
7. K. C. Emregul, A. A. Akay and O. Atakol, Mater. Chem.
Phys., 93, 325 (2005).
8. G. Kardas, Mater. Sci., 41, 337 (2005).
9. R. Solmaz, M. E. Mert, G. Kardas, B. Yazici and M. Erbil, Acta Physico-Chimica Sinica, 24, 1185 (2005).
10. T. Tebbji, B. Hammouti, H. Oudda, A. Ramdani and M.
Benkadour, Appl. Surf. Sci., 252, 1378 (2005).
11. A. Yildirim and M. Cetin, Corros. Sci., 50, 155 (2008).
12. M. S. Abdel – Aal and M. S. Morad, Brit. Corros. J., 36, 253 (2001).
13. E. E. Oguzie, Mater. Chem. Phys., 87, 212 (2004).
14. B. I. Ita and O. E. Offiong, Mater. Chem. Phys., 48, 164 (1997).
15. N. Hackerman and A. C. Makrides, Ind. Eng. Chem., 46, 523 (1954).
16. S. T. Keera, Brit. Corros. J., 36, 261 (2001).