Schiff Bases as Anticorrosive Additives for Mild Steel Corrosion in Acid Media
M.Abirami, S.Sasikala, S.Chitra, K.Parameswari, and A.Selvaraj1,†
Dept. of Chemistry, P.S.G.R.Krishnammal College for Women, Coimbatore, Tamilnadu, India.
1Dept of Chemistry, CBM College, Coimbatore, Tamilnadu, India.
The influence of Schiff bases on the corrosion inhibition of mild steel in 1 M H2SO4have been investigated by weight loss, gasometry, impedance and polarization techniques. The results obtained reveal that these compounds act as good inhibitors. The inhibition efficiency of Schiff bases increased with concentration and synergistically increased on addition of chromate, sulphate and halide ions. Potentiodynamic polarization measurements clearly reveal that the investigated inhibitors are of mixed type but they are more cathodic in nature. The adsorption of these compounds on mild steel surface for both the acids were found to obey Langmuir adsorption isotherm. The surface morphology was studied by SEM and UV reflectance spectra.
Keywords : corrosion inhibitor, isatin, schiff bases, synergistic inhibition, langmuir adsorption isotherm.
†Corresponding author: [email protected]
1. Introduction
The use of inhibitors is one of the most practical meth- ods for protection against corrosion, especially in acidic media.1) Acid solutions are generally used for the removal of rust and scale in several industrial processes. Inhibitors are generally used in the processes to control the metal dissolution. Organic inhibitors are widely used in various industries. Among them, heterocyclic compounds com- prise a potential class of inhibitors. There is a wide consid- eration in the literature regarding corrosion inhibition stud- ies by nitrogen containing heterocyclics.2)-9) The aim of the present work is to evaluate the inhibition efficiency of synthesized Schiff bases, containing nitrogen and oxy- gen heteroatoms as corrosion inhibitors for mild steel in 1 M H2SO4 by weight loss, gasometry and electrochemical methods.
1.1 Experimental methods
Mild steel strips containing C = 0.084 %, P = 0.025%, Mn = 0.369%, S = 0.027% and the remainder iron were used for the measurement of weight loss and gasometric studies. The strips were mechanically polished and de- greased with trichloroethylene before use. For electro- chemical methods, a cylindrical mild steel rod embedded in Teflon with an exposed area of 0.78 cm2 was used.
The electrode was polished using a sequence of emery
papers of different grades and then degreased with trich- loroethylene. All the chemicals used for the synthesis of the inhibitors were of analar grade.
1.2 Synthesis of the inhibitors
0.2 M of isatin in 50 ml ethanol and 0.1 M of diamine in 25 ml ethanol were mixed and refluxed on steam bath for about two hours and then concentrated in vacuum. The precipitated Schiff base was washed with ethanol and re- crystallised from chloroform.10)
Similarly, three Schiff bases were synthesized using differ- ent diamines like benzidine, 4,4'-diamino diphenyl ether and 4,4'-diaminodiphenyl sulphone(Table 1).
1.3 Weight loss method
Mild steel specimens of size 5 cm x 2.5 cm x 0.05 cm were used for weight loss method. The mild steel speci- mens were polished with emery papers of 1/0 to 4/0 grades
Table 1.
Structure of the compounds
Isatin (I)
Ethylenediamine-bis(isatin) (EnBI)
o-phenylenediamine-bis(isatin) (PDBI)
Benzidine-bis(isatin) (BBI)
4,4(-diaminodiphenylether-bis(isatin) (DPEBI)
4,4(-diaminodiphenylsulphone-bis(isatin) (DPSBI)
and degreased with trichloroethylene. The specimens were hanged into the experimental solution with the help of glass hooks. The experimental solutions (200 ml) con- tained 1 M H2SO4 and different concentrations of the inhibitors. The initial weights of the specimens were noted and were completely immersed into the experimental solu-
tion. After three hours the specimens were taken out, washed thoroughly with distilled water, dried completely and their final weights were noted. Inhibition efficiency (IE), corrosion rate and surface coverage (θ) were calcu- lated using the following equations.
(
0)
0
W W
Inhibition efficiency = x 100 W
−
Where, W0 and W are the weight losses in the absence and presence of inhibitors respectively.
534 x W Corrosion rate (mpy) =
A x T x D Where,
A is area of specimen (square inches) T is exposure of time (h)
D is density of specimen (g/cm3) W is weight loss (mgm)
(
W0 W)
Surface coverage ( )=
θ W−
The weight loss method was repeated at higher temper- atures from 313 to 333 K at a concentration of 5 mM of inhibitors.
1.4 Gasometric method
Polished and degreased mild steel specimens were sus- pended from the hook of the stopper and were introduced in to the cell containing 200 ml of 1 M H2SO4. The same procedure was repeated with 1 M H2SO4 containing vari- ous concentrations of the inhibitors. From the volume of hydrogen gas liberated, the inhibition efficiency was calcu- lated using the formula.
B I
B
V - V Inhibition efficiency (%) 100
= V ×
Where,
VB & VI are volume of H2 evolved in the absence and presence of inhibitors.
1.5 Electrochemical studies
1.5.1 Potentiodynamic polarization and impedance measure- ments
The cells assembly consisted of mild steel as working electrode, platinum as the counter electrode and a saturated calomel electrode (SCE) as the reference electrode. Elec- trochemical impedance spectral measurements and Tafel
polarization studies were conducted using an electroche- mical measurement unit (model 1280B Solartron). Both anodic and cathodic polarization curves were recorded in the absence and presence of inhibitors. Impedance meas- urements (EIS) were made at corrosion potentials over a frequency range of 10 KHz to 1 M Hz with a super im- posed sine wave of amplitude 10 mV. The real Z' and imaginary Z" parts were measured at various frequencies.
From the plot of Z' Vs Z" the charge transfer resistance (Rt) and the double layer capacitance (Cdl) were calculated.
Impedance measurements were carried out both in the ab- sence and presence of inhibitors at selected concentrations.
The inhibition efficiency was calculated using the follow- ing equation.
( )
*t * tt
R R
Inhibition efficiency % = x 100 R
−
Where, Rt and Rt* are the charge transfer resistance ob- tained in the absence and presence of the inhibitors.
After EIS measurements the polarization measurements were carried out at a potential range of -200 mV to +200 mV with respect to open circuit potential at a scan rate of 1 mV/sec.
corr(blank) corr(inh) corr(blank)
I - I
Inhibition efficiency (%) 100
= I ×
Where, Icorr(blank) and Icorr(inh) are the corrosion current in the absence and presence of inhibitors.
1.6 Atomic absorption spectrophotometric studies Atomic absorption spectrophotometer (model GBC 908, Australia) was used for estimating the amount of dissolved iron in the corrodent solution containing various concen- trations of the inhibitors in 1 M H2SO4 after exposing the mild steel specimen for three hours. From the amount of dissolved iron, the inhibition efficiency was calculated.
Inhibition efficiency (%) = B A 100 B
− ×
Where,
A and B are the amount of dissolved iron in the presence and absence of the inhibitors.
1.7 Synergistic effect
The synergistic effect was studied by the addition of 1 mM KI to the mild steel specimen immersed in 1 M H2SO4 containing various concentrations of the inhibitors for a duration of three hours. From the weight loss data
the corrosion rate and inhibition efficiency was calculated.
The same procedure was repeated by the addition of 1 mM KCl, 1 mM KBr, 1 mM K2CrO4 and 1 mM K2SO4. 1.8 Surface examination studies
Surface examination of mild steel specimens were made by using scanning electron microscope (SEM) in order to understand the surface morphology of the mild steel in 1 M H2SO4 in the presence and absence of inhibitors. The surface morphology was taken using JEOL scanning elec- tron microscope.
1.9 UV reflectance spectral studies
Reflectance studies support the formation of a film on the metal surface that inhibit the corrosion of mild steel in acidic solution in presence of organic compounds. UV visible NIR spectrophotometer in the range 200-700 nm at a normal incident angle of 90o was used. The UV re- flectance spectrum was recorded for the surface of pol- ished, corroded and corrosion inhibited mild steel speci- mens.
2. Results and discussion
2.1 Weight loss measurements
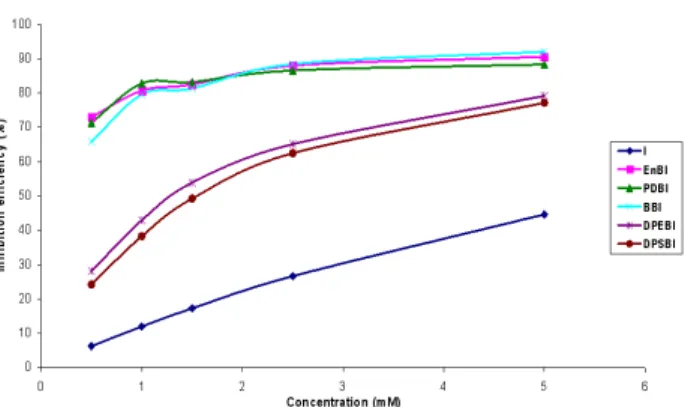
Table 2 shows the values of inhibition efficiency ob- tained from weight loss measurements for different con- centrations of the inhibitors in 1 M H2SO4. In all the Schiff bases the inhibition efficiencies were between 77-92% at 5 mM concentration of the inhibitor. Moreover, the in- hibition efficiency was found to increase with increase in inhibitor concentration. A plot of inhibition efficiency against various concentration of the inhibitors is shown in Fig. 1. The order of inhibition efficiency of the tested compounds is
BBI > EnBI > PDBI > DPEBI ≅ DPSBI > I
Fig. 1. Plot of inhibition efficiency(%) vs concentration(mM) for the inhibition of corrosion of mild steel in 1 M H2SO4
Table 2. Inhibition efficiencies of various concentration of the inhibitors for the corrosion of mild steel in 1 M H2SO4 obtained by weight loss measurement at 30±1℃
Name of the inhibitor
Inhibitor concentration (mM)
Weight loss (gms)
Inhibition efficiency (%)
Corrosion rate (mpy)
Degree of coverage (θ)
I
Blank 0.5890 - 8990.82 -
0.5 0.5853 6.28 8934.34 0.0628
1.0 0.5183 12.00 7911.62 0.1200
1.5 0.4872 17.28 7436.89 0.1728
2.5 0.4320 26.66 6594.29 0.2666
5.0 0.3260 44.65 4976.24 0.4465
EnBI
Blank 0.4578 - 6988.11 -
0.5 0.1237 72.98 1888.22 0.7298
1.0 0.0885 80.67 1350.91 0.8067
1.5 0.0801 82.50 1222.69 0.8250
2.5 0.0550 87.99 839.55 0.8799
5.0 0.0433 90.54 660.96 0.9054
PDBI
Blank 0.5324 - 8126.85 -
0.5 0.1523 71.39 2324.79 0.7139
1.0 0.0916 82.79 1398.23 0.8279
1.5 0.0893 83.23 1363.12 0.8323
2.5 0.0714 86.59 1089.89 0.8659
5.0 0.0622 88.32 949.46 0.8832
BBI
Blank 0.5324 - 8126.85 -
0.5 0.1817 65.87 2773.57 0.6587
1.0 0.1089 79.54 1662.31 0.7954
1.5 0.0994 81.33 1517.30 0.8133
2.5 0.0615 88.45 938.77 0.8845
5.0 0.0425 92.02 648.74 0.9202
DPEBI
Blank 0.5120 - 7815.45 -
0.5 0.3679 28.14 5615.83 0.2814
1.0 0.2920 42.97 4457.25 0.4297
1.5 0.2362 53.87 3605.49 0.5387
2.5 0.1787 65.10 2727.78 0.6510
5.0 0.1066 79.18 1627.20 0.7918
DPSBI
Blank 0.5120 - 7815.45 -
0.5 0.3877 24.28 5918.07 0.2428
1.0 0.3159 38.30 4822.07 0.3830
1.5 0.2599 49.24 3967.26 0.4924
2.5 0.1920 62.50 2930.79 0.6250
5.0 0.1169 77.17 1784.43 0.7717
The inhibition behaviour of Schiff bases can be ex- plained on the basis of the concept of adsorption of in- hibitors on the corroding metal surface. The mechanism of adsorption responsible for the corrosion inhibition for the set of aromatic Schiff bases employed in the present investigation can be derived as follows. The inhibitors con- tain two to four aromatic rings, two \/C=N - groups -NH group and two \ C = O/ groups. Hence they are expected to have adsorbed on the metal surface through the combi- nation of two adsorption mechanism.
1. Interaction of unshared electron pairs on the nitrogen atom (Fig. A)
Figure-A
2. Interaction of π-electrons of the aromatic ring and
\
/C=N - group with the metal surface (Fig. B)
Figure-B
The above interactions are facilitated by the flat ori- entation of the molecule with respect to the metal surface.
Both the mechanism must have contributed to the adsorp- tion of the dianils on the metal surface. The order of in- hibition efficiency of the tested compounds is BBI > EnBI > PDBI > DPEBI ≅ DPSBI > I The compound (I) has the lowest inhibition efficiency of 44% at 5 mM concentration in comparison to the other compounds. This may be due to the presence of one ben- zene ring, one \/N H and two \ C = O/ groups in comparison to 3-4 aromatic rings, -NH group two \/C=N - groups in the other compounds. Since the number of anchoring sites in isatin is less the extent to which it gets adsorbed on the metal surface is less and this accounts for its minimum inhibition efficiency. The maximum inhibition efficiency of BBI is due to the presence of more anchoring sites namely four benzene rings, two \/C=N - group, one -NH group and two \ C = O/ groups. 92% inhibition efficiency of BBI at 5 mM concentration is probably due to the flat orientation of the benzene rings on the mild steel surface providing it a greater degree of protection. On this basis, compounds DPEBI & DPSBI is also expected to have very high inhibition efficiency. But their inhibition efficiency values are only 79% and 77% respectively. The reason for the low inhibition efficiency of DPEBI and DPSBI in comparison to BBI was derived from the IR spectra of the corrosion product obtained by scrapping the film on the mild steel plate by a glass knife after immersion of the plates for 3 hrs in 1 M H2SO4 containing 5 mM DPEBI & DPSBI respectively. In the case of IR spectra of the corrosion product of DPEBI peaks at 3766.7 cm-1 and 3415.7 cm-1 characteristics of -OH stretching was observed. Similarly in the IR spectra of the corrosion prod- uct of DPSBI peaks at 2330 cm-1 & 2360 cm-1 character- istic of -OH stretching was observed. The appearance of these bands may probably be due to the reduction of C-O-C group to -C-OH in DPEBI and -SO2 - group to -SH in DPSBI by the hydrogen evolved at the surface
of the electrode. Hence it can be concluded that the lower absorbability of DPEBI & DPSBI may be due to their decomposition to -OH and -SH compounds which has a lesser tendency to adsorb on the metal surface.11),12) The dianil PDBI has slightly lower inhibition efficiency in comparison to BBI. This may be attributed to orientation of the benzene ring of the diamine. Probably this benzene ring does not act as an anchoring site for the adsorption process as it is expected to be oriented perpendicular to the adsorption plane, preventing flat orientation of the mol- ecule on the metal surface.13)
Grigorev et al.,14) and Pullevits15) have found that the increase of alkyl chain length has increased the absorb- ability of the inhibitor molecule. Hackerman et al.,16) have noted that inhibitors with increasing alkyl chain length form a widely spread film and thereby prevent corrosion better than those with lower molecular weight. Thus the fact that the compound EnBI has higher inhibition effi- ciency can be substantiated based on the above review.
2.2 Effect of temperature
The values of inhibition efficiency at 5 mM concen- tration of the inhibitors for the corrosion inhibition of mild steel in 1 M H2SO4 solution at different temperatures rang- ing from 303-333oK are given in Table 3. It can be seen that inhibition efficiency decreased with increase in temperature. Arrhenius plots (log corrosion rate Vs 1/T) shown in Fig. 3 were used for the calculation of activation energies. The values of Ea in the inhibited acid solutions are appreciably greater than those obtained in the unin- hibited acid solution. This suggests that presence of re- active centres on the inhibitors block the active sites for corrosion resulting in an increase in activation energy.
The free energy of adsorption (ΔGoads) at various tem- peratures was calculated using the relation.
ΔGoads = - RTln(55.5K)
and k is given by = C(1θ−θ)
Table 3. Inhibition efficiencies at 10 mM concentration of inhibitors for the corrosion of mild steel in 1 M H2SO4 obtained by weight loss measurements at higher temperatures
Name of the inhibitor
Inhibition efficiency (%)
303 oK 313 oK 323 oK 333 oK
I 44.63 35.86 34.34 27.84
EnBI 92.66 88.18 83.51 78.02
PDBI 89.45 85.45 81.86 74.19
BBI 85.63 78.68 71.64 57.06
DPEBI 68.67 59.24 46.67 30.21
DPSBI 80.13 71.24 65.08 53.92
Fig. 2. Langmuir plot of the inhibitors in 1 M H2SO4
Fig. 3. Arrhenius plot of corrosion rate of mild steel in 1 M H2SO4 solution in the absence and presence of inhibitors
Table 4. Activation energies (Ea) and free energy of adsorption (ΔGoads) for the corrosion of mild steel in 1 M H2SO4 at 5 mM concentration of the inhibitors
S.No Name of the
inhibitor Ea(kJ) ΔGoads at various temperatures (kJ) 303 k 313 k 323 k 333 k
1. Blank 26.11 - - - -
2. I 38.29 -5.52 -4.75 -4.72 -4.03
3. EnBI 60.92 -12.45 -11.49 -10.82 -10.17 4. PDBI 52.22 -11.45 -10.87 -10.51 -9.59 5. BBI 57.44 -10.56 -9.66 -8.95 -7.45 6. DPEBI 47.87 -8.074 -7.24 -6.11 -4.35 7. DPSBI 63.82 -9.56 -8.62 -8.14 -7.10
The values of Ea and ΔGoads are given in Table 4. The low and negative values of ΔGoads indicate the spontaneous adsorption of inhibitors on the surface of mild steel.17) 2.3 Nature of adsorption isotherm
Weight loss data were tested graphically for fitting a suitable isotherm. Plot of C/θ Vs C for all the compounds gave a straight line (Fig. 2) proving the fact that the ad- sorption of these compounds on the mild steel surface obeys Langmuir adsorption isotherm. The adsorption of
the inhibitors on the metal surface may be either phys- isorption or chemisorption. Though it is not possible to clearly identify the type of adsorption, which type of ad- sorption predominates over the other can be interpreted based on weight loss data at higher temperatures. From Table 4 it is clear that Ea for inhibited systems are higher than those of uninhibited system. According to Radovici18) for the inhibitors which involve in predominant phys- isorption, inhibition efficiency decreases with increase in temperature. Hence although the inhibitors taken for study can interact with mild steel surface through physisorption and chemisorption mechanism, it is the physisorption mechanism which predominates.
2.4 Gasometric method
Table 5 gives the values of inhibition efficiency ob- tained using the gasometric method for the volume of gas collected in the absence and presence of the inhibitors (I, EnBI and PDBI) at constant temperature of about 30±1℃
for the corrosion of mild steel in 1 M H2SO4. The volume of gas collected decreased with addition of inhibitors caus- ing the inhibition efficiency to increase with increase in the concentration of the inhibitor. There is a good agree- ment between the values of inhibition efficiency obtained from weight loss method and gasometric measurements.
2.5 Electrochemical studies
2.5.1 Potentiodynamic polarization and impedance measure- ments
2.5.1.1 AC-impedance measurements
The corrosion behaviour of mild steel in acidic solution in the presence and absence of the inhibitors was inves- tigated by EIS method at 30±1℃ after immersion for 10 minutes. The impedance diagrams obtained were perfect semi circles (Fig. 4). The charge transfer resistance, Rt
Table 5. Inhibition efficiencies for the selected concentrations of the inhibitors for the corrosion of mild steel in 1 M H2SO4
obtained by gasometric measurement S.No Name of
inhibitorthe
Inhibitor concentration
(mM)
Volume of gas
(cc)
Inhibition efficiency
(%)
1. I
Blank 26.8 -
0.5 24.6 8.21
1.5 21.2 20.96
5.0 15.8 41.04
2. EnBI
0.5 7.2 73.13
1.5 5.2 80.60
5.0 2.5 90.67
3. PDBI
0.5 7.4 72.39
1.5 4.8 82.09
5.0 2.8 89.55
Table 7. Corrosion parameters for mild steel with selected concentrations of the inhibitors in 1 M H2SO4 by potentiodynamic polarization method
S.No Name of the inhibitor
Inhibitor concentration (mM)
Tafel slopes (mg/dec)
Ecorr (mV) Icorr (μAmp/cm2) Inhibition efficiency (%)
ba bc
1. EnBI
Blank 154.90 190.20 -445.60 2700.00 -
0.5 139.60 149.00 -455.40 1340.00 50.37
1.5 132.40 150.20 -444.00 904.15 66.51
5.0 113.00 141.00 -463.37 625.18 76.84
2. PDBI
0.5 135.80 139.00 -448.60 805.49 70.17
1.5 122.60 153.50 -434.50 562.29 79.17
5.0 128.80 112.90 -479.40 418.88 84.49
3. BBI
0.5 129.60 149.00 -451.50 1070.00 60.37
1.5 129.10 144.00 -453.50 895.48 66.83
5.0 137.00 147.10 -447.10 816.97 69.74
4. DPEBI
0.5 123.00 151.00 -455.40 1170.00 56.67
1.5 135.00 143.00 -444.10 932.67 65.46
5.0 139.00 142.50 -448.70 858.46 68.21
0 2
5 5
0 7
5 -
50
- 25
0
Z' ohms
Blank 0.5 mM 1.5 mM 5.0 mM
Z″ ohms
Fig. 4. Nyquist diagram for mild steel in 1 M H2SO4 for selected concentrations of inhibitor (PDBI)
Table 6. AC-impedance parameters for mild steel for selected concentrations of the inhibitors in 1 M H2SO4
S.No Name of the inhibitor
Inhibitor concentration
(mM)
Rt
(ohmcm2) Cdl
(μF/cm2)
Inhibition efficiency
(%)
1. EnBI
Blank 6.5444 24.5260 -
0.5 14.4221 18.9440 54.62 1.5 46.9669 15.0390 86.07 5.0 138.1300 14.5570 95.26
2. PDBI 0.5 41.9263 21.5860 84.39
1.5 61.6375 20.8700 89.38 5.0 64.7650 19.9190 89.90
3. BBI
0.5 15.2258 16.5260 57.02 1.5 40.7366 13.6710 83.93 5.0 49.5400 10.4300 86.93
4. DPEBI
0.5 16.8667 22.6660 61.20 1.5 49.9173 21.3570 86.89 5.0 52.2536 18.2150 87.48
values were calculated from the difference in impedance at lower and higher frequencies as suggested by Tsuru and Haruyama.19) To obtain the double layer capaci- tance(Cdl) the frequency at which the imaginary compo- nent of the impedance is maximum (-Z" max) was found and Cdl values were obtained from the equation. The data are presented in Table 6.
F(-Z" max) =
dl t
1 2 C Rπ
The value of Rt increased with increase in the concen- trations of the inhibitor and this in turn leads to increase in inhibition efficiency. As impedance diagrams for sol- utions examined have almost a semicircular appearance, it indicates that the corrosion of steel is mainly controlled by a charge transfer process. The Cdl values decreases, proving the adsorption of Schiff bases on the metal surface leading to the formation of a film.20)
2.6 Polarization studies
Both anodic and cathodic polarization curves for mild steel in 1 M H2SO4 at selected concentration of the in- hibitors are shown in Fig. 5. Values of corrosion current density (Icorr), corrosion potential (Ecorr), tafel slopes (ba
and bc) and corrosion inhibition efficiency for selected concentrations of the inhibitors are presented in Table 7.
It is evident from the table that Icorr decreases with increas- ing inhibitor concentration resulting in an increase in in- hibition efficiency. The Tafel constants ba and bc are both affected but bc is affected to a greater extent (fig. 5). Hence it can be concluded that although all the inhibitors behave as mixed type inhibitors they are more cathodic in nature.
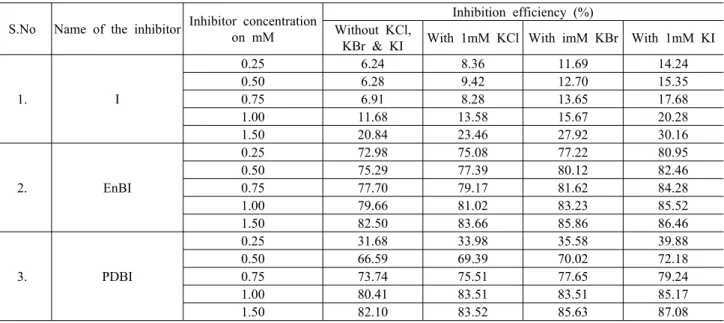
Table 9. Synergistic effect of 1 mM KCl / 1 mM / KBr / 1 mM KI on the inhibition efficiency of I, EnBI and PDBI by weight loss method at 30±1℃
S.No Name of the inhibitor Inhibitor concentration on mM
Inhibition efficiency (%) Without KCl,
KBr & KI With 1mM KCl With imM KBr With 1mM KI
1. I
0.25 6.24 8.36 11.69 14.24
0.50 6.28 9.42 12.70 15.35
0.75 6.91 8.28 13.65 17.68
1.00 11.68 13.58 15.67 20.28
1.50 20.84 23.46 27.92 30.16
2. EnBI
0.25 72.98 75.08 77.22 80.95
0.50 75.29 77.39 80.12 82.46
0.75 77.70 79.17 81.62 84.28
1.00 79.66 81.02 83.23 85.52
1.50 82.50 83.66 85.86 86.46
3. PDBI
0.25 31.68 33.98 35.58 39.88
0.50 66.59 69.39 70.02 72.18
0.75 73.74 75.51 77.65 79.24
1.00 80.41 83.51 83.51 85.17
1.50 82.10 83.52 85.63 87.08
E (Volts)
10-6 10-5 10-4 10-3 10-2 10-1
-0.7 -0.6 -0.5 -0.4 -0.3 -0.2
I (Am ps/cm2)
B lank 0.5 m M 1.5 m M 5.0 m M
Fig. 5. Polarization curves for mild steel recorded in 1 M H2SO4
for selected Concentrations of inhibitor (PDBI)
Table 8. Atomic Absorption Spectroscopy Amount of dissolved iron present in the corrosive solution with and without inhibitors in 1 M H2SO4
S.No Name of the inhibitor
Inhibitor concentration
(mM)
Amount of iron content
(mg/l)
Inhibition efficiency
(%)
1. EnBI
Blank 2569.5 -
0.5 677.6 73.63
5.0 511.5 80.09
2. DPEBI 0.5 1880.6 29.92
5.0 521.5 79.70
2.7 Atomic absorption spectrophotometric studies Percentage inhibition efficiency of the inhibitors (EnBI and DPEBI) towards the dissolution of iron was calculated and the results are given in Table 8. The percentage in-
hibition efficiency obtained by this technique was found be in good agreement with that obtained from the conven- tional weight loss method.
2.8 Synergism
The synergistic effect provided by the addition of halide ions, I-, Br- and Cl- to the solution containing 1 M H2SO4
and the synthesized compounds were studied by weight loss method and the data are presented in Table 9. Analysis of the data revealed that the synergistic influence of halide ions follows the order, I-> Br-> Cl-. This observed order suggests that I- has highest synergistic influence among the halide ions.19) This may be explained as follows:- The steel surface is originally positively charged in 1 M H2SO4. When I- ion are added to the inhibiting solution they are strongly chemisorbed by forming chemical bonds even leading to the formation of iron iodide. This strong chem- isorption of I- ions shift φn of the metal to more positive potential than in the case of Cl- and Br- and renders the surface more highly negatively charged. On the highly negatively charged metal surface, the protonated cationic inhibitor molecules are physisorbed due to electrostatic interaction. This interaction, will be higher for I- than for Cl- or Br- due to higher magnitude of negative charge on the metal surface. Hence the observed order is I-> Br->
Cl-.
The synergism provided by other anions namely chro- mate and sulphate was also studied by weight loss method by the addition of 1 mM potassium chromate and sulphate (Table 10). Chromate ions were found to exhibit higher synergism in comparison to sulphate ions.
Table 10. Synergistic effect of 1 mM K2CrO4 and 1 mM K2SO4 on the inhibition efficiency of inhibitors by weight loss method at 30±1℃
S.No Name of the inhibitor Inhibitor concentration (mM)
Inhibition efficiency (%) Without K2CrO4
& K2SO4 With 1mM K2CrO4 With 1mM K2SO4
1. I
0.25 6.24 23.90 12.12
0.50 6.28 24.36 12.76
0.75 6.91 26.46 14.52
1.00 11.68 33.54 29.94
1.50 20.24 54.82 36.18
2. EnBI
0.25 72.98 92.75 86.35
0.50 75.29 94.46 89.52
0.75 77.70 95.37 91.68
1.00 79.66 95.76 91.89
1.50 82.50 97.42 93.88
3. PDBI
0.25 31.68 61.62 55.76
0.50 66.59 86.19 70.82
0.75 73.74 86.24 74.92
1.00 80.41 89.71 82.18
1.50 82.10 93.56 84.84
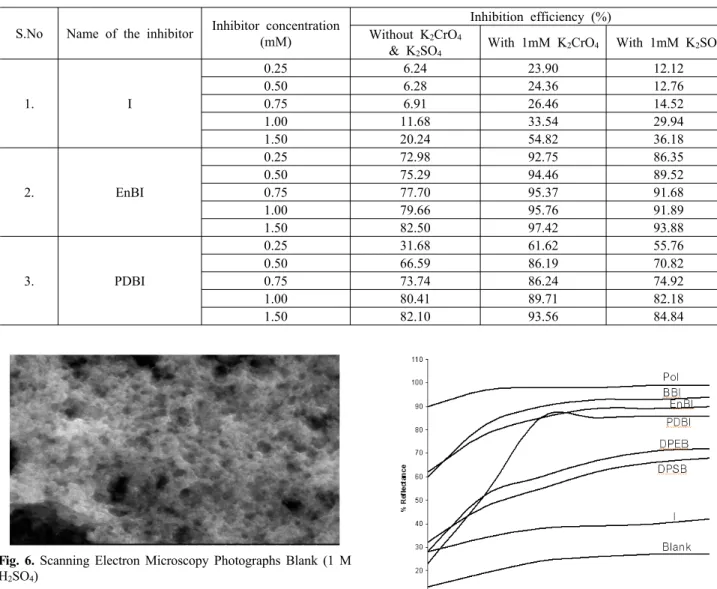
Fig. 6. Scanning Electron Microscopy Photographs Blank (1 M H2SO4)
Fig. 7. EnBI (5 mM)
3. SEM
The formation of an adsorbed protective film of the in- hibitor molecule on the mild steel surface is also confirmed by SEM studies. Figs. 6 and 7 shows the scanning electron
Fig. 8. UV reflectance curves for mild steel specimens under different conditions in 1 M H2SO4
micrographs of mild steel specimens exposed to 1 M H2SO4 and 1 M H2SO4 containing 5 mM concentration of EnBI, uniform corrosion can be observed in Fig. 7.
It can be seen in Fig. 7 that the metal surface is fully covered with the inhibitor molecules giving it a high de- gree of protection.
3.1 UV reflectance studies
The film formation on the metal surface was also sup- ported by reflectance studies for different specimens under similar conditions. Fig. 8 shows the reflectance curve for polished mild steel specimen, specimen dipped in 1 M
H2SO4 in the absence and presence of the inhibitors. It can be seen that the reflectance is maximum for the pol- ished specimen and it is brought down considerably in the case of specimens dipped in 1 M H2SO4. A close look at the Figs. reveals the fact that the performance of BBI is the best in this regard followed by EnBI, PDBI, DPEBI, DPSBI and I in the decreasing order.
4. Conclusions
1) Isatin has very low inhibition efficiency.
2) All investigated Schiff bases are effective inhibitors for corrosion of mild steel in 1 M H2SO4.
3) The inhibition efficiency increases with increase in inhibitor concentration.
4) The adsorption of these inhibitors follows Langmuir adsorption isotherm.
5) The effect of temperature indicates that the inhibition efficiency decreases with increasing temperature.
6) The activation energy (Ea) is higher for inhibited acids than for uninhibited acids showing the temperature dependence of inhibition efficiency.
7) The Tafel slopes obtained from potentiodynamic po- larization curves indicate that they are cathodic in nature.
References
1. G. Trabanelli, Corrosion, 47, 410 (1991).
2. S. L. Granese, B. M. Rosales, C. Oviedo, and J. O.
Zerbino, Corros. Sci, 33, 1439 (1992).
3. G. Subramaniam, K. Balasubramaniam, and P. Shridhar, Corros. Sci., 30, 1019 (1990).
4. S. N. Banerjee and S. Mishra, Corros., 45, 780 (1989).
5. S. Hettiarachi, Y. W. Chain, R. B. Wilson JR, and VS Agarwala, Corros., 45, 30 (1989).
6. C. R. Anderson and G. M. Schmidt, Corros. Sci., 24, 325 (1984).
7. E. Stupnisek-Lisac, M. Meticos-Hukovic, D. Lencic, J.
Vorkapic-Furac, and K. Berkovic, Corrosion, 48, 924 (1992).
8. E. Stupnisek-Lisac, K-Berkovic, and J. Vorakapic-Furac, Corros. Sci., 12, 1189 (1988).
9. S. N. Raicheva, B. V. Aleksiev, and E. J. Sokolov, Corros. Sci., 34, 343 (1993).
10. C. Parnau, A. Kriza, V. Pop, and S. Udrea, J. of Indian Chem. Soc., 82, 71 (2005).
11. V. S. Komkhadze and S. A. Balezin, Zh. Obshch. Khim, 22, 848 (1952).
12. G. P.Cicileo, B. M.Rosales, F. E. Vavela, and J. R.
Vilche, Corr. Sci., 41, 1359 (1999).
13. M. A. Quraishi, Mohd Qasim Ansare, Shamum Ahmad, and G. Venkatachari, Bull. Electrochem., 14, 342 (1998).
14. N. B. Grigorev and D. N. Machavariani, in "The double layer and adsorption on solid electrode (in Russian), Tartu, Es. SSR., 19, 61 (1968).
15. R. Ya. Pullevits, V. V. Pal'm, and V. E. Past in "Double layer and adsorption on solid electrodes (Russian) Tartu, Est. SSR, 19, 125 (1968).
16. N. Hackerman and A. C. Mackrides, Ind. Eng. Chem., 47, 1773 (1955).
17. G. K. Gomma and M. H. Wahdan, Indian J. Chem.
Technol., 2, 5 (1995).
18. Radovici. O, in Proceedings of the Second European Symposium on Corrosion Inhibitors, Ferrarr 178, (1964).
19. T. Tsuru, S. Haruyama, Boshoku Gijutsu, J. Japan Soc.
Corr. Eng., 27, 573 (1978).
20. S. Muralidharan, R. Chandrasekar, Proc. Indian Acad.
Sci., 112, 127 (2000).