Introduction
Imaging comprises a critical component of evaluation and treatment planning in dental implantology, oral and maxillofacial surgery, temporomandibular joint assess- ment, and orthodontics. The value of cone-beam comput-
ed tomographic(CBCT) imaging in these areas has been widely reported.1 All conventional two-dimensional(2D) imaging procedures suffer from inherent limitations such as magnification, distortion, and superimposition leading to the misrepresentation of anatomic structures. CBCT represents a paradigm shift from 2D to three-dimensional (3D) data acquisition and visualization.
The accuracy of measurements made using images is important in implant placement operations, not only for evaluating the bone morphology and quality but also for assessing the proximity to vital structures such as the in- ferior alveolar canal, the mental foramen, or the floor of
The accuracy of linear measurements of maxillary and mandibular edentulous sites in cone- beam computed tomography images with different fields of view and voxel sizes under simulated clinical conditions
Rumpa Ganguly1,*, Aruna Ramesh2, Sarah Pagni3
1Department of Diagnostic Sciences, Division of Oral and Maxillofacial Radiology, Tufts University School of Dental Medicine Boston, MA, USA
2Department of Diagnostic Sciences, Division of Oral and Maxillofacial Radiology, Tufts University School of Dental Medicine Boston, MA, USA
3Department of Public Health and Community Service, Tufts University School of Dental Medicine, Boston, MA, USA
AbsTrAcT
Purpose: The objective of this study was to investigate the effect of varying resolutions of cone-beam computed tomography images on the accuracy of linear measurements of edentulous areas in human cadaver heads. Intact cadaver heads were used to simulate a clinical situation.
Materials and Methods: Fiduciary markers were placed in the edentulous areas of 4 intact embalmed cadaver heads. The heads were scanned with two different CBCT units using a large field of view(13cm×16cm) and small field of view(5cm×8cm) at varying voxel sizes(0.3mm, 0.2mm, and 0.16mm). The ground truth was established with digital caliper measurements. The imaging measurements were then compared with caliper measurements to determine accuracy.
results: The Wilcoxon signed rank test revealed no statistically significant difference between the medians of the physical measurements obtained with calipers and the medians of the CBCT measurements. A comparison of accuracy among the different imaging protocols revealed no significant differences as determined by the Friedman test. The intraclass correlation coefficient was 0.961, indicating excellent reproducibility. Inter-observer variability was determined graphically with a Bland-Altman plot and by calculating the intraclass correlation coefficient. The Bland-Altman plot indicated very good reproducibility for smaller measurements but larger discrepancies with larger measurements.
conclusion: The CBCT-based linear measurements in the edentulous sites using different voxel sizes and FOVs are accurate compared with the direct caliper measurements of these sites. Higher resolution CBCT images with smaller voxel size did not result in greater accuracy of the linear measurements.(Imaging Sci Dent 2016; 46: 93-101) Key words: Cone-Beam Computed Tomography; Dental Implants; Cadaver; Imaging, Diagnostic
Copyright ⓒ 2016 by Korean Academy of Oral and Maxillofacial Radiology
This is an Open Access article distributed under the terms of the Creative Commons Attribution Non-Commercial License(http://creativecommons.org/licenses/by-nc/3.0) which permits unrestricted non-commercial use, distribution, and reproduction in any medium, provided the original work is properly cited.
Imaging Science in Dentistry·pISSN 2233-7822 eISSN 2233-7830
*The study was funded by 2013 Tufts University School of Dental Medicine/Nobel Biocare Research Grants.
Received December 24, 2015; Revised February 11, 2016; Accepted February 19, 2016
*Correspondence to : Prof. Rumpa Ganguly
Tufts University School of Dental Medicine, Oral and Maxillofacial Radiology, Depart- ment of Diagnostic Sciences, 1 Kneeland Street, DHS215, Boston, MA 02111, USA Tel) 1-617-636-6813, Fax) 1-617-636-3760, E-mail) [email protected]
the maxillary sinus. Many studies have evaluated the re- liability and accuracy of CBCT by comparing 3D data to physical measurements using dry human skulls, physical models, and mandibles immersed in solutions.2-6 These methods do not accurately reflect clinical scenarios due to the lack of soft tissue not only externally but also within the bone. Imaging dry skulls can lead to a high level of image contrast, making it easy to delineate structures and the boundaries of structures. Fewer studies of the mea- surement accuracy of CBCT have used cadaver segments with intact soft tissue coverings.7-11 The abovementioned studies evaluated the measurement accuracy of spiral computed tomography(CT)7 or compared the accuracy of spiral CT to CBCT.9 Patcas et al.12 assessed the accu- racy of CBCT at different resolutions in measuring the bony covering of the mandibular anterior teeth. Another factor that influences accuracy is the spatial resolution of the acquired CBCT volume. The voxel or the volume element is the smallest unit of CBCT images and its size has a direct influence on the spatial resolution of these images.1,13-15 Reducing the voxel size increases the spatial resolution of the images16 and arguably the accuracy of measurements in these images. The effect of voxel size on accuracy should be studied. Reducing the voxel size, however, leads to an increased dose of radiation, which is of particular concern in children. Hence, the benefits of acquiring high-resolution images must outweigh the risks associated with such procedures.
In the current study, the accuracy of measurement was compared among CBCT images acquired with different voxel sizes. The selected cadaver head specimens had in- tact soft tissue around and within the jaws and the normal anatomic relationship was maintained between the max- illa and mandible during imaging. The presence of intact soft tissue around the jaws not only reduces the inherent tissue contrast but also provides an additional source of scatter radiation, negatively impacting the accurate local- ization of various points on the images. This study design very closely simulated a clinical situation when CBCT imaging would be performed for implant treatment plan- ning in patients. The key differences between other stud- ies measuring accuracy in CBCT and the current study were the use of cadaver heads with intact soft tissue, the comparison of 2 different CBCT units using 2 different fields of view(FOVs) and varying voxel sizes, and the inclusion of maxillary and mandibular alveolar measure- ments to determine accuracy.
The objective of this study was to validate the accuracy of linear measurements of 2 different CBCT units under
simulated clinical conditions using cadaver heads, and to compare the impact of varying the voxel sizes and FOVs of the scan on the accuracy of the linear measurements.
The hypothesis tested was that no difference in accuracy would be found between the clinical and CBCT-based lin- ear measurements with varying FOVs and voxel sizes.
Materials and Methods
Study design
Four embalmed cadaver heads including the maxilla and mandible with associated intact soft tissue were used for this study. The cadaver heads were provided by the Department of Anatomy of the Tufts University School of Medicine. The heads were sectioned such that the maxil- lary and mandibular alveolar arches were preserved along with the surrounding soft tissue. The specimens were mounted on a base of dental stone in order to ensure that the vertical orientation of the specimen was consistent for all 3 CBCT imaging protocols and thereafter for sec- tioning of the specimens with a band saw. Subsequently, stainless steel fiduciary markers(Salem Specialty Ball Company Inc., Canton, CT, USA) were placed in the mandible and maxilla bilaterally along the buccal and lingual aspects of the alveolar ridges such that the buccal and lingual markers were in alignment. The markers were placed in the edentulous regions of the first and second molars and first and second premolars bilaterally in the mandible and maxilla. The markers selected for the study were 0.5mm in diameter, ensuring that they would be easily recognized in images due to their radiopacity, while their size was small enough to not be visible in more than one or two orthogonal slices. Three markers were placed on the buccal surface of the alveolar bone so that they were aligned and contiguous. A single marker was placed on the lingual surface of the alveolar bone so that it was in alignment with the most anterior buccal bead based on an assessment using the naked eye. The purpose of plac- ing three markers buccally was to ensure that at least one of the buccal markers was in alignment with the single lingual marker confirmed on imaging. The buccolingual plane of alignment established in such a manner was used to determine the plane of measurement for both CBCT and physical measurements.
Imaging system and protocol
The cadaver heads with the markers in place were im- aged using an iCAT apparatus(iCAT Classic, Imaging Sciences International, Hatfield, PA, USA) at full volume
(16×13cm, 20s) with 0.3-mm and 0.2-mm voxels and a Planmeca Promax 3D apparatus(Planmeca USA Inc., Roselle, IL, USA) using the limited FOV(5×8cm, 84kV, 14mA, 12s) at a 0.16mm voxel size. The images were re- constructed using the bundled Xoran CAT software(Xoran technologies LLC., Ann Arbor, MI, USA) and the Plan- meca Romexis software(Planmeca USA Inc., Roselle, IL, USA), respectively, and viewed on a computer monitor (Dell U2410, 23 inches, resolution 1920 ×1200; Dell, Round Rock, TX, USA) to check for the alignment of the markers in the cross-sectional slices. The buccal marker that was best aligned with the lingual marker in the cross- sectional slice was selected and noted on the specimen.
An indelible ink marker was used on the specimen to indicate the proposed slicing plane, which connected the lingual marker with the buccal marker, establishing prop- er alignment. In the CBCT images, the cross-sectional image that showed the lingual and the buccal marker in alignment and completely in focus was selected as the plane of measurement. On this cross-sectional image, horizontal tangents were drawn electronically using the measurement tool in iCAT and Planmeca Promax 3D re- spectively, with one touching the most superior point on the bone and another touching the most superior point of the superior cortex of the inferior alveolar nerve canal (IAN). Another line parallel and midway between these 2 lines was drawn. This protocol was applied to all of the selected premolar and molar sites in the maxilla and man- dible. The measurements were made by 2 observers(oral and maxillofacial radiologists), each of whom repeated measurements on 2 of the specimens. The accuracy of these radiographic measurements in the various regions of the maxilla and mandible was determined by comparison with caliper measurements on the cadaver segments at the same sites.
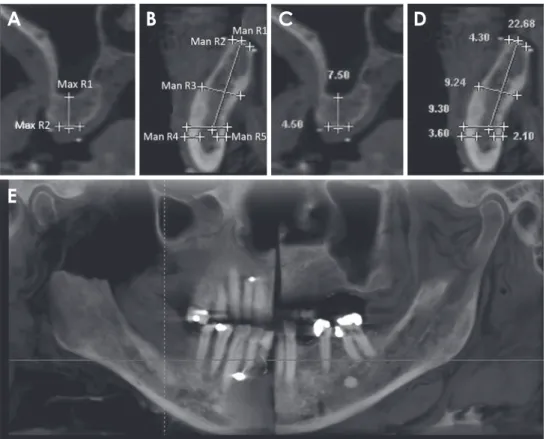
The mandibular measurement parameters included buc- colingual alveolar width at the alveolar crest, buccolingual alveolar width at the superior margin of the IAN, bucco- lingual width midway between the above two planes, the height of the alveolar ridge above the IAN, the distance between the buccal cortical plate to the buccal wall of the IAN, and the distance between the lingual cortical plate to the lingual wall of IAN. The maxillary measurement parameters included buccolingual alveolar width at the alveolar crest and the height of the alveolar ridge below the floor of the maxillary sinus. The measurements were made in the molar and premolar edentulous areas on the right and left sides. Figure 1 illustrates the measurement sites for the maxillary right molar and mandibular right
molar edentulous areas of one of the cadaver heads used for this study. The physical measurements were obtained using a digital caliper(Mitutoyo Corp., Kawasaki, Japan).
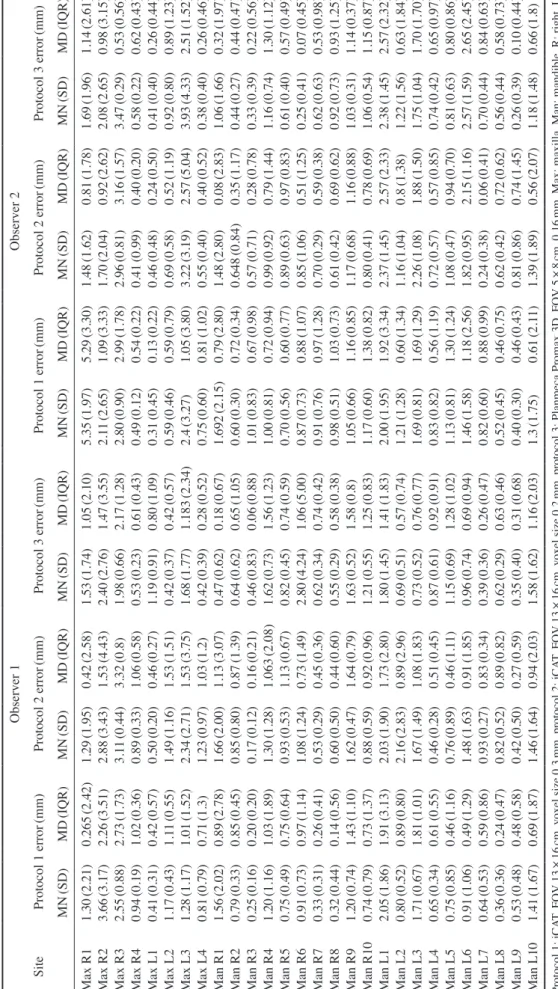
The measurement accuracy of the 3 CBCT imaging pro- tocols(voxel sizes of 0.3mm, 0.2mm, and 0.16mm, re- spectively) was compared with the physical measurements made with a digital caliper. The physical measurements were considered the gold standard and equivalent to actual clinical measurements. The descriptive statistics regarding the mean and median of the absolute differences between the physical measurements and measurements made in the CBCT images by observers 1 and 2 are presented in Table 1. In order to determine whether the accuracy of the mea- surements made by the three protocols was comparable to the physical measurements, the non-parametric Wilcoxon signed-rank test was performed, comparing the average physical measurement to the measurements made using each imaging modality.
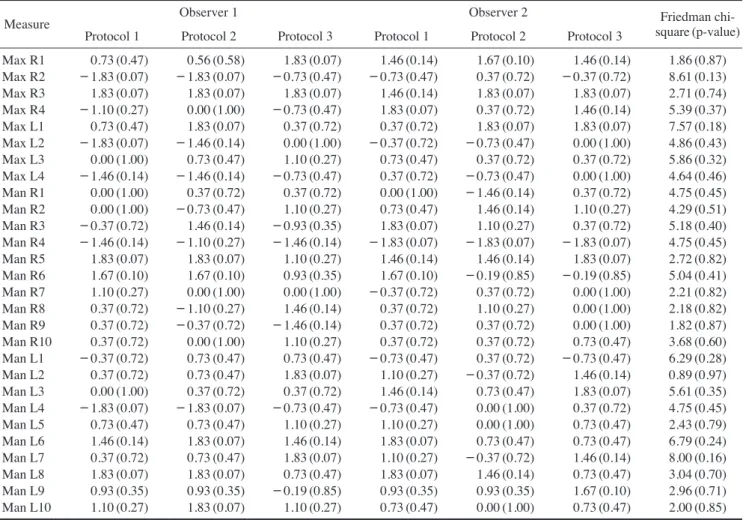
At the p<.05 level of significance, no statistically sig- nificant differences were found between the medians of the physical measurements(the ground truth/gold stan- dard) and the medians of any of the CBCT measurements made by either observer(Table 2).
results
Interobserver variability was determined graphically with a Bland-Altman plot and by calculating the intraclass correlation coefficient(ICC). The Bland-Altman plot com- paring measurement variability between both observers is presented in Figure 2. The Bland-Altman plot indicates that for smaller measurements, the observers exhibited very good reproducibility in their measurements. How- ever, as the measurements became larger, larger discrep- ancies emerged between the measurements made by the observers.
The ICC was calculated using a two-way mixed-effects model. The individual ICC was 0.961, which indicates excellent reproducibility according to the criteria outlined by Fleiss.17
Intraobserver variability was determined by calculating the ICC using a two-way mixed-effects model. The indi- vidual ICCs for observers 1 and 2 were 0.978 and 0.985, respectively, indicating excellent reproducibility.
In order to determine whether a difference was present in the accuracy among the 3 different protocols(voxel sizes of 0.3mm, 0.2mm, and 0.16mm, respectively), the abso- lute values of the differences between the physical mea- surements and the corresponding measurements for each
individual protocol were compared using the Friedman test(Table 2). No significant differences were found in the absolute values of the differences between the physi- cal measurements and measurements from any of the pro- tocols. All statistical analyses were performed using Stata version 13.1(StataCorp LP., College Station, TX, USA).
discussion
Diagnostic-quality images are vital for successful den- tal patient management, and implant placement is no ex- ception to this generalization. The American Academy of Oral and Maxillofacial Radiology recommends in its posi- tion statement that the available bone height, bone width, and saddle length of proposed implant sites should be as- sessed in order to determine the amount of bone available for implant fixture placement.18 The accuracy of these lin- ear measurements in cross-sectional CBCT images is of
paramount importance for avoiding anatomic structures such as the inferior alveolar nerve canal, mental foramen, the floor of the maxillary sinus, and the nasopalatine ca- nal during dental implant placement or ridge augmenta- tion procedures prior to dental implant placement.
The accuracy of linear measurements in CBCT images has been established in several published scientific stud-
ies.2-9,19 The clinician’s dilemma is complicated by the pre-
sence of an increasing number of CBCT units in the mar- ket, and the need to understand and select among several technical parameters. One clinically significant technical parameter is spatial resolution, which is defined by the size of the acquisition voxel.1,13-15 The smaller the voxel size, the higher the spatial resolution of images, allowing clinicians to visualize greater levels of detail. The idea of high-detail images may be appealing; however, caution must be exercised in weighing the benefits of high-reso- lution images for the clinical task at hand against the radi-
Fig. 1. Maxillary and mandibular measurement sites on the cone-beam computed tomography images. A. Max R1 is the height of the bone from the floor of the right maxillary sinus to the alveolar crest and Max R2 is the width of the bone at the alveolar crest at the right maxil- lary molar site. B. Man R1 is the height of the bone from the inferior alveo lar nerve(IAN) canal to the alveolar crest in the molar area of the right mandible. Man R2 is the buccolingual width of bone at the alveolar crest in the molar area of the right mandible. Man R3 is the bucco- lingual width of the bone midway between the alveolar crest and super ior cortex of the IAN in the molar area of the right mandible. Man R4 is the width of bone buccal to the IAN in the right mandibular molar area. Man R5 is the width of bone lingual to the IAN in the right man- dibular molar area. C. The measurements are made at the right maxil lary molar site. D. The measurements are made at the right mandi bular molar site. E. reconstructed panoramic image of the cadaver head with the reference lines shows the site of the right mandibular molar measurements.
A B C D
E
Table 1. Descriptive statistics of inter examiner measurement errors among the different imaging protocols SiteObserver 1Observer 2 Protocol 1 error(mm)Protocol 2 error(mm)Protocol 3 error(mm)Protocol 1 error(mm)Protocol 2 error(mm)Protocol 3 error(mm) MN(SD)MD(IQR)MN(SD)MD(IQR)MN(SD)MD(IQR)MN(SD)MD(IQR)MN(SD)MD(IQR)MN(SD)MD(IQR) Max R11.30(2.21)0.265(2.42)1.29(1.95)0.42(2.58)1.53(1.74)1.05(2.10)5.35(1.97)5.29(3.30)1.48(1.62)0.81(1.78)1.69(1.96)1.14(2.61) Max R23.66(3.17)2.26(3.51)2.88(3.43)1.53(4.43)2.40(2.76)1.47(3.55)2.11(2.65)1.09(3.33)1.70(2.04)0.92(2.62)2.08(2.65)0.98(3.15) Max R32.55(0.88)2.73(1.73)3.11(0.44)3.32(0.8)1.98(0.66)2.17(1.28)2.80(0.90)2.99(1.78)2.96(0.81)3.16(1.57)3.47(0.29)0.53(0.56) Max R40.94(0.19)1.02(0.36)0.89(0.33)1.06(0.58)0.53(0.23)0.61(0.43)0.49(0.12)0.54(0.22)0.41(0.99)0.40(0.20)0.58(0.22)0.62(0.43) Max L10.41(0.31)0.42(0.57)0.50(0.20)0.46(0.27)1.19(0.91)0.80(1.09)0.31(0.45)0.13(0.22)0.46(0.48)0.24(0.50)0.41(0.40)0.26(0.44) Max L21.17(0.43)1.11(0.55)1.49(1.16)1.53(1.51)0.42(0.37)0.42(0.57)0.59(0.46)0.59(0.79)0.69(0.58)0.52(1.19)0.92(0.80)0.89(1.23) Max L31.28(1.17)1.01(1.52)2.34(2.71)1.53(3.75)1.68(1.77)1.183(2.34)2.4(3.27)1.05(3.80)3.22(3.19)2.57(5.04)3.93(4.33)2.51(1.52) Max L40.81(0.79)0.71(1.3)1.23(0.97)1.03(1.2)0.42(0.39)0.28(0.52)0.75(0.60)0.81(1.02)0.55(0.40)0.40(0.52)0.38(0.40)0.26(0.46) Man R11.56(2.02)0.89(2.78)1.66(2.00)1.13(3.07)0.47(0.62)0.18(0.67)1.692(2.15)0.79(2.80)1.48(2.80)0.08(2.83)1.06(1.66)0.32(1.97) Man R20.79(0.33)0.85(0.45)0.85(0.80)0.87(1.39)0.64(0.62)0.65(1.05)0.60(0.30)0.72(0.34)0.648(0.84)0.35(1.17)0.44(0.27)0.44(0.47) Man R30.25(0.16)0.20(0.20)0.17(0.12)0.16(0.21)0.46(0.83)0.06(0.88)1.01(0.83)0.67(0.98)0.57(0.71)0.28(0.78)0.33(0.39)0.22(0.56) Man R41.20(1.16)1.03(1.89)1.30(1.28)1.063(2.08)1.62(0.73)1.56(1.23)1.00(0.81)0.72(0.94)0.99(0.92)0.79(1.44)1.16(0.74)1.30(1.12) Man R50.75(0.49)0.75(0.64)0.93(0.53)1.13(0.67)0.82(0.45)0.74(0.59)0.70(0.56)0.60(0.77)0.89(0.63)0.97(0.83)0.61(0.40)0.57(0.49) Man R60.91(0.73)0.97(1.14)1.08(1.24)0.73(1.49)2.80(4.24)1.06(5.00)0.87(0.73)0.88(1.07)0.85(1.06)0.51(1.25)0.25(0.41)0.07(0.45) Man R70.33(0.31)0.26(0.41)0.53(0.29)0.45(0.36)0.62(0.34)0.74(0.42)0.91(0.76)0.97(1.28)0.70(0.29)0.59(0.38)0.62(0.63)0.53(0.98) Man R80.32(0.44)0.14(0.56)0.60(0.50)0.44(0.60)0.55(0.29)0.58(0.38)0.98(0.51)1.03(0.73)0.61(0.42)0.69(0.62)0.92(0.73)0.93(1.25) Man R91.20(0.74)1.43(1.10)1.62(0.47)1.64(0.79)1.63(0.52)1.58(0.8)1.05(0.66)1.16(0.85)1.17(0.68)1.16(0.88)1.03(0.31)1.14(0.37) Man R100.74(0.79)0.73(1.37)0.88(0.59)0.92(0.96)1.21(0.55)1.25(0.83)1.17(0.60)1.38(0.82)0.80(0.41)0.78(0.69)1.06(0.54)1.15(0.87) Man L12.05(1.86)1.91(3.13)2.03(1.90)1.73(2.80)1.80(1.45)1.41(1.83)2.00(1.95)1.92(3.34)2.37(1.45)2.57(2.33)2.38(1.45)2.57(2.32) Man L20.80(0.52)0.89(0.80)2.16(2.83)0.89(2.96)0.69(0.51)0.57(0.74)1.21(1.28)0.60(1.34)1.16(1.04)0.8(1.38)1.22(1.56)0.63(1.84) Man L31.71(0.67)1.81(1.01)1.67(1.49)1.08(1.83)0.73(0.52)0.76(0.77)1.69(0.81)1.69(1.29)2.26(1.08)1.88(1.50)1.75(1.04)1.70(1.70) Man L40.65(0.34)0.61(0.55)0.46(0.28)0.51(0.45)0.87(0.61)0.92(0.91)0.83(0.82)0.56(1.19)0.72(0.57)0.57(0.85)0.74(0.42)0.65(0.97) Man L50.75(0.85)0.46(1.16)0.76(0.89)0.46(1.11)1.15(0.69)1.28(1.02)1.13(0.81)1.30(1.24)1.08(0.47)0.94(0.70)0.81(0.63)0.80(0.86) Man L60.91(1.06)0.49(1.29)1.48(1.63)0.91(1.85)0.96(0.74)0.69(0.94)1.46(1.58)1.18(2.56)1.82(0.95)2.15(1.16)2.57(1.59)2.65(2.45) Man L70.64(0.53)0.59(0.86)0.93(0.27)0.83(0.34)0.39(0.36)0.26(0.47)0.82(0.60)0.88(0.99)0.24(0.38)0.06(0.41)0.70(0.44)0.84(0.63) Man L80.36(0.36)0.24(0.47)0.82(0.52)0.89(0.82)0.62(0.29)0.63(0.46)0.52(0.45)0.46(0.75)0.62(0.42)0.72(0.62)0.56(0.44)0.58(0.73) Man L90.53(0.48)0.48(0.58)0.42(0.50)0.27(0.59)0.35(0.40)0.31(0.68)0.40(0.30)0.46(0.43)0.81(0.86)0.74(1.45)0.26(0.39)0.10(0.44) Man L101.41(1.67)0.69(1.87)1.46(1.64)0.94(2.03)1.58(1.62)1.16(2.03)1.3(1.75)0.61(2.11)1.39(1.89)0.56(2.07)1.18(1.48)0.66(1.8) Protocol 1: iCAT, FOV 13×16cm, voxel size 0.3mm, protocol 2: iCAT, FOV 13×16cm, voxel size 0.2mm, protocol 3: Planmeca Promax 3D, FOV 5×8cm, 0.16mm, Max: maxilla, Man: mandible, R: right, L: left, MN: mean, MD: median, SD: standard deviation
ation dose that patients are exposed to in order to acquire such high-resolution images. This is particularly true for children, who are more sensitive to the harmful effects of ionizing radiation. We must ask ourselves: do we always need high-resolution images just because they are at our
disposal? Another factor to consider is the FOV of images, which is controlled by the collimation of the X-ray beam and may have an effect on the resolution of images. A larger FOV may generate a larger number of scattered photons due to the larger volume of tissue that is irradiat- ed, which would reduce the resolution in comparison to a smaller FOV. The choice of FOV and voxel size should be made by clinicians based on the clinical task at hand, keeping in mind that their choices not only affect the diag- nostic quality of images but also the amount of radiation exposure that their patients receive. The purpose of this study was to investigate the possible effect of voxel size and FOV on the accuracy of linear measurements in CBCT images. Two CBCT machines were used in this study: an iCAT classic apparatus was utilized for the larger-FOV scans(16×13cm) at voxel sizes of 0.2 and 0.3mm(pro- tocols 1 and 2, respectively), while the Planmenca Promax 3D was used for the smaller-FOV scans(5×8cm) at a 0.16mm voxel size(protocol 3). Four cadaver heads were selected for the study, with edentulous sites in the molar and premolar areas of the maxilla, mandible, or both. The
Fig. 2. Bland-Altman plot comparing measurement variability be- tween both observers.
10
5
0
- 5
- 10
0 22.73
Table 2. Accuracy of the measurements of the three imaging protocols compared to the physical measurements
Measure Observer 1 Observer 2 Friedman chi-
square(p-value) Protocol 1 Protocol 2 Protocol 3 Protocol 1 Protocol 2 Protocol 3
Max R1 0.73(0.47) 0.56(0.58) 1.83(0.07) 1.46(0.14) 1.67(0.10) 1.46(0.14) 1.86(0.87) Max R2 -1.83(0.07) -1.83(0.07) -0.73(0.47) -0.73(0.47) 0.37(0.72) -0.37(0.72) 8.61(0.13) Max R3 1.83(0.07) 1.83(0.07) 1.83(0.07) 1.46(0.14) 1.83(0.07) 1.83(0.07) 2.71(0.74) Max R4 -1.10(0.27) 0.00(1.00) -0.73(0.47) 1.83(0.07) 0.37(0.72) 1.46(0.14) 5.39(0.37) Max L1 0.73(0.47) 1.83(0.07) 0.37(0.72) 0.37(0.72) 1.83(0.07) 1.83(0.07) 7.57(0.18) Max L2 -1.83(0.07) -1.46(0.14) 0.00(1.00) -0.37(0.72) -0.73(0.47) 0.00(1.00) 4.86(0.43) Max L3 0.00(1.00) 0.73(0.47) 1.10(0.27) 0.73(0.47) 0.37(0.72) 0.37(0.72) 5.86(0.32) Max L4 -1.46(0.14) -1.46(0.14) -0.73(0.47) 0.37(0.72) -0.73(0.47) 0.00(1.00) 4.64(0.46) Man R1 0.00(1.00) 0.37(0.72) 0.37(0.72) 0.00(1.00) -1.46(0.14) 0.37(0.72) 4.75(0.45) Man R2 0.00(1.00) -0.73(0.47) 1.10(0.27) 0.73(0.47) 1.46(0.14) 1.10(0.27) 4.29(0.51) Man R3 -0.37(0.72) 1.46(0.14) -0.93(0.35) 1.83(0.07) 1.10(0.27) 0.37(0.72) 5.18(0.40) Man R4 -1.46(0.14) -1.10(0.27) -1.46(0.14) -1.83(0.07) -1.83(0.07) -1.83(0.07) 4.75(0.45) Man R5 1.83(0.07) 1.83(0.07) 1.10(0.27) 1.46(0.14) 1.46(0.14) 1.83(0.07) 2.72(0.82) Man R6 1.67(0.10) 1.67(0.10) 0.93(0.35) 1.67(0.10) -0.19(0.85) -0.19(0.85) 5.04(0.41) Man R7 1.10(0.27) 0.00(1.00) 0.00(1.00) -0.37(0.72) 0.37(0.72) 0.00(1.00) 2.21(0.82) Man R8 0.37(0.72) -1.10(0.27) 1.46(0.14) 0.37(0.72) 1.10(0.27) 0.00(1.00) 2.18(0.82) Man R9 0.37(0.72) -0.37(0.72) -1.46(0.14) 0.37(0.72) 0.37(0.72) 0.00(1.00) 1.82(0.87) Man R10 0.37(0.72) 0.00(1.00) 1.10(0.27) 0.37(0.72) 0.37(0.72) 0.73(0.47) 3.68(0.60) Man L1 -0.37(0.72) 0.73(0.47) 0.73(0.47) -0.73(0.47) 0.37(0.72) -0.73(0.47) 6.29(0.28) Man L2 0.37(0.72) 0.73(0.47) 1.83(0.07) 1.10(0.27) -0.37(0.72) 1.46(0.14) 0.89(0.97) Man L3 0.00(1.00) 0.37(0.72) 0.37(0.72) 1.46(0.14) 0.73(0.47) 1.83(0.07) 5.61(0.35) Man L4 -1.83(0.07) -1.83(0.07) -0.73(0.47) -0.73(0.47) 0.00(1.00) 0.37(0.72) 4.75(0.45) Man L5 0.73(0.47) 0.73(0.47) 1.10(0.27) 1.10(0.27) 0.00(1.00) 0.73(0.47) 2.43(0.79) Man L6 1.46(0.14) 1.83(0.07) 1.46(0.14) 1.83(0.07) 0.73(0.47) 0.73(0.47) 6.79(0.24) Man L7 0.37(0.72) 0.73(0.47) 1.83(0.07) 1.10(0.27) -0.37(0.72) 1.46(0.14) 8.00(0.16) Man L8 1.83(0.07) 1.83(0.07) 0.73(0.47) 1.83(0.07) 1.46(0.14) 0.73(0.47) 3.04(0.70) Man L9 0.93(0.35) 0.93(0.35) -0.19(0.85) 0.93(0.35) 0.93(0.35) 1.67(0.10) 2.96(0.71) Man L10 1.10(0.27) 1.83(0.07) 1.10(0.27) 0.73(0.47) 0.00(1.00) 0.73(0.47) 2.00(0.85)
power was determined to be 89% using nQuery Advisor version 7.0(Statistical Solutions Ltd, Boston, MA, USA) to detect a significant difference at a value of p<0.05 be- tween the groups.
The normality of the data was first assessed graphically and then with the Shapiro-Wilk test. The Wilcoxon signed- rank test, which is a non-parametric test, was used since the assumption of normality was not met, as the underlying distribution of the data could not be assumed to have a normal distribution. The comparison between the medians of the physical measurements and the CBCT measure- ments in all 3 protocols made by both observers revealed no statistically significant differences between these sets of measurements. For measurements made from images to be considered accurate for the purposes of dental im- plant placement, the error should be less than 1mm.2,20,21 In the current study the mean absolute differences were 1.10±1.3mm, 1.2±1.5mm, and 1.1±1.4mm for proto- cols 1, 2, and 3 respectively. Waltrick et al.19 found mean absolute errors of 0.23±0.2mm between measurements of images and direct measurements. Torres et al.21 found mean differences of 0.68-0.72mm between values obtained from images with varying voxel sizes and measurements of the dry mandible. Stratemann et al.22 found mean ab- solute errors of 0.07±0.41mm and 0.00±0.22mm for various craniofacial distances when comparing direct and CBCT measurements of the distances between artificial landmarks created on the maxilla and the mandible. How- ever, all of the above studies used dry skulls in addition to radiopaque markers to aid in landmark identification.
This could potentially lead to increased contrast between the external surface of the bone and the surrounding air, making it easier to identify landmarks and thereby explain- ing the higher accuracy of measurements made using those the images. In our study, however, the effects of the em- balming fluid on tissues may have been at least partially responsible for the reduced accuracy of the measurements.
Better accuracy may be expected when imaging patients.
When the CBCT measurements(n=1008) were com- pared to the physical measurements, 40.08% were over- estimates, 57.74% were underestimates, and 2.18% were exactly the same as the physical measurements. These results are in alignment with those of previous studies by Damstra et al.16 and Waltrick et al.,19 who reported that image-based measurements were underestimates in 60.2%
and 60.7% of measurements, respectively. The underes- timates may have resulted from difficulties in identifying landmarks because the embalming fluid used in some of the cadaveric samples may have adversely affected the
contrast. Additionally, the contrast in the images may be have been dampened due to X-ray beam attenuation upon passage through bony and soft-tissue structures within the bone. Additionally, the maxilla and mandible were maintained in their original anatomic relationship, which may have contributed to difficulties in measuring some of the sites using calipers. This, however, reflects clini- cal settings more accurately than examining a segment of maxilla or mandible in isolation. The studies by Damstra et al.16 and Waltrick et al.19 utilized dry mandible spec- imens, which could have led to better contrast between landmarks, thereby facilitating identification and poten- tially leading to a higher level of accuracy of measure- ments made using the images. In our study, the specimens selected were human embalmed cadaver heads with intact soft tissue around and within the jaws in its original ana- tomic relationship. This scenario closely simulates a clin- ical situation wherein the soft tissue of a patient could po- tentially affect the accuracy of measurements and the ease of identification of landmarks within the bone and on its external surface.
In order to determine whether any of the measurements made using any of the 3 protocols(iCAT FOV 13×16 cm, voxel size 0.3mm; iCAT FOV 13×16cm, voxel size 0.2mm; Planmeca Promax 3D, FOV 5×8cm, voxel size 0.16mm) were more accurate than the others, absolute differences between measurements made using each pro- tocol and the corresponding physical measurements were calculated(Table 1). The non-parametric Friedman test was then employed to compare the 3 absolute differenc- es for a given measurement made with the 3 protocols.
The Friedman test is the non-parametric equivalent of the repeated-measures ANOVA. No statistically significant differences were found in the absolute values of the dif- ferences of the physical measurements and the measure- ments made using any of the CBCT protocols(Table 2).
This finding is in agreement with similar studies by Dam- stra et al.,16 Liedkte et al.,23 and Patcas et al.24 Damstra et al.16 investigated the accuracy of CBCT measurements of surface models made on dry mandibles using 0.4mm and 0.25mm voxels, respectively, and they concluded that a smaller voxel size did not result in greater accuracy of the surface model measurements. Liedkte et al.23 investigated simulated external root resorption imaged with 0.4mm, 0.3mm, and 0.2mm voxels, concluding that the results were the same with all 3 voxel sizes, although the diagno- sis was easier when using smaller voxel sizes.
Caution must be exercised in interpreting these results, since the diagnostic quality of images is influenced by the
voxel size. If the clinical task at hand necessitates high- er-resolution images for assessing fine changes, such as in case of some endodontic diagnoses, reducing the voxel size may be recommended.25-27 However in such cases, the FOV should be limited to the area of interest to ensure a compensatory reduction in the radiation dose, especially for children. In the current study, the FOV was reduced to 5×8cm from 16×13cm when the voxel size was re- duced to 0.16mm. This did not measurably alter the accu- racy of the measurements.
Intraobserver variability was determined by calculating the ICC using a two-way mixed-effects model. The two- way mixed effects model was used because 2 observers read each measurement. The individual ICCs for observ- ers 1 and 2 were 0.978 and 0.985 respectively, indicating excellent reproducibility.
The variability in measuring a particular site between the observers was determined both by a Bland-Altman plot and by calculating the ICC. The Bland-Altman plot(Fig. 2) visually assesses the agreement of 2 measurements or ob- servers, allowing one to compare the measurements and see if one is consistently higher. It also can determine whe- ther a difference in agreement is present for larger or small- er measurements. The Bland-Altman plot for our data indi- cated that for smaller measurements, the observers had very good reproducibility in their measurements. How ever, as the measurements became larger, larger discrepancies were found between the measurements. This may have been due to the fact that when the linear distance between two points is smaller, it is easier to maintain a straight line using software-based tools and less room is available for deviation. However, as the distance increases, precise- ly maintaining the same orientation of the measuring line is more difficult, and repeat measurements may therefore vary more.
In this study, the vertical and horizontal measurements made using CBCT images(iCAT and Planmeca Promax 3D) with 3 different protocols(iCAT, FOV 13×16cm, voxel size 0.3mm; iCAT, FOV 13×16cm, voxel size 0.2 mm; Planmeca Promax 3D, FOV 5×8cm, 0.16mm) were shown to be accurate when compared to physical measure- ments of the same sites performed with digital calipers.
None of the protocols used in this study were found to be more accurate than the others despite varying spatial resolutions. The objectives of this study did not include the assessment of diagnostic accuracy, the performance of the imaging software, or the resolution of the computer monitor. Future studies should be performed assessing the diagnostic accuracy of CBCT images using varying imag-
ing protocols.
The identification of bony landmarks on the external surface of the bone or within the bone and the overall ac- curacy of linear measurements between these landmarks were not affected by varying the FOV and voxel size(13
×16cm, voxel size 0.3mm; 13×16cm, voxel size 0.2 mm; 5×8cm, 0.16mm) in either of the CBCT machines used for this study. Based on our statistical evaluation of the CBCT-based and physical measurements, it can be concluded that all 3 imaging protocols using the iCAT and Planmeca Promax 3D units were reliable for linear mea- surements within the osseous structures in the presence of soft tissue. It can be reasonably concluded that a 0.3- mm voxel size is sufficient for the purpose of implant site assessment without exposing the patient to an additional radiation dose. If the clinical task at hand requires high- er-resolution images, then compensatory reduction of the FOV should be considered to reduce patients’ radiation exposure, particularly for children.
references
1. Scarfe WC, Farman AG, Sukovic P. Clinical applications of cone-beam computed tomography in dental practice. J Can Dent Assoc 2006; 72: 75-80.
2. Kobayashi K, Shimoda S, Nakagawa Y, Yamamoto A. Ac- curacy in measurement of distance using limited cone-beam computerized tomography. Int J Oral Maxillofac Implants 2004; 19: 228-31.
3. Lascala CA, Panella J, Marques MM. Analysis of the accura- cy of linear measurements obtained by cone beam computed tomography(CBCT-NewTom). Dentomaxillofac Radiol 2004;
33: 291-4.
4. Stratemann SA, Huang JC, Maki K, Miller AJ, Hatcher DC.
Comparison of cone beam computed tomography imaging with physical measures. Dentomaxillofac Radiol 2008; 37:
80-93.
5. Pinsky HM, Dyda S, Pinsky RW, Misch KA, Sarment DP. Ac- curacy of three-dimensional measurements using cone-beam CT. Dentomaxillofac Radiol 2006; 35: 410-6.
6. Leung CC, Palomo L, Griffith R, Hans MG. Accuracy and reliability of cone-beam computed tomography for measur- ing alveolar bone height and detecting bony dehiscences and fenestrations. Am J Orthod Dentofacial Orthop 2010; 137(4 Suppl): S109-19.
7. Cavalcanti MG, Ruprecht A, Vannier MW. 3D volume render- ing using multislice CT for dental implants. Dentomaxillofac Radiol 2002; 31: 218-23.
8. Ganguly R, Ruprecht A, Vincent S, Hellstein J, Timmons S, Qian F. Accuracy of linear measurement in the Galileos cone beam computed tomography under simulated clinical condi- tions. Dentomaxillofac Radiol 2011; 40: 299-305.
9. Patcas R, Markic G, Müller L, Ullrich O, Peltomäki T, Kel- lenberger CJ, et al. Accuracy of linear intraoral measurements
using cone beam CT and multidetector CT: a tale of two CTs.
Dentomaxillofac Radiol 2012; 41: 637-44.
10. Panmekiate S, Apinhasmit W, Petersson A. Effect of electric potential and current on mandibular linear measurements in cone beam CT. Dentomaxillofac Radiol 2012; 41: 578-82.
11. Kamburoğlu K, Kiliç C, Ozen T, Yüksel SP. Measurements of mandibular canal region obtained by cone-beam computed to- mography: a cadaveric study. Oral Surg Oral Med Oral Pathol Oral Radiol Endod 2009; 107: e34-42.
12. Patcas R, Müller L, Ullrich O, Peltomäki T. Accuracy of cone- beam computed tomography at different resolutions assessed on the bony covering of the mandibular anterior teeth. Am J Orthod Dentofacial Orthop 2012; 141: 41-50.
13. Patel S, Dawood A, Ford TP, Whaites E. The potential appli- cations of cone beam computed tomography in the manage- ment of endodontic problems. Int Endod J 2007; 40: 818-30.
14. Hatcher DC. Operational principles for cone-beam computed tomography. J Am Dent Assoc 2010; 141 Suppl 3: 3S-6S.
15. Watanabe H, Honda E, Tetsumura A, Kurabayashi T. A com- parative study for spatial resolution and subjective image char- acteristics of a multi-slice CT and a cone-beam CT for dental use. Eur J Radiol 2011; 77: 397-402.
16. Damstra J, Fourie Z, Huddleston Slater JJ, Ren Y. Accuracy of linear measurements from cone-beam computed tomography- derived surface models of different voxel sizes. Am J Orthod Dentofacial Orthop 2010; 137: 16.e1-6.
17. Fleiss JL. Reliability of measurement. In: Fleiss JL. The design and analysis of clinical experiments. New York: John Wiley and Sons; 1986. p. 1-32.
18. Tyndall DA, Price JB, Tetradis S, Ganz SD, Hildebolt C, Scarfe WC, et al. Position statement of the American Academy of Oral and Maxillofacial Radiology on selection criteria for the use of radiology in dental implantology with emphasis on cone beam computed tomography. Oral Surg Oral Med Oral Pathol Oral Radiol 2012; 113: 817-26.
19. Waltrick KB, Nunes de Abreu Junior MJ, Corrêa M, Zastrow MD, Dutra VD. Accuracy of linear measurements and visibil-
ity of the mandibular canal of cone-beam computed tomog- raphy images with different voxel sizes: an in vitro study. J Periodontol 2013; 84: 68-77.
20. Wyatt CC, Pharoah MJ. Imaging techniques and image inter- pretation for dental implant treatment. Int J Prosthodont 1998;
11: 442-52.
21. Torres MG, Campos PS, Segundo NP, Navarro M, Crusoe-Re- bello I. Accuracy of linear measurements in cone beam com- puted tomography with different voxel sizes. Implant Dent 2012; 21: 150-5.
22. Stratemann SA, Huang JC, Maki K, Miller AJ, Hatcher DC.
Comparison of cone beam computed tomography imaging with physical measures. Dentomaxillofac Radiol 2008; 37:
80-93.
23. Liedke GS, da Silveira HE, da Silveira HL, Dutra V, de Figue- iredo JA. Influence of voxel size in the diagnostic ability of cone beam tomography to evaluate simulated external root resorption. J Endod 2009; 35: 233-5.
24. Patcas R, Müller L, Ullrich O, Peltomäki T. Accuracy of cone- beam computed tomography at different resolutions assessed on the bony covering of the mandibular anterior teeth. Am J Orthod Dentofacial Orthop 2012;141: 41-50.
25. Kamburoğlu K, Kursun S. A comparison of the diagnostic ac- curacy of CBCT images of different voxel resolutions used to detect simulated small internal resorption cavities. Int Endod J 2010; 43: 798-807.
26. da Silveira PF, Vizzotto MB, Liedke GS, da Silveira HL, Mon- tagner F, da Silveira HE. Detection of vertical root fractures by conventional radiographic examination and cone beam computed tomography-an in vitro analysis. Dent Traumatol 2013; 29: 41-6.
27. Paes da Silva Ramos Fernandes LM, Rice D, Ordinola-Zapata R, Alvares Capelozza AL, Bramante CM, Jaramillo D, et al.
Detection of various anatomic patterns of root canals in man- dibular incisors using digital periapical radiography, 3 cone- beam computed tomographic scanners, and microcomputed tomographic imaging. J Endod 2014; 40: 42-5.