https://doi.org/10.5624/isd.2017.47.3.165
Introduction
Three-dimensional(3D) imaging in dentistry offers many advantages with respect to diagnosis and treatment planning. Cone-beam computed tomography(CBCT) is a method of acquiring 3D radiographic images that is be- coming increasingly popular in dentistry. The resulting images are user-friendly and provide much more informa- tion than conventional 2-dimensional radiographs.1
Cone-beam devices are capable of providing submil- limeter resolution in images of high diagnostic quality, with a short scanning time and radiation dosages up to
several times lower than those of conventional CT scans.2 The use of CBCT images has increased in many clinical applications, such as identifying and locating pathologic lesions, dental implants, temporomandibular joint imag- ing, orthodontic analysis, analyzing airway space, and the development of surgical guides. Such clinical applications require scans to have a sufficient geometric accuracy to achieve satisfactory results.
In terms of geometric accuracy, the currently available multidetector row computed tomography(MDCT) ma- chines are commonly accepted as a reference standard against which other devices are evaluated. In phantom studies on stereotactic localization using MDCT imaging data, the mean localization error has been reported to be between 0.11mm and 0.4mm.3,4 The measurement accu- racy of CBCT images has been studied on different ma-
Volumetric accuracy of cone-beam computed tomography
Cheol-Woo Park1, Jin-ho Kim1, Yu-Kyeong Seo1, Sae-Rom Lee1, Ju-Hee Kang1, Song-Hee Oh1, Gyu-Tae Kim1, Yong-Suk Choi1, Eui-Hwan Hwang1,*
1Department of Oral and Maxillofacial Radiology, Graduate School, Kyung Hee University, Seoul, Korea
ABSTRACT
Purpose: This study was performed to investigate the influence of object shape and distance from the center of the image on the volumetric accuracy of cone-beam computed tomography(CBCT) scans, according to different parameters of tube voltage and current.
Materials and Methods: Four geometric objects(cylinder, cube, pyramid, and hexagon) with predefined dimensions were fabricated. The objects consisted of Teflon-perfluoroalkoxy embedded in a hydrocolloid matrix(Dupli-Coe-Loid TM; GC America Inc., Alsip, IL, USA), encased in an acrylic resin cylinder assembly. An Alphard Vega Dental CT system(Asahi Roentgen Ind. Co., Ltd, Kyoto, Japan) was used to acquire CBCT images. OnDemand 3D(CyberMed Inc., Seoul, Korea) software was used for object segmentation and image analysis. The accuracy was expressed by the volume error(VE). The VE was calculated under 3 different exposure settings. The measured volumes of the objects were compared to the true volumes for statistical analysis.
Results: The mean VE ranged from -4.47% to 2.35%. There was no significant relationship between an object’s shape and the VE. A significant correlation was found between the distance of the object to the center of the image and the VE. Tube voltage affected the volume measurements and the VE, but tube current did not.
Conclusion: The evaluated CBCT device provided satisfactory volume measurements. To assess volume measurements, it might be sufficient to use serial scans with a high resolution, but a low dose. This information may provide useful guidance for assessing volume measurements.(Imaging Sci Dent 2017; 47: 165-74)
KEY WORDS: Cone-Beam Computed Tomography; Phantom; Imaging, Three-Dimensional
Copyright ⓒ 2017 by Korean Academy of Oral and Maxillofacial Radiology
This is an Open Access article distributed under the terms of the Creative Commons Attribution Non-Commercial License(http://creativecommons.org/licenses/by-nc/3.0) which permits unrestricted non-commercial use, distribution, and reproduction in any medium, provided the original work is properly cited.
Imaging Science in Dentistry·pISSN 2233-7822 eISSN 2233-7830 Received April 2, 2017; Revised May 16, 2017; Accepted June 1, 2017
*Correspondence to : Prof. Eui-Hwan Hwang
Department of Oral and Maxillofacial Radiology, Graduate School, Kyung Hee University, 23 Kyungheedae-ro, Dongdaemun-gu, Seoul 02447, Korea
Tel) 82-10-5231-7198, Fax) 82-2-965-1256, E-mail) hehan@khu.ac.kr
chines with varied results. Some authors found no statis- tically significant differences between CBCT images and the underlying anatomic topography,5,8 whereas others reported differences that were statistically significant but not considered clinically relevant.6-10 Those studies inves- tigated linear relationships to determine the accuracy of known points in space as determined by the intersection of geometric lines. It could be suspected that volumetric accuracy depends proportionally on linear accuracy and does therefore not require a separate evaluation. Never- theless, volume calculations for automatically, semi-au- tomatically, or manually segmented objects play an im- portant role in computer-assisted preoperative planning, follow-up, and image-guided surgical procedures.
Since specialized cone-beam devices for maxillofacial imaging represent a relatively new technology, few stud- ies have focused on the volumetric accuracy of CBCT im- aging. The purpose of this study was to investigate the in- fluence of various parameters, including the object shape, distance from the center of the image, tube voltage, and tube current, on the volumetric accuracy of CBCT scans.
Materials and Methods
Phantom construction
Four geometric objects(cylinder, pyramid, cube, and hexagon) with predefined dimensions were fabricated using a highly precise computer numerical-control mill- ing machine. The volumes ranged between 0.48mL and 1mL(Fig. 1). The known volumes of the objects served as reference values for further statistical evaluation. The objects consisted of Teflon-perfluoroalkoxy(PFA) em- bedded in a hydrocolloid matrix(Dupli-Coe-LoidTM, GC
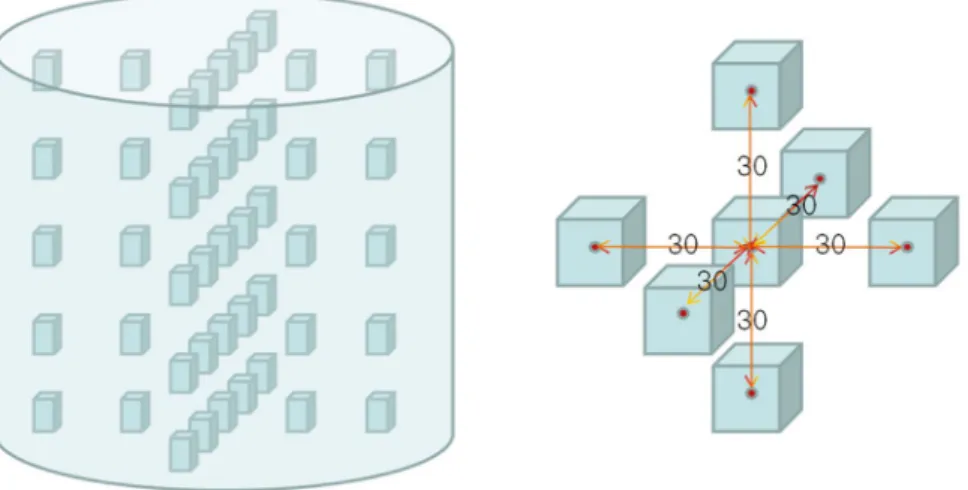
America Inc., Alsip, IL, USA), encased in a 150-mm di- ameter×150-mm height acrylic resin(polymethyl meth- acrylate) cylinder assembly(Fig. 2). The objects were positioned 0mm, 30mm, and 60mm from the center and aligned in a strictly symmetrical set of 5 rows and 5 col- umns with a distance of 30mm(Fig. 3).
Phantom computed CBCT scanning
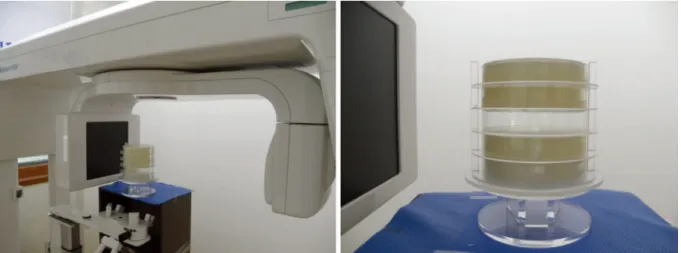
An Alphard Vega Dental CT system(Asahi Roentgen Ind. Co., Ltd, Kyoto, Japan) was used to acquire CBCT images(Fig. 4). In this device, the X-ray source revolves
Fig. 1. Four geometric objects with predefined dimensions made of Teflon-perfluoroalkoxy material were fabricated using a highly precise computer numerical-control milling machine. The volumes of the cylinder, pyramid, cube, and hexagon blocks ranged be- tween 0.48mL and 1mL.
Fig. 2. Four geometric reference objects were placed in the cylinder assembly and scanned in the cone-beam computed tomography device.
360 degrees around the phantom in 17 seconds(Table 1).
The field of view was cylindrical, with a diameter of 154 mm and a height of 154mm. Each of the 512 captured pro- jections was represented by a 512-×512-pixel matrix, with
Fig. 4. Axial cone-beam computed tomography images show the geometric objects, with cylinder, pyramid, cube, and hexagon shapes.
Fig. 3. The alignment of the objects in the polymethyl methacrylate cylinder. The center-to-center distances of the objects were 30mm.
pixels defined on a 12-bit gray scale(4096 gray scale).
The fixed field of view size was 15cm, resulting in a scan volume of 15cm×15cm×15cm. The reconstructed 3D volume consisted, therefore, of 512×512×512 isotropic voxels. The corresponding voxel sizes were 0.3mm×0.3 mm ×0.3mm. The imaging data were collected using 3 different exposure settings(5mA and 80kVp, 5mA and 100kVp, and 12mA and 80kVp). The phantom was placed in the machine in a reproducible method, with the center of the phantom in the center of the scout image.
Using the ADR software system(Asahi Roentgen Ind.
Co. Ltd., Kyoto, Japan), with which the standard Alphard-
Vega model was equipped, the level and width of the gray scale values of the image were adjusted in the histogram to enable optimal interpretation.
Segmentation and volume measurement
OnDemand 3D(CyberMed Inc., Seoul, Korea) software was used for object segmentation(Fig. 5). Segmentation was semi-automated with manual intervention. The opti- mal grayscale threshold(-5 HU to -48 HU, determined by OnDemand 3D software) found in the preliminary analysis was then applied to all 540 image data sets for the subsequent analysis. The volume of each of the 4 ob- jects scanned in 3 different image settings was calculated, acquiring a total of 180 measurements per image setting.
All measurements were performed by the same trained examiner and repeated at 2 separate time intervals. Ulti- mately, with 3 different exposure conditions and 4 differ- ently shaped objects, a total of 12 image sets were ana- lyzed.
Data and statistical analysis
To evaluate the measurement accuracy, the measured volumes of the objects were compared to the true vol-
Table 1. Cone-beam computed tomography scan protocol
Parameter Value
Tube current, tube voltage 5mA, 80kVp/5mA, 100kVp/12mA, 80kVp Shape of field of view Cylindrical
Size of field of view(mm) Ø 154×154(H)
Scan time 17 seconds
Voxel size 0.3mm×0.3mm×0.3mm
Slice thickness 0.3mm
Fig. 5. Segmented phantom. Three- dimensional segmentation allows measurement of the volume of each scanned object.
umes. The accuracy was expressed by the volume error (VE). The VE was calculated as:
estimated value-reference value VE=100×--- % reference value
The VE was calculated for all objects under 3 different exposure settings.
To determine the effect of the object’s position on the VE in the CBCT imaging data, the volumetric deviation of the 540 objects was correlated with the distance of the respective objects from the center of the imaging data set.
The significance of the relationship between the measure- ment error and distance was assessed using the Pearson correlation coefficient. P values <.05 were accepted as significant.
The effect of the object’s shape on volume estimation was tested using phantoms of a known volume. One-way analysis of variance(ANOVA) at P=.05 was used to de- termine whether there was a significant relationship be- tween the object’s shape and the volume measurements.
To evaluate the effects of tube current and tube voltage, the independent 2-sample t test was used. P values <.05 were accepted as significant. Descriptive statistics were calculated with standard spreadsheet software(Microsoft Excel; Microsoft Co., Redmond, WA, USA), and statis- tical analysis was performed using SPSS 12.0K for Win- dows(SPSS Inc., Chicago, IL, USA).
Results
The measured volumes and the VE values for the ob- jects are listed in Table 2. Overall, the average error in volume measurement ranged from -32.13% to 39.3%.
The minimum error(-32.13%) was obtained for the pyr- amid objects imaged with 5mA and 100kVp. The maxi- mum error(39.3%) was obtained for the hexagon objects imaged with 12mA and 80kVp. The average VE ranged from 4.47% to 2.35%.
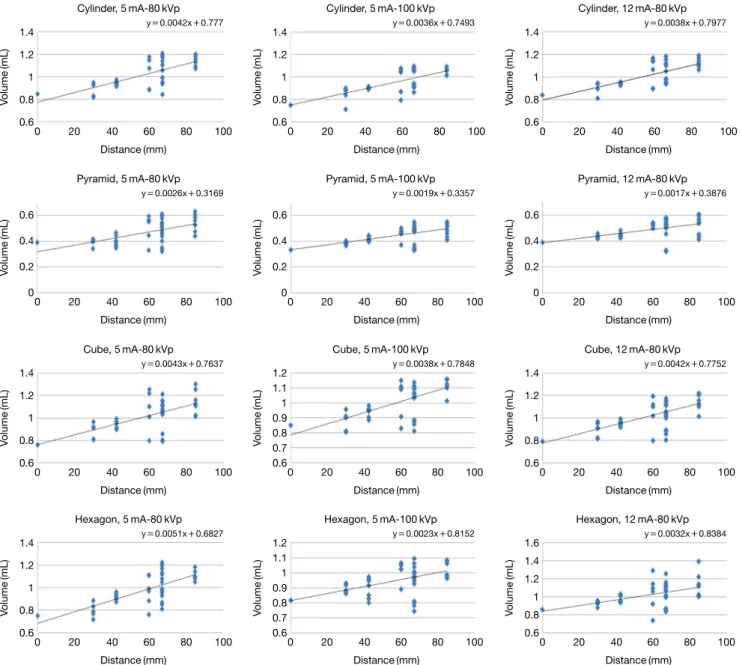
One-way ANOVA demonstrated no relationship be- tween the object’s shape and VE at any image setting (P>.05)(Table 2). After having run the imaging analysis, the positions of all 540 objects from CBCT imaging were listed. For all CBCT imaging data, the Pearson correlation analysis suggested that there was a significant(P<.05) correlation between the distance of objects to the center of the imaging data set and the volume measurements(Ta- ble 3, Fig. 6). As shown in Figure 6, all 12 combinations of volume measurements underestimated the volume in the center and overestimated it at the periphery.
Each object was scanned using 3 different exposure
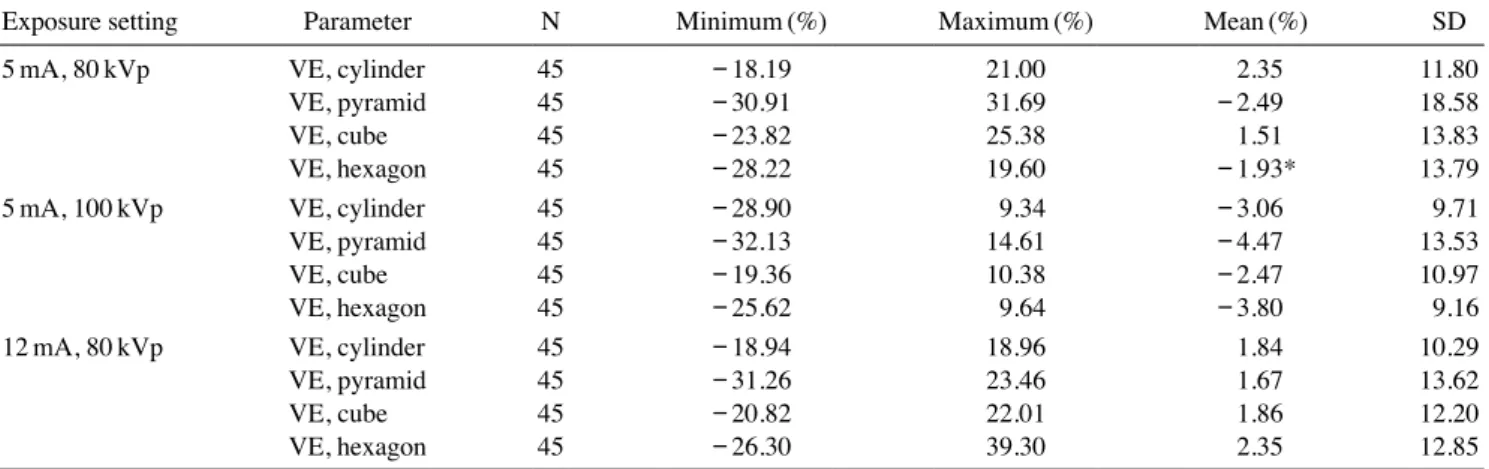
Table 2. Statistical parameters evaluating the accuracy of the volume measurements
Exposure setting Parameter N Minimum(%) Maximum(%) Mean(%) SD
5mA, 80kVp VE, cylinder 45 -18.19 21.00 2.35 11.80
VE, pyramid 45 -30.91 31.69 -2.49 18.58
VE, cube 45 -23.82 25.38 1.51 13.83
VE, hexagon 45 -28.22 19.60 -1.93* 13.79
5mA, 100kVp VE, cylinder 45 -28.90 9.34 -3.06 9.71
VE, pyramid 45 -32.13 14.61 -4.47 13.53
VE, cube 45 -19.36 10.38 -2.47 10.97
VE, hexagon 45 -25.62 9.64 -3.80 9.16
12mA, 80kVp VE, cylinder 45 -18.94 18.96 1.84 10.29
VE, pyramid 45 -31.26 23.46 1.67 13.62
VE, cube 45 -20.82 22.01 1.86 12.20
VE, hexagon 45 -26.30 39.30 2.35 12.85
VE: volume error, SD: standard deviation
Table 3. Correlations between the volume error(VE) and the dis- tance from the object to the center
Exposure
setting Parameter Pearson correlation coefficient
5mA, 80kVp VE, cylinder 0.697
VE, pyramid 0.565
VE, cube 0.606
VE, hexagon 0.721
5mA, 100kVp VE, cylinder 0.767
VE, pyramid 0.866
VE, cube 0.933
VE, hexagon 0.728
12mA, 80kVp VE, cylinder 0.899
VE, pyramid 0.722
VE, cube 0.858
VE, hexagon 0.952
conditions. Tube current did not significantly affect the volume measurements(P>.05)(Table 4), while tube volt- age did(P<.05)(Table 5).
Discussion
This study evaluated the effects of CBCT scanning pa- rameters on the accuracy of volumetric measurements.
Table 4. Mean volume error of volume measurements at various tube voltage settings
Tube voltage(kVp) Mean VE(%) SD
80 -0.14 14.9
100 -3.88 11.18
VE: volume error, SD: standard deviation
Table 5. Mean volume error of volume measurements at various tube current settings
Tube current(mA) Mean VE(%) SD
5 -0.14 14.9
12 1.93 11.33
VE: volume error, SD: standard deviation
Fig. 6. Correlation analysis of the volume measurements of cone-beam computed tomography(CBCT) imaging data. Each diamond(◆) indicates the volumetric deviation of a crossing(y-axis) and the distance of this crossing from the center of the CBCT imaging data(x-axis).
Cylinder, 5mA-80kVp
Cube, 5mA-80kVp
Hexagon, 5mA-80kVp Pyramid, 5mA-80kVp
Cylinder, 5mA-100kVp
Cube, 5mA-100kVp
Hexagon, 5mA-100kVp Pyramid, 5mA-100kVp
Cylinder, 12mA-80kVp
Cube, 12mA-80kVp
Hexagon, 12mA-80kVp Pyramid, 12mA-80kVp 0 20 40 60 80 100
0 20 40 60 80 100
0 20 40 60 80 100 0 20 40 60 80 100
0 20 40 60 80 100
0 20 40 60 80 100
0 20 40 60 80 100 0 20 40 60 80 100
0 20 40 60 80 100
0 20 40 60 80 100
0 20 40 60 80 100 0 20 40 60 80 100
Volume(mL)Volume(mL)Volume(mL)Volume(mL) Volume(mL)Volume(mL)Volume(mL)Volume(mL) Volume(mL)Volume(mL)Volume(mL)Volume(mL)
Distance(mm)
Distance(mm)
Distance(mm) Distance(mm)
Distance(mm)
Distance(mm)
Distance(mm) Distance(mm)
Distance(mm)
Distance(mm)
Distance(mm) Distance(mm) y=0.0042x+0.777
y=0.0043x+0.7637
y=0.0051x+0.6827 y=0.0026x+0.3169
y=0.0036x+0.7493
y=0.0038x+0.7848
y=0.0023x+0.8152 y=0.0019x+0.3357
y=0.0038x+0.7977
y=0.0042x+0.7752
y=0.0032x+0.8384 y=0.0017x+0.3876 1.4
1.2 1 0.8 0.6
1.4 1.2 1 0.8 0.6
1.4 1.2 1 0.8 0.6 0.6 0.4 0.2 0
1.4 1.2 1 0.8 0.6
1.2 1.1 1 0.9 0.8 0.7 0.6
1.2 1.1 1 0.9 0.8 0.7 0.6 0.6 0.4 0.2 0
1.4 1.2 1 0.8 0.6
1.4 1.2 1 0.8 0.6
1.6 1.4 1.2 1 0.8 0.6 0.6 0.4 0.2 0
Even though volumetric accuracy has been a major topic of discussion regarding conventional tomography and MDCT, few publications are available on this issue in CBCT.
Lascala et al.9 performed linear measurements on 13 distances between anatomical landmarks in dry human skulls scanned with the NewTom 9000 device(Quantita- tive Radiology, Verona, Italy). They concluded that the real distances measured on dry skulls were always larger than those obtained from the CBCT images. However, these differences were only significant for measurements taken between structures at the skull base, and not for other dentomaxillofacial structures. Marumulla et al.8 evaluated the geometric accuracy of the same CBCT scanner by using a grid phantom and a sophisticated mathematical test method. They determined that the mean error was 0.13mm (±0.09mm). Kobayashi et al.11 measured cross-sectional distances in cadaver mandibles and compared them to measurements obtained from CT scans. They reported a mean error of 0.22mm(±0.15mm) for CBCT scans and of 0.36mm(±0.24mm) for spiral CT scans. Although the errors were not large in either type of image, a statistically significant difference was found between the 2 methods, at P<.001. The mean absolute percentage errors were re- ported to be 1.4% for CBCT and 2.2% for spiral CT.
The effects of various CT parameters, such as window setting, slice thickness, segmentation threshold, field of view, peak voltage, and tube current, on volumetric ac- curacy have been previously documented.12-15 Different window width and level settings can also affect the mea- surement of the diameter. These factors affect the accu- racy of the measured volume, resulting in inconsistency and uncertainty in detecting volume changes in serial CT scans. Goo et al.16 stated that for the accurate mea- surement of lung nodule volume, it was critical to select a section thickness and segmentation threshold that was appropriate for the size of a nodule. Various research groups have investigated the effects of image acquisition parameters using sphere objects with known volumes. Ko et al.17 reported computer-calculated volumes obtained from regions of interest marked by a radiologist. Using a threshold method for segmentation, they found that tube current-time, reconstruction algorithm, and object size significantly affected volume error. Way et al.14 reported that there was no statistically significant difference in the volume error for CT scans taken with a technique where only pitch, field of view, or tube current(mA) changed, whereas slice thickness significantly(P<.05) affected volume error. Several authors have reported an inverse
correlation between measurement error and volume size.16,18,19 However, all those studies were performed on relatively small spherical phantoms for the purpose of lung nodule evaluation. The effects of volume size varia- tion on the measurement error of spherical objects cannot be automatically extrapolated to objects with a rectangu- lar geometry.
The present study evaluated the volumetric accuracy of a CBCT scanner and analyzed the influence of different parameters on the measurement errors of CBCT images under various exposure conditions. The volumetric ref- erence objects for measurements consisted of a homoge- neous radiopaque material providing high contrast to the surrounding hydrocolloid matrix. The reference objects were made by a precision computer numerical-control drilling mill machine and had sharp and regular edges.
Both properties allowed the 3-dimensional segmentation and volume calculation to be as accurate as possible. The choice of the material Teflon-PFA for the reference ob- jects, and hydrocolloid gel for the phantom matrix, was based on prior experiments exploring the visualization of different materials. The radiopacity of Teflon-PFA resem- bles that of cortical bone on CBCT scans, so the contrast between Teflon-PFA objects and gels is similar to that be- tween bone and soft tissue in vivo.
The segmentation process could affect the accuracy of volume measurements. Some authors reported that the volume errors associated with manual segmentation ranged from 150% to 350%. Image quality is the pre- dominant factor affecting segmentation. CBCT imaging quality can be related to machine settings, patient posi- tioning, management, volume reconstruction, and export to the Digital Imaging and Communications in Medicine format. There is no standard method of segmentation. Our segmentation procedures were largely based on image thresholding. The use of a global threshold value for the entire object has the advantage that only a single segmen- tation parameter is estimated. This is relatively simple and often used for bone segmentation, which commonly has a uniform density.20,21
Since the segmentation process of the reference objects and the volume measurements were semi-automatically carried out in ideal conditions, the variability among the measurements may be attributed to other factors.
Blake et al.22 reported a mean absolute percentage error for MDCT-based volumetric measurements of Plexiglas phantoms between 3% and 5%. The scans were performed at a 1.3-mm slice thickness, with a reconstruction inter- val of 0.6mm. Goo et al.16 estimated the mean absolute
percentage error for MDCT-based volumetric measure- ments of acrylic spheres to be 5.4% for an object with a volume of 1.07mL. The scans were performed at a 1-mm slice thickness, with a reconstruction interval between 0.5 and 2mm. These results are certainly within the tolerance limits of 5% to 10% for volumetric quality assurance test- ing in the high-precision disciplines of stereotactic radio- surgery and radiotherapy postulated by Ramaseshan and Heydarain.24 Disler et al.24 stated that volume estimations are likely to be clinically useful even with errors of up to 10%.In this study, the mean VE of -4.47 to 2.45% deter- mined for the evaluated CBCT device closely matched the values reported by Blake et al.23 and Goo et al.16 Thus, the evaluated CBCT machine had clinically accurate and acceptable volume measurements.
Previous studies of volumetric accuracy were performed on phantoms containing spheres to simulate tumors or le- sions, even though real anatomical forms are frequently non-spherical. In this study, 4 differently shaped objects were used to evaluate how the object’s shape influenced the volume measurement. The results were independent of the object’s shape. There was no statistically signifi- cant dependence of volume errors on the object’s shape for any image setting. According to previous CT studies, errors may be dependent on the object size. Future studies must evaluate more sizes and geometries, and their effects on volume measurements.
In this study, the VE of CBCT imaging was not evenly distributed. Volumes were underestimated in the center of images and overestimated at the periphery. Attention should be paid to the distortion of objects located at the periphery of the scan volume. These consist of arch- shaped or curved defects and blurring of object boundar- ies. Katsumata et al.25 attribute such artifacts, which af- fect mostly solid, regularly shaped objects, to the halation of the image intensifier. Presumably, halation artifacts may be considered as a possibility in all CBCT systems equipped with an image intensifier/charge-coupled de- vice detector unit. Object distortions at the periphery of the scan volume were observed in images generated by the device used in this study as well. Since this artifact appeared only when the area to be imaged was positioned near the facial surface, halation artifacts must be taken into consideration at the temporomandibular joint and the anterior dental arch.
Overestimation is also caused by partial volume aver- aging. The volume error for small objects is especially sensitive to uncertainties in the segmented boundary, as
a slight deviation due to the partial volume effect and re- construction artifacts such as a blurry or irregular edge would result in a substantial percentage error. When the slice thickness is large, the blurred boundary due to par- tial volume averaging contributes to extra slices for the object.
Furthermore, even in CBCT scans obtained under ideal imaging conditions, the acquired images contain statisti- cal variations in the X-ray photons recorded at the detec- tor and other uncertainties of the CBCT scanner. For exam- ple, the starting scan position of the CBCT scanner is not perfectly reproducible. The slice locations relative to the anatomical structures are therefore not identical in repeated scans even if the phantom is not repositioned. This has to be taken into consideration when using CBCT for volume measurements.
The volumetric software used in this study showed good overall performance, allowing the segmentation and volume measurements of all phantom objects. This study analyzed the effect of tube voltage and tube current on the accuracy of volumetric measurements. Our results indicated that there was no statistically significant depen- dence of volume errors on tube current, but we observed a significant dependence on tube voltage. We think that the reason for this result is that image noise may increase with decreased tube voltage. The increased noise and presence of more artifacts makes segmentation of the ob- ject from the surrounding structures more difficult, caus- ing images to be more distorted. The area affected by arti- facts was larger in images made using 100kVp than with 80kVp.
Therefore, volumetric errors were influenced by tube voltage, but were independent of tube current. For as- sessments of volume measurements, it may be sufficient to use serial scans with a high resolution but a low dose.
Further studies are needed to clarify the optimal exposure conditions for observing objects in a clinical setting.
There were limitations in this study. First, this study used simple and similarly-sized geometries to evaluate general trends, but it would be useful to investigate more sizes and irregular geometries, since most anatomic struc- tures vary in size and geometry. Second, it is not known whether the dependence of volumetric errors on imaging and reconstruction parameters is consistent for CBCT scans acquired with scanners from different manufacturers with different 3D analysis software. Third, it is also not known whether the trends observed in this phantom study would also be seen in real patients. Fourth, for a fuller evaluation of the effects of CBCT parameters on the VE,
it would be necessary to make more measurements with a precisely machined phantom using a wider range of test materials. The custom phantom used in this study was not as dimensionally accurate as desired. These and other issues should be investigated in future studies.
In conclusion, we found that the evaluated CBCT de- vice provided satisfactory volume measurements. Our goal was to evaluate the effects of CT scanning and re- construction parameters on accuracy. Although the VE values estimated using phantom objects may be different from those of real anatomic structures, this study present- ed trends illustrating the dependence of VE on CBCT im- aging conditions.
The results obtained from the experiment are as fol- lows. The mean VE ranged from -4.47% to 2.35%.
There was no relationship between objects’ shape and the VE. There was a significant correlation between the distance of the object to the center and the VE. The tube voltage affected the volume measurements, but the tube current had no effect. This information may provide use- ful guidance for assessing volume measurements.
References
1. Palomo L, Palomo JM. Cone beam CT for diagnosis and treat- ment planning in trauma cases. Dent Clin North Am 2009; 53:
717-27.
2. Scarfe WC, Farman AG, Sukovic P. Clinical applications of cone-beam computed tomography in dental practice. J Can Dent Assoc 2006; 72: 75-80.
3. Landi A, Marina R, DeGrandi C, Crespi A, Montanari G, Sganzerla EP, et al. Accuracy of stereotactic localization with magnetic resonance compared to CT scan: experimental find- ings. Acta Neurochir(Wien) 2001; 143: 593-601.
4. Karger CP, Hipp P, Henze M, Echner G, Hoss A, Schad L, et al. Stereotactic imaging for radiotherapy: accuracy of CT, MRI, PET and SPECT. Phys Med Biol 2003; 48: 211-21.
5. Hilgers ML, Scarfe WC, Scheetz JP, Farman AG. Accuracy of linear temporomandibular joint measurements with cone beam computed tomography and digital cephalometric radiography.
Am J Orthod Dentofacial Orthop 2005; 128: 803-11.
6. Yamamoto K, Ueno K, Seo K, Shinohara D. Development of dento-maxillofacial cone beam X-ray computed tomography system. Orthod Craniofac Res 2003; 6 Suppl 1: 160-2.
7. Mozzo P, Procacci C, Tacconi A, Martini PT, Andreis IA. A new volumetric CT machine for dental imaging based on the cone-beam technique: preliminary results. Eur Radiol 1998; 8:
1558-64.
8. Marmulla R, Wörtche R, Mühling J, Hassfeld S. Geometric accuracy of the NewTom 9000 cone beam CT. Dentomaxillo- fac Radiol 2005; 34: 28-31.
9. Lascala CA, Panella J, Marques MM. Analysis of the accura- cy of linear measurements obtained by cone beam computed
tomography(CBCT-NewTom). Dentomaxillofac Radiol 2004;
33: 291-4.
10. Pinsky HM, Dyda S, Pinsky RW, Misch KA, Sarment DP. Ac- curacy of three-dimensional measurements using cone-beam CT. Dentomaxillofac Radiol 2006; 35: 410-6.
11. Kobayashi K, Shimoda S, Nakagawa Y, Yamamoto A. Accura- cy in measurement of distance using limited cone-beam com- puterized tomography. Int J Oral Maxillofac Implants 2004;
19: 228-31.
12. Larici AR, Storto ML, Torge M, Mereu M, Molinari F, Maggi F, et al. Automated volumetry of pulmonary nodules on multi- detector CT: influence of slice thickness, reconstruction algo- rithm and tube current. Preliminary results. Radiol Med 2008;
113: 29-42.
13. Ravenel JG, Leue WM, Nietert PJ, Miller JV, Taylor KK, Sil- vestri GA. Pulmonary nodule volume: effect of reconstruction parameters on automated measurements - a phantom study.
Radiology 2008; 247: 400-8.
14. Way TW, Chan HP, Goodsitt MM, Sahiner B, Hadjiiski LM, Zhou C, et al. Effect of CT scanning parameters on volumetric measurements of pulmonary nodules by 3D active contour segmentation: a phantom study. Phys Med Biol 2008; 53:
1295-312.
15. Van Hoe L, Haven F, Bellon E, Baert AL, Bosmans H, Feron M, et al. Factors influencing the accuracy of volume measure- ments in spiral CT: a phantom study. J Comput Assist Tomogr 1997; 21: 332-8.
16. Goo JM, Tongdee T, Tongdee R, Yeo K, Hildebolt CF, Bae KT. Volumetric measurement of synthetic lung nodules with multi-detector row CT: effect of various image reconstruction parameters and segmentation thresholds on measurement ac- curacy. Radiology 2005; 235: 850-6.
17. Ko JP, Rusinek H, Jacobs EL. Babb JS, Betke M, McGuinness G, et al. Small pulmonary nodules: volume measurement at chest CT - phantom study. Radiology 2003; 223: 864-70.
18. Winer-Muram HT, Jennings SG, Meyer CA, Liang Y, Aisen AM, Tarver RD, et al. Effect of varying CT section width on volumetric measurement of lung tumors and application of compensatory equations. Radiology 2003; 229: 184-94.
19. Kostis WJ, Yankelevitz DF, Reeves AP, Fluture SC, Henschke CI. Small pulmonary nodules: reproducibility of three-di- mensional volumetric measurement and estimation of time to follow-up CT. Radiology 2004; 231: 446-52.
20. Loubele M, Maes F, Schutyser F, Marchal G, Jacobs R, Suet- ens P. Assessment of bone segmentation quality of cone-beam CT versus multislice spiral CT: a pilot study. Oral Surg Oral Med Oral Pathol Oral Radiol Endod 2006; 102: 225-34.
21. Shi H, Scarfe WC, Farman AG. Three-dimensional recon- struction of individual cervical vertebrae from cone-beam computed-tomography images. Am J Orthod Dentofacial Or- thop 2007; 131: 426-32.
22. Blake ME, Soto JA, Hayes RA, Ferrucci JT. Automated vol- umetry at CT colonography: a phantom study. Acad Radiol 2005; 12: 608-13.
23. Ramaseshan R, Heydarian M. Comprehensive quality assur- ance for stereotactic radiosurgery treatments. Phys Med Biol 2003; 48: N199-205.
24. Disler DG, Marr DS, Rosenthal DI. Accuracy of volume mea-
surements of computed tomography and magnetic resonance imaging phantoms by three-dimensional reconstruction and preliminary clinical application. Invest Radiol 1994; 29: 739- 45.
25. Katsumata A, Hirukawa A, Noujeim M, Okumura S, Naitoh M, Fujishita M, et al. Image artifact in dental cone-beam CT. Oral Surg Oral Med Oral Pathol Oral Radiol Endod 2006; 101:
652-7.