Introduction
The success and survival of dental implants and implant restorations is dependent on thorough diagnosis and treat- ment planning. In a review of the literature, BouSerhal et al.1concluded that several clinical situations require cross- sectional imaging for the optimal preoperative planning of implant placement. Information obtained from cone-beam computed tomography (CBCT) scans permits the measure- ment of the density, height, and buccolingual width of the
alveolar bone at any jaw location, as well as visualization of the pathology, inclination of the bone, and anatomic vi- tal structures.2-4
CBCT imaging data generated during implant planning can be converted and used to fabricate accurate three-di- mensional (3D) surgical guides using proprietary software programs. Implants are placed with higher accuracy using these 3D surgical guides. These guides can also be used to generate retro-engineered casts that enable the prefabrica- tion of restorations prior to implant surgery. These restora- tions can be precisely engineered to improve prosthetic outcomes and can be delivered to the patient on the day of the operation.5-15Using all available virtual tools, true re- storatively driven implant dentistry can be accomplished via image-guided surgery, benefiting both the patients and the dental surgeons.13-16
Accuracy and reliability of stitched cone-beam computed tomography images
Nicholas Egbert1, David R. Cagna2, Swati Ahuja2,*, Russell A. Wicks2
1Private Practice, Reconstructive Dental Specialists of Utah, Salt Lake City, UT, USA
2Department of Prosthodontics, University of Tennessee Health Science Center College of Dentistry, Memphis, TN, USA
ABSTRACT
Purpose: This study was performed to evaluate the linear distance accuracy and reliability of stitched small field of view (FOV) cone-beam computed tomography (CBCT) reconstructed images for the fabrication of implant surgical guides.
Material and Methods: Three gutta percha points were fixed on the inferior border of a cadaveric mandible to serve as control reference points. Ten additional gutta percha points, representing fiduciary markers, were scattered on the buccal and lingual cortices at the level of the proposed complete denture flange. A digital caliper was used to measure the distance between the reference points and fiduciary markers, which represented the anatomic linear dimension. The mandible was scanned using small FOV CBCT, and the images were then reconstructed and stitched using the manufacturer’s imaging software. The same measurements were then taken with the CBCT software.
Results: The anatomic linear dimension measurements and stitched small FOV CBCT measurements were statistically evaluated for linear accuracy. The mean difference between the anatomic linear dimension measure- ments and the stitched small FOV CBCT measurements was found to be 0.34 mm with a 95% confidence interval of ++0.24 -++0.44 mm and a mean standard deviation of 0.30 mm. The difference between the control and the stitched small FOV CBCT measurements was insignificant within the parameters defined by this study.
Conclusion: The proven accuracy of stitched small FOV CBCT data sets may allow image-guided fabrication of implant surgical stents from such data sets. (Imaging Sci Dent 2015; 45: 41-7)
KEY WORDS: Cone-Beam Computed Tomography; Computer-Aided Design; Dental Implants
*This study was supported in part by a grant from the American College of Prostho- dontics Education Foundation.
Revised September 30, 2014; Revised November 25, 2014; Accepted December 31, 2014
*Correspondence to : Dr. Swati Ahuja
Department of Prosthodontics, University of Tennessee Health Science Center, 875 Union Ave, Memphis, TN 38163, USA
Tel) 1-901-448-6230, Fax) 1-901-448-1294, E-mail) sahuja@uthsc.edu
Copyright ⓒ 2015 by Korean Academy of Oral and Maxillofacial Radiology
This is an Open Access article distributed under the terms of the Creative Commons Attribution Non-Commercial License (http://creativecommons.org/licenses/by-nc/3.0) which permits unrestricted non-commercial use, distribution, and reproduction in any medium, provided the original work is properly cited.
Imaging Science in Dentistry∙pISSN 2233-7822 eISSN 2233-7830
Several studies have concluded that few to no differences exist in the dimensional accuracy of conventional comput- ed tomography and CBCT.1,17,18 Radiographic methods utilized in the presurgical planning of implants must result in accurate and reliable measurements. CBCT imaging differs from conventional computed tomography imaging with regard to its resolution and field of view (FOV).19 Large FOV images are needed by orthodontists, oral and maxillofacial surgeons, and prosthodontists for advanced reconstruction with dental implants. However, for most other situations, especially endodontics, a more restricted FOV is suitable. Smaller FOV images are more affordable and decrease the patient’s radiation exposure. Small FOV images preclude the need for an expert opinion when the tissues imaged are restricted to dental structures.
Three-dimensional stitching (Carestream Health Inc., Rochester, NY, USA) is a new 3D acquisition mode that automatically combines two or three small FOV volumes to construct a larger, composite 3D image that is needed for a wider region of examination (80 mm×37 mm). The benefits of the 3D stitching module include a broader range of applications, affordability, flexibility, optimizing the radiation dose for patient safety, and improved workflow.
Kopp and Ottl19performed a study to verify the dimen- sional stability of stitched images, using endodontic files in select teeth. Distances were measured between repro- ducible points and found to be acceptable, with vertical distances ranging from 0.212 to 0.409 mm. The authors concluded that the stitched images were dimensionally stable, but indicated that further studies were needed to justify the use of stitched images for splint fabrication.
The manufacturers of the 3D stitching program have recently received approval for using stitched small FOV images to reconstruct data sets for the fabrication of im- plant surgical guides. However, no scientific study of the program has assessed its suitability for the fabrication of surgical guides.
The purpose of this study was to evaluate the linear dis- tance accuracy and reliability of stitched small field of view CBCT images for use in the fabrication of surgical dental implant guides. The results of this study may help decide whether stitched volumetric data sets would be able to be utilized in the fabrication of stereolithographic and computer-aided design/computer-aided manufacturing sur- gical guides.
Materials and Methods
A single dentate dry human cadaveric mandible, free of
outstanding defects, was acquired for the study. Three 1.5 mm×1.5 mm gutta percha (Henry Schein, Melville, NY, USA) reference points were placed on the mandible and fixed with cyanoacrylate gel. The first gutta percha refer- ence point was placed in the right quadrant, on the inferior border of the mandible and apical to the first molar. This point was designated as reference point A. The second re- ference point was aligned with the mid-symphysis and was also placed on the inferior border of the mandible. This point was designated as reference point B. The third refer- ence point was placed in the left quadrant on the inferior border of the mandible, apical to the first molar. This point was designated as reference point C. The three reference points were placed to coincide with a point on the midline of each of the three localized spherical volumes, which would be recorded by the small FOV CBCT scanner (Ko- dak 9000 D, Carestream Health Inc., Rochester, NY, USA).
Ten additional staggered 1.5 mm×1.5 mm gutta percha markers were placed in the bone as fiduciary markers and fixed with cyanoacrylate gel. The fiduciary markers were placed on both sides of the mandible. Five markers were placed on the buccal aspect and the remaining five were placed on the lingual aspect, such that there would be one reference point and at least three fiduciary markers in each scan of a localized spherical volume. The fiduciary markers were labeled 1-10, beginning in the buccal lower right quadrant and continuing sequentially, in counterclockwise fashion, from the buccal aspect to the lingual aspect.
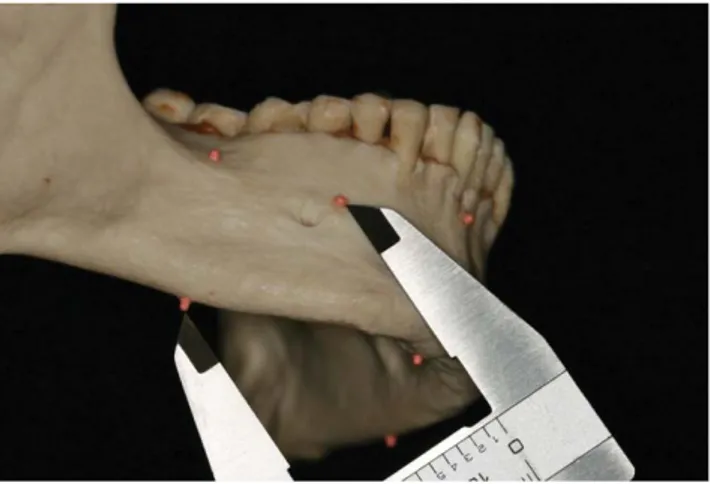
The control group measurements were recorded by tak- ing direct measurements on the cadaveric mandible. They were recorded using precision sliding digital calipers (Gen- eral Tools, New York, NY, USA) (Fig. 1). The measure- ments were made from the centro-inferior aspect of the reference point to the centro-external aspect of the fiduci-
Fig. 1.Control measurement is performed using digital calipers.
ary marker. Inter-reference point measurements were also made. Each measurement was recorded three times at an interval of 24 hours. The data was compiled using Micro- soft Excel version 12 (Microsoft, Redmond, WA, USA).
The mean of the three measurements was designated as the anatomic linear dimension.
The study group measurements were made by mounting the mandible on an adjustable calibration table in the CBCT scanner. A 0.5-mm thick piece of pressure-formable ther- moplastic material (Biocryl, Great Lakes Orthodontics, Tonawanda, NY, USA) was positioned over a 1.5-inch foam pad to separate the mandible from the calibration table in order to minimize distortion. The mandible was centrally positioned with the aid of laser lights, such that the inferior border of the mandible was parallel to the hori- zontal plane and the mid-sagittal plane was aligned per- pendicularly to the horizontal plane. This altered position- ing, in which the inferior border was parallel to the hori- zontal plane instead of the occlusal plane, permitted the entire mandible and all associated reference points to be captured in three scans without affecting the accuracy of the scan, despite the small field of view (37 mm).20,21The scan was performed with the following modified exposure settings to account for the lack of soft tissue density: 6 mA, 80 kVp, 18 s, 0.2 mm voxel size.
Care was taken not to move the mandible from its mount- ed position during all three scans. The raw Digital Imag- ing and Communications in Medicine data from the three scans were stitched into a composite 3D volume using the latest version of the Kodak 9000 proprietary software (KDIS
version 6.11., 6.2 and 3D module version 2.1, Carestream Health Inc, Rochester, NY, USA). The Kodak 9000 propri- etary software does not require the required reference points to be defined manually in order to stitch the volu- mes together. Instead, it is only necessary to select the ap- propriate option from the user menu, and the software then automatically combines the volumes into one ready-to-use 3D volume. The images were viewed on a 19-inch monitor (Dell Inc., Round Rock, TX, USA) in its default resolution of 1600×1200 pixels. Multiplanar reconstructed slices (sagittal, parasagittal, axial, and coronal) were correctly manipulated and used to visualize and measure the linear and/or angular distances from the three reference markers to each of the ten fiduciary markers with the software’s measuring tool. The points and markers were visually lo- cated and marked with a mouse (Dell Inc., Round Rock, TX, USA). As in the control, the measurements were made from the centro-inferior aspect of the reference points to the centro-external aspect of the fiduciary markers on the software. Care was taken to correctly adjust each slice in the multiplanar reconstruction view to identify the most superficial aspect of each marker, mimicking the control measurements made with the calipers (Fig. 2). Each mea- surement was recorded three times at 24-hour intervals by the same evaluator and logged into the spreadsheet. The mean was calculated for each measurement and designat- ed as the stitched small FOV CBCT dimension. Both the mean anatomic linear dimension and the mean stitched small FOV CBCT dimension were calculated for each of the three measurements, in order to allow the two groups
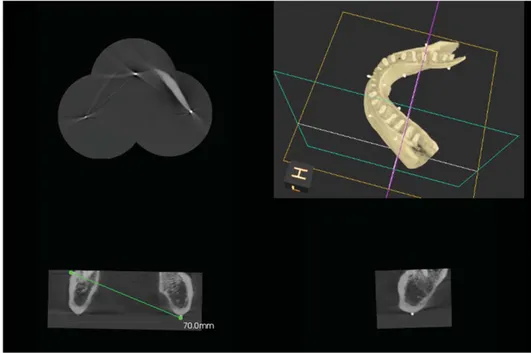
Fig. 2.A Stitched image using the small field of view cone-beam com- puted tomography images is seen.
The measurement is performed us- ing the multiplanar view after loca- ting the reference points and mark- ers accurately.
to be compared. The means of the two groups were com- pared and the difference between the anatomic linear di- mension and stitched small FOV CBCT dimension was determined. The mean, standard deviation, and mean dif- ferences were calculated using Microsoft Excel.
Results
Intraoperator differences in the control measurements made on the skull with digital calipers (the anatomic linear dimension) were analyzed and found to be statistically sig- nificant. The mean difference among the control measure- ments was -0.01 mm with a 95% confidence interval of -0.04 - -0.03 mm (Table 1) and a standard deviation of
0.10 mm. Intraoperator differences in the digital CBCT measurements were also found to be statistically signifi- cant. The mean intraoperator difference among the CBCT measurements was -0.08 mm with a 95% confidence in- terval of -0.12 - -0.03 mm (Table 2). The overall mean difference between the control group (anatomic linear di- mension) measurements and the study group (stitched small FOV CBCT) measurements was 0.34 mm (Table 3). The mean standard deviation between the two groups was 0.30 mm with a 95% confidence interval of ±0.102 mm (0.24 - 0.44 mm).
Discussion
The intraoperator differences between the control mea-
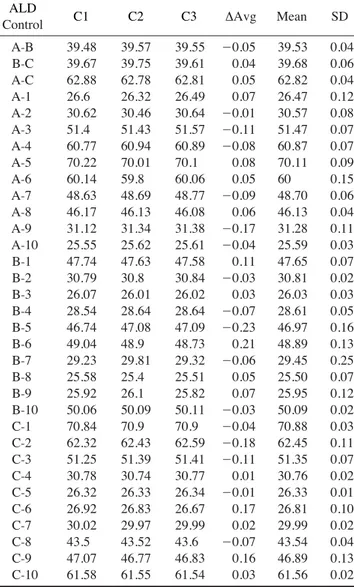
Table 1.Summary of the mean difference among the control mea- surements
ALD C1 C2 C3 ΔAvg Mean SD
Control
A-B 39.48 39.57 39.55 -0.05 39.53 0.04 B-C 39.67 39.75 39.61 0.04 39.68 0.06 A-C 62.88 62.78 62.81 0.05 62.82 0.04 A-1 26.6 26.32 26.49 0.07 26.47 0.12 A-2 30.62 30.46 30.64 -0.01 30.57 0.08 A-3 51.4 51.43 51.57 -0.11 51.47 0.07 A-4 60.77 60.94 60.89 -0.08 60.87 0.07 A-5 70.22 70.01 70.1 0.08 70.11 0.09 A-6 60.14 59.8 60.06 0.05 60 0.15 A-7 48.63 48.69 48.77 -0.09 48.70 0.06 A-8 46.17 46.13 46.08 0.06 46.13 0.04 A-9 31.12 31.34 31.38 -0.17 31.28 0.11 A-10 25.55 25.62 25.61 -0.04 25.59 0.03 B-1 47.74 47.63 47.58 0.11 47.65 0.07 B-2 30.79 30.8 30.84 -0.03 30.81 0.02 B-3 26.07 26.01 26.02 0.03 26.03 0.03 B-4 28.54 28.64 28.64 -0.07 28.61 0.05 B-5 46.74 47.08 47.09 -0.23 46.97 0.16 B-6 49.04 48.9 48.73 0.21 48.89 0.13 B-7 29.23 29.81 29.32 -0.06 29.45 0.25 B-8 25.58 25.4 25.51 0.05 25.50 0.07 B-9 25.92 26.1 25.82 0.07 25.95 0.12 B-10 50.06 50.09 50.11 -0.03 50.09 0.02 C-1 70.84 70.9 70.9 -0.04 70.88 0.03 C-2 62.32 62.43 62.59 -0.18 62.45 0.11 C-3 51.25 51.39 51.41 -0.11 51.35 0.07 C-4 30.78 30.74 30.77 0.01 30.76 0.02 C-5 26.32 26.33 26.34 -0.01 26.33 0.01 C-6 26.92 26.83 26.67 0.17 26.81 0.10 C-7 30.02 29.97 29.99 0.02 29.99 0.02 C-8 43.5 43.52 43.6 -0.07 43.54 0.04 C-9 47.07 46.77 46.83 0.16 46.89 0.13 C-10 61.58 61.55 61.54 0.03 61.56 0.02 ΔAvg: average difference between the 3 measurements, Mean: Mean of the 3 measurements, SD: standard deviation, C1: first measurement, C2:
second measurement, C3: third measurement
Table 2. Summary of the mean intraoperator difference among the cone-beam CT measurements
CBCT CBC1 CBC2 CBC3 ΔAvg Mean SD A-B 38.8 39.1 39.0 -0.13 38.97 0.15 B-C 39.6 39.9 39.8 -0.13 39.77 0.15 A-C 61.9 62.0 62.1 -0.13 62.00 0.10 A-1 26.3 26.5 26.1 0.13 26.30 0.20 A-2 30.2 30.1 30.2 0.00 30.17 0.06 A-3 50.5 50.4 50.8 -0.20 50.57 0.21 A-4 60.4 60.7 60.9 -0.33 60.67 0.25 A-5 69.1 69.5 69.3 -0.13 69.3 0.20 A-6 59.0 59.4 59.4 -0.27 59.27 0.23 A-7 47.9 47.8 48.2 -0.20 47.97 0.21 A-8 45.5 46.0 45.8 -0.20 45.77 0.25 A-9 30.7 31.0 31.1 -0.27 30.93 0.21 A-10 25.4 25.6 25.4 0.00 25.47 0.12 B-1 47.0 47.3 46.9 0.07 47.07 0.21 B-2 30.7 30.8 30.8 -0.07 30.77 0.06 B-3 26.1 26.0 26.3 -0.13 26.13 0.15 B-4 28.9 28.9 28.8 0.07 28.87 0.06 B-5 47.4 47.0 47.1 0.20 47.17 0.21 B-6 48.4 48.5 48.4 0.00 48.43 0.06 B-7 29.7 29.5 29.4 0.20 29.53 0.15 B-8 25.0 25.2 25.1 -0.07 25.10 0.10 B-9 25.5 25.3 25.2 0.20 25.33 0.15 B-10 49.6 49.6 49.9 -0.20 49.70 0.17 C-1 70.0 70.2 70.1 -0.07 70.10 0.10 C-2 62.1 62.1 62.3 -0.13 62.17 0.12 C-3 51.1 51.3 51.2 -0.07 51.20 0.10 C-4 30.4 30.3 30.4 0.00 30.37 0.06 C-5 26.0 26.1 26.1 -0.07 26.07 0.06 C-6 26.2 26.6 26.7 -0.33 26.50 0.26 C-7 29.7 29.7 29.9 -0.13 29.77 0.12 C-8 43.2 43.3 43.2 0.00 43.23 0.06 C-9 46.5 46.4 46.5 0.00 46.47 0.06 C-10 61.2 61.4 61.4 -0.13 61.33 0.12 ΔAvg: average difference between the 3 measurements, Mean: Mean of the 3 measurements, SD: standard deviation, CBC1: first measurement, CBC2: second measurement, CBC3: third measurement
surements made on the skull with digital calipers (the an- atomic linear dimension) were analyzed and found to be statistically significant. This is attributed to the small 0.10- mm standard deviation in differences between measure- ments. The mean difference between control measurements was -0.01 mm, with a 95% confidence interval of -0.04 - -0.03 mm and a standard deviation of 0.10 mm. Sharp digital calipers and sharp gutta percha points facilitated accurate measurement of fiduciary markers and reference points. Although statistically different, mean differences of hundredths of a millimeter are not clinically relevant.
The intraoperator differences in CBCT digital measure- ments were also found to be statistically significant. The mean intraoperator difference between CBCT measure- ments was -0.08 mm, with a 95% confidence interval of -0.12 - -0.03 mm. The statistical significance of these measurements was also due to the small 0.14-mm standard deviation in the differences between measurements. This phenomenon might be explained as the result of controll- ed, predictable detection of the center of each gutta percha marker on the mandible by manipulating multiple sub-mil- limeter planes viewed in the stitched small FOV CBCT software. The points were detected as a result of their ra- diopacity in each plane. The multiplanar views were mani- pulated until a slight, pinpoint radiopacity was detected, enabling the center of each point to be identified. Despite the statistical significance, a mean difference of -0.08 mm with a standard deviation of 0.14 mm is not clinically sig- nificant. In comparing the control (anatomic linear dimen- sion) measurements to the CBCT measurements, the mean difference between the anatomic linear dimension and the stitched small FOV CBCT dimension was found to be 0.34 mm with a 95% confidence interval of ++0.24 -++0.44 mm and a mean standard deviation of 0.30 mm. There was no systematic bias between the differences in the observations.
Thus, each measurement appeared to be as good as the other. The differences between the control measurements and the CBCT measurements were acceptable within the parameters defined in this study.
The results of this study indicated that CBCT measure-
ments underestimated the control measurements. Similar results were obtained by Lascala et al.,22who found a mean difference of 0.34 mm between anatomic linear dimension measurements and stitched small FOV CBCT measure- ments. Inconsistencies in the accuracy of Digital Imaging and Communication in Medicine files reconstructed by a proprietary software program were reported by Periago et al.23They concluded that many linear measurements bet- ween cephalometric landmarks in 3D volumetric surface rendering datasets might be statistically significantly dif- ferent from the anatomic dimensions. However, whether or not the differences in measurements are clinically signi- ficant is a matter of defining the parameters for clinical significance.
A 1-mm margin of error was considered the clinically relevant threshold for accuracy in this study, and was cho- sen due to its common application and use in nearly all clinical dental procedures. The parameters for restorative dental procedures are evaluated and executed on the scale of millimeters. In order to ensure successful treatment, it is proposed that the root canal space be properly instru- mented and obturated within 1 mm of the root’s apex. Pro- bing depths are used to diagnose and treat the periodon- tium using a millimeter scale. More pertinent to this study, a 2-mm safety zone near vital structures has been suggest- ed when surgically planning and placing dental implants near vital structures.3This suggestion is based on conven- tional radiography with its inherent distortions. Discrepa- ncies ¤1 mm, with additional statistical margins of error, might encroach on these clinically accepted safety para- meters.
Despite the superior image accuracy of stitched small FOV CBCT, it might not be prudent to assume that one could approximate vital structures during surgical proce- dures with more accuracy than previously established in the literature, due to the operator’s visual and tactile limi- tations. According to the results of this study, the likelihood of measurement discrepancies increases when using both analog measuring instruments (i.e., calipers or probes) and digital stitched small FOV CBCT measurements. This in-
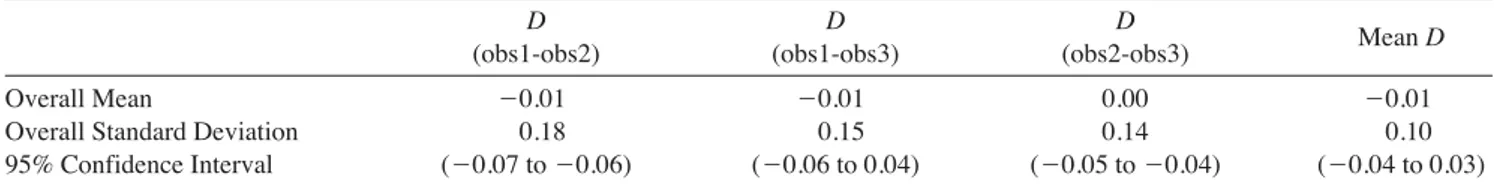
Table 3.Analysis of the measurements the anatomic linear dimension within the control group
D D D
Mean D (obs1-obs2) (obs1-obs3) (obs2-obs3)
Overall Mean -0.01 -0.01 0.00 -0.01
Overall Standard Deviation 0.18 0.15 0.14 0.10
95% Confidence Interval (-0.07 to -0.06) (-0.06 to 0.04) (-0.05 to -0.04) (-0.04 to 0.03) D: difference, obs: observation group
creases the need for the accurate conversion of stitched small FOV CBCT images into computer-aided design/com- puter-aided manufacturing surgical guides, allowing for the safest surgery possible. As noted previously, the differ- ences in both the anatomic linear dimension and the stitch- ed small FOV CBCT dimension were statistically signifi- cant, but clinically insignificant due to the sub-millimeter resolution of the measurements. This difference is beyond the resolution of the human eye and hand.
Kopp and Ottl19studied the dimensional stability of sti- tched data sets and also found them to be acceptable. In dual scan, guided surgical protocols, reference markers in each of the three fields of view can be obtained by using anatomical landmarks or notches that are simply made with a round bur in the location of the mid-symphysis and near the posterior borders of the radiographic template, outside the positional osteotomy sites. These markers can be verified in the reconstructed image with digital measure- ments in multiplanar views of the CBCT image. If the measurements match, the operator should feel confident in the stitched small FOV volumes. If significant discre- pancies in measurement occur, the scan or stitched volu- mes might be inaccurate, causing the subsequent guide to be inaccurate. In this situation, guided surgery should be aborted.
Similarly, reference markers can be incorporated into the radiographic guide before taking the scan, and the re- sulting measurements can be used to assess the accuracy of the implant surgical stent. If a discrepancy is be found, the accuracy of the guide can be considered suboptimal.
Any inaccuracies found at this stage might be result from random problems in the guide fabrication process.
The 3D stitching module has several advantages, inclu- ding broader range of applications, affordability, flexibil- ity, optimizing the radiation dose for patient safety, and improved workflow. However, it should be noted that hori- zontal stitching results in scanning the overlapping regions twice, thereby doubling the radiation dose delivered to those regions.24Small FOV scans have a better image qual- ity and resolution than large FOV scans.25This study ap- pears to be the first of its kind, and further studies are need- ed to compare the radiation exposure and image quality of stitched images to large FOV images and to verify the accuracy of the guide fabrication process using stitched Digital Imaging and Communication in Medicine files.
In conclusion, stitched composite 3D imaging appeared accurate and reliable for diagnostic purposes, within the operator’s physical limitations and the parameters defined in this study. Clinically insignificant differences between
the control measurements and those of the stitched data sets might be taken into consideration in the diagnosis and treatment planning of both surgical and non-surgical den- tal procedures. The minuscule differences between the control measurements and those of the stitched data sets may allow image-guided implant surgical stents to be fa- bricated from such data sets.
Acknowledgments
The authors thank Dr. Mark Scarbecz for the statistical support. The authors also thank Kodak Dental Systems for providing hardware and software support.
References
1. BouSerhal C, Jacobs R, Quirynen M, van Steenberghe D. Ima- ging technique selection for the preoperative planning of oral implants: a review of the literature. Clin Implant Dent Relat Res 2002; 4: 156-72.
2. Aranyarachkul P, Caruso J, Gantes B, Schulz E, Riggs M, Dus I, et al. Bone density assessments of dental implant sites: 2.
Quantitative cone-beam computerized tomography. Int J Oral Maxillofac Implants 2005; 20: 416-24.
3. Greenstein G, Tarnow D. The mental foramen and nerve: clini- cal and anatomical factors related to dental implant placement:
a literature review. J Periodontol 2006; 77: 1933-43.
4. Lee S, Gantes B, Riggs M, Crigger M. Bone density assess- ments of dental implant sites: 3. Bone quality evaluation dur- ing osteotomy and implant placement. Int J Oral Maxillofac Implants 2007; 22: 208-12.
5. Kraut RA. Interactive CT diagnostics, planning and prepara- tion for dental implants. Implant Dent 1998; 7: 19-25.
6. Sarment DP, Sukovic P, Clinthorne N. Accuracy of implant placement with a stereolithographic surgical guide. Int J Oral Maxillofac Implants 2003; 18: 571-7.
7. Parel SM, Triplett RG. Interactive imaging for implant plann- ing, placement, and prosthesis construction. J Oral Maxillofac Surg 2004; 62: 41-7.
8. Guerrero ME, Jacobs R, Loubele M, Schutyser F, Suetens P, van Steenberghe D. State-of-the-art on cone beam CT imaging for preoperative planning of implant placement. Clin Oral Investig 2006; 10: 1-7.
9. Balshi SF, Wolfinger GJ, Balshi TJ. Surgical planning and prosthesis construction using computer technology and medi- cal imaging for immediate loading of implants in the pterygo- maxillary region. Int J Periodontics Restorative Dent 2006; 26:
239-47.
10. Nikzad S, Azari A. A novel stereolithographic surgical guide template for planning treatment involving a mandibular dental implant. J Oral Maxillofac Surg 2008; 66: 1446-54.
11. Valente F, Schiroli G, Sbrenna A. Accuracy of computer-aided oral implant surgery: a clinical and radiographic study. Int J Oral Maxillofac Implants 2009; 24: 234-42.
12. Jung RE, Schneider D, Ganeles J, Wismeijer D, Zwahlen M,
Hämmerle CH, et al. Computer technology applications in sur- gical implant dentistry: a systematic review. Int J Oral Maxil- lofac Implants 2009; 24: 92-109.
13. Sanna A, Molly ML, van Steenberghe D. Immediately loaded CAD-CAM manufactured fixed complete dentures using fla- pless implant placement procedures: a cohort study of consec- utive patients. J Prosthet Dent 2007; 97: 331-9.
14. Balshi TJ, Wolfinger GJ. Teeth in a day for the maxilla and mandible: case report. Clin Implant Dent Relat Res 2003; 5:
11-6.
15. Hultin M, Svensson K, Trulsson M. Clinical advantages of computer-guided implant placement: a systematic review. Clin Oral Implants Res 2012; 23: 124-35.
16. Ganz SD. Computer-aided design/computer-aided manufactu- ring applications using CT and cone beam CT scanning tech- nology. Dent Clin North Am 2008; 52: 777-808.
17. Lindh C, Petersson A, Klinge B. Measurements of distances related to the mandibular canal in radiographs. Clin Oral Im- plants Res 1995; 6: 96-103.
18. Kobayashi K, Shimoda S, Nakagawa Y, Yamamoto A. Accu- racy in measurement of distance using limited cone-beam com- puterized tomography. Int J Oral Maxillofac Implants 2004;
19: 228-31.
19. Kopp S, Ottl P. Dimensional stability in composite cone beam computed tomography. Dentomaxillofac Radiol 2010; 39:
512-6.
20. Berco M, Rigali PH Jr, Miner RM, DeLuca S, Anderson NK, Will LA. Accuracy and reliability of linear cephalometric mea- surements from cone-beam computed tomography scans of a dry human skull. Am J Orthod Dentofacial Orthop 2009; 136:
17.e1-9.
21. Hassan B, van der Stelt P, Sanderink G. Accuracy of three-di- mensional measurements obtained from cone beam computed tomography surface-rendered images for cephalometric analy- sis: influence of patient scanning position. Eur J Orthod 2009;
31: 129-34.
22. Lascala CA, Panella J, Marques MM. Analysis of the accuracy of linear measurements obtained by cone beam computed to- mography (CBCT-NewTom). Dentomaxillofac Radiol 2004;
33: 291-4.
23. Periago DR, Scarfe WC, Moshiri M, Scheetz JP, Silveira AM, Farman AG. Linear accuracy and reliability of cone beam CT derived 3-dimensional images constructed using an orthodon- tic volumetric rendering program. Angle Orthod 2008; 78: 387- 95.
24. Scarfe WC, Li Z, Aboelmaaty W, Scott SA, Farman AG. Ma- xillofacial cone beam computed tomography: essence, elements and steps to interpretation. Aust Dent J 2012; 57: 46-60.
25. Mayo JR. High resolution computed tomography. Technical aspects. Radiol Clin North Am 1991; 29: 1043-9.