Relationship between Angiographic Late Loss and 5-Year Clinical Outcome after Drug-Eluting Stent Implantation
Young-June Yang,
1* Sanghoon Shin,
1* Byeong-Keuk Kim,
1Jung-Sun Kim,
1Dong-Ho Shin,
1Young-Guk Ko,
1Donghoon Choi,
1Yangsoo Jang,
1,2and Myeong-Ki Hong
1,21Division of Cardiology, Severance Cardiovascular Hospital and 2Severance Biomedical Science Institute, Yonsei University College of Medicine, Seoul, Korea.
Received: January 10, 2012 Revised: February 24, 2012 Accepted: February 27, 2012
Corresponding author: Dr. Myeong-Ki Hong, Division of Cardiology, Severance Cardiovascular Hospital, and Severance Biomedical Science Institute, Yonsei University College of Medicine, 50 Yonsei-ro, Seodaemun-gu, Seoul 120-752, Korea.
Tel: 82-2-2228-8458, Fax: 82-2-393-2041 E-mail: [email protected]
*Young-June Yang and Sanghoon Shin contributed equally to this work.
∙ The authors have no financial conflicts of interest.
© Copyright:
Yonsei University College of Medicine 2013 This is an Open Access article distributed under the terms of the Creative Commons Attribution Non- Commercial License (http://creativecommons.org/
licenses/by-nc/3.0) which permits unrestricted non- commercial use, distribution, and reproduction in any medium, provided the original work is properly cited.
Purpose: Currently, insufficient data exist to evaluate the relationship between an- giographic late loss (LL) and long-term clinical outcome after drug-eluting stent (DES) implantation. In this study, we hypothesized that angiographic LL between 0.3 and 0.6 mm correlate with favorable long-term clinical outcomes. Materials and Methods: Patients were enrolled in the present study if they had undergone both DES implantation in single coronary vessel and a subsequent follow-up an- giogram (n=634). These individuals were then subdivided into three groups based on their relative angiographic LL: group I (angiographic LL <0.3 mm, n=378), group II (angiographic LL between 0.3 and 0.6 mm, n=124), and group III (angio- graphic LL >0.6 mm, n=134). During a 5-year follow-up period, all subjects were tracked for critical events, defined as any cause of death or myocardial infarction, which were then compared among the three groups. Results: Mean follow-up du- ration was 63.0±10.0 months. Critical events occurred in 25 subjects in group I (6.6%), 5 in group II (4.0%), and 17 in group III (12.7%), (p=0.020; group I vs.
group II, p=0.293; group II vs. group III, p=0.013). In a subsequent multivariate logistic regression analysis, chronic renal failure [odds ratio (OR)=3.29, 95% con- fidence interval (CI): 1.48-7.31, p=0.003] and long lesion length, defined as lesion length >28 mm (OR=1.88, 95% CI: 1.02-3.46, p=0.042) were independent predic- tors of long-term critical events. Conclusion: This retrospective analysis fails to demonstrate that post-DES implantation angiographic LL between 0.3 and 0.6 mm is protective against future critical events.
Key Words: Coronary artery disease, stents, outcome assessment
INTRODUCTION
Drug-eluting stents (DESs) have been widely used in percutaneous coronary inter-
ventions and they have reduced both restenosis rates and the need for repeat revas-
cularizations when compared with bare-metal stents.
1,2However, the safety and
superiority of DESs has recently been called into question by data from several
long-term monitory studies, in particular the incidence of stent thrombosis.
3,4Spe-
cifically, late stent thrombosis is believed to result from delayed coronary artery
met both the inclusion and exclusion criteria were enrolled and subsequently divided into three groups according to an- giographic LL-individuals with angiographic LL <0.3 mm (group I; n=378), individuals with angiographic LL be- tween 0.3 and 0.6 mm (group II; n=124), and individuals with angiographic LLs >0.6 mm (group III; n=134). In all cases, DES implantation was performed using conventional techniques without complication, with performing opera- tor’s discretion determining the DES type employed. All patients were treated with 200 mg of aspirin and a loading dose (300 to 600 mg) of clopidogrel prior to coronary inter- vention. Unfractionated heparin was also administered in an initial bolus of 100 IU/kg at this time, with additional boluses given throughout the procedure to achieve an acti- vated clotting time of 250 to 300 seconds. Dual anti-platelet therapy (aspirin 100 mg/day and clopidogrel 75 mg/day) was given to all patients for at least 9 months after stent placement.
Definitions and clinical outcomes
All clinical events were defined per those established by the Academic Research Consortium.
9All deaths were consid- ered cardiac deaths unless a definite non-cardiac cause could be established. Myocardial infarctions were defined as clinical symptoms, electrocardiographic changes or ab- normal imaging findings suggestive of myocardial infarc- tion in combination with an increase in the serum creatine kinase MB or troponin-T/troponin-I to a level greater than the 99th percentile of the upper normal limit not related to an interventional procedure. Definite, probable, and possi- ble stent thrombosis was defined per the recommendations of the Academic Research Consortium.
9Target vessel re- vascularization was defined as either the percutaneous or surgical revascularization of the stented epicardial vessel.
For the present study, the primary outcome was the inci- dence of critical events-defined as any cause of death or myocardial infarction during the 5-year follow-up period- which was then compared between the three subgroups.
Angiographic analysis
Quantitative coronary angiography analysis was performed using an offline quantitative coronary angiography system (CASS System II, Pie Medical Imaging, Nuenen, the Nether- lands) both before and after stent placement and at the time of follow-up angiogram. Both the MLD of the DES-treated coronary lesions and the reference diameter were measured in the most severe view that was not foreshortened.
healing secondary to excessive inhibition of neointimal for- mation, with emerging data suggesting that the ratio of un- covered stent struts to total stent struts is the best morpho- metric predictor of late stent thrombosis.
5Furthermore, the development of optical coherence tomography (OCT) al- lows for more accurate evaluation of the neointimal cover- age of stent struts-widely regarded as the most powerful predictor of stent thrombosis based on several histopatho- logic studies.
6,7However, given the cost and limited avail- ability of this imaging modality, performing a follow-up OCT after every DES placement is currently not feasible in daily clinical practice. The angiographic late loss (LL)-de- fined as the difference between the post-intervention mini- mal lumen diameter (MLD) and follow-up MLD-is consid- ered one of the most important endpoints used to evaluate DES efficacy,
8with our previous OCT study showing that angiographic LLs between 0.3 and 0.6 mm may represent an optimal midpoint between restenosis and stent thrombo- sis.
6No clear clinical evidence to support these aforemen- tioned angiographic cut-off values from previous study cur- rently exists; therefore, the present study was designed to evaluate whether post-DES-placement angiographic LL be- tween 0.3 mm and 0.6 mm correlate with a lower incidence of critical events.
MATERIALS AND METHODS
Study population
In total, 1062 patients were treated with DES for single cor-
onary vessel de novo lesions between March 2003 and De-
cember 2004, with only two types of DES used: sirolimus-
eluting (Cypher
TM, Cordis, Miami, FL, USA) and paclitaxel-
eluting stents (Taxus
TM, Boston Scientific, Natick, MA,
USA). Inclusion criteria for the present study included: an
elective or emergent percutaneous coronary intervention,
all those aged between 18 and 80 years, and follow-up of
coronary angiogram 6-12 months after stent placement. Ex-
clusion criteria included cardiogenic shock, age younger
than 18 or greater than 80 years, lack of an angiographic fol-
low-up study, and multi-vessel or multi-lesion stent place-
ments. Angiographic follow-up studies were generally per-
formed for the following reasons: evidence suggesting
myocardial ischemia upon stress test, clinical evidence of
acute coronary syndrome, or planned follow-up angiogra-
phy for other study protocols. Using the percutaneous coro-
nary intervention database at our institute, 636 patients who
cal events were chronic renal failure [odds ratio (OR)=3.29;
95% confidence interval (CI): 1.48-7.31; p=0.003] and long lesion length (lesion length >28 mm; OR=1.88; 95% CI:
1.02-3.46; p=0.042) (Table 4). The incidence of clinical events according to the longitudinal follow-up time using Kaplan-Meier curves can be seen in Fig. 1.
DISCUSSION
The degree of LL was closely related to in-stent restenosis by the proliferation of neointimal tissue. One previous angio- graphic study of 1011 lesions treated with sirolimus-eluting stents reported that in-stent LL-an angiographic surrogate for neointimal hyperplasia-is positively correlated with clinical restenosis, and therefore potentially useful for discriminating between new DESs because the binary restenosis rates are anticipated to be low.
10Another recent meta-regression anal- ysis of 15846 patients from 29 randomized clinical trials also reported that LL is a strong predictor of binary angiographic restenosis and target vessel revascularization.
11Accordingly, it appears that the new DES platforms need to achieve as low LL as possible to be safe and certainly well below the 0.5 mm in order to ensure the rare need for target vessel revascu- larization.
11However, reducing post-DES-placement LL to decrease the need for target vessel revascularization may par- adoxically increase the probability of uncovered stent struts, as smaller LL values correlate with higher percentages of un- covered stent struts. Recently, the safety profile of DESs has been called into question, primarily due to their potential as- sociation with stent thrombosis and subsequent catastrophic outcomes, with uncovered stent struts believed to represent the most significant predictor of stent thrombosis. Therefore, while stent strut neointimal coverage may exert a protective role against stent thrombosis, exaggerated neointimal prolif- eration, which directly results in larger LL value, increases the likelihood of target vessel revascularization. Given this paradox, the presence of minimal neoinitmal stent strut cov- erage (e.g., coverage that is neither absent nor profuse) may optimally balance the risk of restenosis with that of stent thrombosis. In a previous study,
6we proposed 2 angiograph- ic LL cut-off values for predicting the percentage of uncov- ered struts in DES-treated lesions. Lesions with an angio- graphic LL <0.3 mm, in which neointimal hyperplasia was suppressed, were associated with a lower risk of restenosis, however, they were more likely to contain uncovered struts, and carry a greater risk of stent thrombosis. Conversely, le- Statistical analyses
All statistical analyses were performed using the Statistical Analysis System software (SAS; v9.1.3., SAS Institute Inc., Cary, NC, USA), with all data expressed as frequencies as mean±SD. Categorical data were compared by either chi- square tests or Fisher’s exact test. Continuous data were presented as mean±standard deviation, and compared using the Student’s t-test. Comparisons between all three groups were performed via an analysis of variance using the Bon- ferroni correction for post hoc analysis. In cases where the distributions were skewed, a non-parametric test was used.
We estimated the cumulative event rate using the Kaplan- Meier method. To identify independent predictors for criti- cal events, a Cox proportional hazards regression analysis was used to identify possible significant associations be- tween the events and a number of independent variables, then the variables with a univariate analysis p-value of <0.1 and significant clinical variables (acute coronary syndrome and diabetes mellitus) were entered into the final multivari- ate logistic regression analysis. In all cases, a p value of
<0.05 was considered statistically significant.
RESULTS
Baseline clinical and angiographic characteristics among the three groups are shown in Table 1. Paclitaxel-eluting stents were used more frequently in group III. Post-inter- vention MLD was also significantly greater in group III. All comparisons of long-term clinical events between the three groups are shown in Table 2. Mean follow-up duration for all subjects was 63.0±10.0 months (63.0±9.9 for group I, 64.2±9.2 for group II, and 62.8±10.7 for group III; p=0.458).
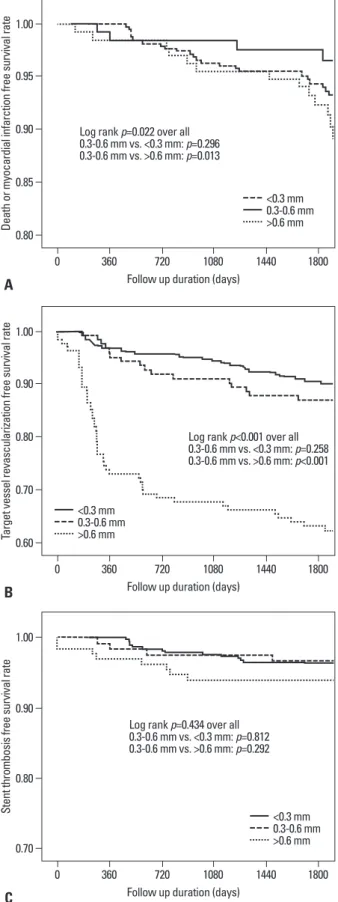
Death or myocardial infarction occurred in 25 patients in
group I (6.6%), 5 patients in group II (4.0%), and 17 patients
in group III (12.7%), with (p=0.020; group I vs. group II,
p=0.293; group II vs. group III, p=0.013). Target vessel re-
vascularization was performed in 38 individuals in group I
(10.1%), 17 individuals in group II (13.7%), and 50 indi-
viduals in group III (37.3%), with p<0.001. Stent thrombo-
sis occurred in 14 subjects in group I (3.7%), 4 subjects in
group II (3.2%), and 8 subjects in group III (6.0%), with
p=0.452. Baseline clinical and angiographic characteristics
between patients who did and did not experience long-term
critical events during the 5-year follow-up period are listed
in Table 3. In the subsequent multivariate logistic regres-
sion analysis, the independent predictors of long term criti-
Table 1. Baseline Clinical and Angiographic Characteristic among the Three Groups
0.3 mm<LL(n=378) 0.3 mm≤LL
≤0.6 mm (n=124) LL>0.6 mm
(n=134) p value
Clinical variable
Age (yrs) 59.3±9.6 61.1±10.5 60.6±9.9 0.144
Male [n (%)] 265 (70.1) 89 (71.8) 90 (67.2) 0.709
Diabetes mellitus [n (%)] 108 (28.6) 44 (35.5) 51 (38.1)* 0.082
Hypertension [n (%)] 223 (59.0) 78 (62.9) 83 (61.9) 0.681
Hypercholesterolemia [n (%)] 91 (24.1) 34 (27.4) 28 (20.9) 0.472
Current smoker [n (%)] 122 (32.3) 40 (32.3) 44 (32.8) 0.992
Acute coronary syndrome [n (%)] 186 (49.2) 59 (47.6) 80 (59.7)* 0.077
Acute myocardial infarction [n (%)] 60 (15.9) 14 (11.3) 24 (17.9) 0.314
Primary PCI [n (%)] 12 (3.2) 2 (1.6) 3 (2.2) 0.607
Chronic renal failure [n (%)] 20 (5.3) 8 (6.5) 12 (9.0) 0.323
Congestive heart failure [n (%)] 20 (5.3) 3 (2.4) 4 (3.0) 0.278
Angiographic variable Target vessel [n (%)]
Left anterior descending artery 240 (63.5) 83 (66.9) 78 (58.2) 0.336
Left circumflex artery 74 (19.6) 17 (13.7) 26 (19.4) 0.324
Right coronary artery 64 (16.9) 24 (19.4) 30 (22.4) 0.324
Extent of diseased vessels [n (%)]
1-vessel 121 (32.5) 31 (25.6) 44 (33.31) 0.321
2-vessel 134 (36.0) 58 (47.9) 49 (36.8) 0.059
3-vessel 1 17 (31.5) 32 (26.4) 40 (30.1) 0.581
Lesion length (mm) 22.0±7.6 23.6±8.9 20.8±7.6 0.018
Lesion length >28 mm [n (%)] 83 (22.3) 32 (26.2) 24 (18.0) 0.289
Stent diameter (mm) 3.0±0.34 3.0±0.34 3.1±0.32 0.038
Stent length (mm) 23.8±9.8 23.3±12.6 22.9±9.6 0.632
Stent implanted [n (%)] <0.001
Sirolimus-eluting stent 295 (75.0) 86 (69.4) 77 (57.5)
Paclitaxel-eluting stent 83 (22.0) 38 (30.6) 57 (42.5)
Follow-up angiogram after index PCI (days) 270±77 261±60 283±72 0.661
Proportion of scheduled follow-up angiogram [n (%)] 366 (96.8) 119 (96.0) 126 (94.0) 0.359 Quantitative coronary angiographic analysis
Reference vessel size (mm) 2.76±0.51 2.74±0.60 2.77±0.60 0.953
Pre-intervention MLD (mm) 0.69±0.45 0.70±0.40 0.76±0.51 0.359
Post-intervention MLD (mm) 2.76±0.44 2.86±0.43 3.00±0.44 <0.001
Follow-up MLD (mm) 2.81±0.47 2.43±0.43 1.59±0.85 <0.001
LL (mm) -0.05±0.38 0.42±0.09 1.41±0.76 <0.001
LL, late loss; MLD, minimal lumen diameter; PCI, percutaneous coronary intervention.
*p<0.05 compared with 0.3 mm <LL group.
Table 2. Comparison of Long-Term Clinical Events between the Three Groups
0.3 mm<LL(n=378) 0.3 mm≤LL
≤0.6 mm (n=124) LL>0.6 mm
(n=134) p value
Death [n (%)] 19 (5.0) 3 (2.4) 7 (5.2) 0.443
Myocardial infarction [n (%)] 8 (2.1) 4 (3.2) 11 (8.2) 0.005
Death+myocardial infarction [n (%)] 25 (6.6) 5 (4.0) 17 (12.7) 0.020
Target vessel revascularization [n (%)] 38 (10.1) 17 (13.7) 50 (37.3) <0.001
Stent thrombosis [n (%)] 14 (3.7) 4 (3.2) 8 (6.0) 0.452
LL, late loss.
Table 3. Baseline Clinical and Angiographic Characteristics in Patients Who Did and Did Not Experience Long-Term Critical Events
Presence of critical events
(n=47) Absence of critical events
(n=589) p value
Clinical variable
Age (yrs) 62.8±11.1 59.7±9.8 0.041
Male [n (%)] 39 (83.0) 405 (68.8) 0.041
Diabetes mellitus [n (%)] 20 (42.6) 183 (31.1) 0.104
Hypertension [n (%)] 30 (63.8) 354 (60.1) 0.615
Hypercholesterolemia [n (%)] 6 (15.0) 147 (29.5) 0.050
Current smoker [n (%)] 19 (40.4) 18 (31.7) 0.221
Acute coronary syndrome [n (%)] 29 (61.7) 296 (50.3) 0.131
Chronic renal failure [n (%)] 10 (21.3) 30 (5.1) <0.001
Congestive heart failure [n (%)] 2 (4.3) 25 (4.2) 0.997
Angiographic variable
Target vessel [n (%)] 0.558
Left anterior descending artery 26 (55.3) 295 (50.1)
Left circumflex artery 15 (31.9) 182 (30.9)
Right coronary artery 6 (12.8) 112 (19.0)
Extent of diseased vessels [n (%)] 0.281
1-vessel 17 (36.2) 179 (30.9)
2-vessel 13 (27.7) 228 (39.4)
3-vessel 17 (36.2) 172 (29.7)
Lesion length (mm) 23.4±8.7 21.9±7.9 0.233
Lesion length >28 mm [n (%)] 16 (34.0) 123 (21.2) 0.041
Stent diameter (mm) 2.95±0.32 3.01±0.34 0.257
Stent length (mm) 23.6±12.1 23.5±10.2 0.962
Stent implanted [n (%)] 0.959
Sirolimus-eluting stent 34 (72.3) 424 (72.0)
Paclitaxel-eluting stent 13 (27.7) 165 (28.0)
Quantitative coronary angiographic analysis
Reference vessel size (mm) 2.73±0.56 2.76±0.55 0.788
Pre-intervention MLD (mm) 0.64±0.39 0.71±0.46 0.331
Post-intervention MLD (mm) 2.73±0.52 2.84±0.44 0.114
Follow-up MLD (mm) 2.01±1.13 2.52±0.69 0.004
Late loss (mm) 0.72±1.22 0.32±0.65 0.032
MLD, minimal lumen diameter.
Table 4. Predictors of Critical Events during the 5-Year Follow-Up Period
Univariate Multivariate
OR (95% CI) p value OR (95% CI) p value
<0.3 vs. 0.3≤LL≤0.6 1.66 (0.64-4.34) 0.301 1.86 (0.71-4.87) 0.209
>0.6 vs. 0.3≤LL≤0.6 3.32 (1.23-9.00) 0.018 3.17 (1.15-8.71) 0.026
Age, per yr 1.03 (1.00-1.06) 0.040 1.02 (1.00-1.06) 0.110
Female gender 0.46 (0.22-0.99) 0.048 0.52 (0.23-1.14) 0.102
Hypercholesterolemia 0.44 (0.18-1.04) 0.060 0.55 (0.23-1.33) 0.185
Diabetes mellitus 1.60 (0.90-2.86) 0.110 1.29 (0.69-2.41) 0.422
Chronic renal failure 4.52 (2.25-9.08) <0.001 3.29 (1.48-7.31) 0.003
Acute coronary syndrome 1.56 (0.88-2.85) 0.128 1.54 (0.85-2.79) 0.159
Long lesion (>28 mm) 1.89 (1.04-3.46) 0.038 1.88 (1.02-3.46) 0.042
OR, odds ratio; CI, confidence interval; LL, late loss.
sions with an angiographic LL >0.6 mm had significantly fewer uncovered struts, a greater risk of restenosis, and were more likely to require target-lesion revascularization; howev- er, they carried a lower risk of stent thrombosis. Based on the previous hypothesis-generation study, we proposed the safety margins of post-DES-placement angiographic LL between 0.3 mm and 0.6 mm in order to balance the risks of resteno- sis and stent thrombosis.
6In the present study, although the incidence of death or myocardial infarction (including stent thrombosis) was low- est in group II, statistical significance was not reached when compared with group I. We believe that several possible factors may explain these results. First, this study is retro- spective and non-randomized; therefore, it is intrinsically vulnerable to selection bias and other unobserved confound- ing factors. Second, the incidence of major adverse clinical events during the 5-year follow-up was low to achieve stat- ically significant differences. Third, the number of enrolled patients was relatively small. Lastly, neointimal growth may have been delayed after DES implantation, as several previ- ous animal studies suggest that, when compared with bare- metal stents, late neointimal growth may occur despite a marked early suppression of neointimal formation within DESs.
12,13Furthermore, neoatherosclerosis may also devel- op earlier in DES-treated lesions when compared to bare- metal stent-treated lesions. Data now demonstrate that al- though atherosclerotic changes often do not appear until 2 years after bare-metal stent implantation and remain a rare finding at 4 years, atherosclerotic changes-including foamy macrophage infiltration and early necrotic core formation- were observed in more than 40% of patients 9 months after sirolimus-eluting stent implantation.
14A more recent autop- sy study also reported that the incidence of neointimal ath- erosclerotic change was significantly greater in DES-treated lesions (31%) when compared to bare-metal stent-treated le- sions (16%).
15Another recent OCT study showed that rup- ture of lipid-laden neointima inside DES may be associated with late stent thrombosis after DES implantation.
16Ac- cordingly, it is unlikely that LL is the only factor affecting the dynamic process of neoatherosclerosis within DES-treat- ed lesions, and the causes of stent thrombosis and other car- diac events. The results presented here correlate well with previous studies, which demonstrated a negative relation- ship between LL and stent thrombosis.
17,18In conclusion, our hypothesis that an angiographic LL be- tween 0.3 and 0.6 mm may correlate with a lower incidence of critical events after DES placement was not supported by
Fig. 1. Using Kaplan-Meier curves, the incidence of clinical events of three groups according to angiographic late loss (<0.3 mm, between 0.3 and 0.6 mm and >0.6 mm) are shown. (A) Death or myocardial infarction free sur- vival rate. (B) Target vessel revascularization free survival rate. (C) Stent thrombosis free survival rate.
0.80
0.60
0.70 0.85
0.70 0.90
0.80
0.80 0.95
0.90
0.90 1.00
1.00
1.00
Death or myocardial infarction free survival rateTarget vessel revascularization free survival rateStent thrombosis free survival rate
0
0
0
360
360
360
720
720
720
1080
1080
1080
1440
1440
1440
1800
1800
1800 Follow up duration (days)
Follow up duration (days)
Follow up duration (days) Log rank p=0.022 over all 0.3-0.6 mm vs. <0.3 mm: p=0.296 0.3-0.6 mm vs. >0.6 mm: p=0.013
Log rank p<0.001 over all 0.3-0.6 mm vs. <0.3 mm: p=0.258 0.3-0.6 mm vs. >0.6 mm: p<0.001
Log rank p=0.434 over all 0.3-0.6 mm vs. <0.3 mm: p=0.812 0.3-0.6 mm vs. >0.6 mm: p=0.292
<0.3 mm 0.3-0.6 mm >0.6 mm
<0.3 mm 0.3-0.6 mm >0.6 mm
<0.3 mm 0.3-0.6 mm >0.6 mm
A
B
C
GA, et al. Clinical end points in coronary stent trials: a case for standardized definitions. Circulation 2007;115:2344-51.
10. Mauri L, Orav EJ, O’Malley AJ, Moses JW, Leon MB, Holmes DR Jr, et al. Relationship of late loss in lumen diameter to coro- nary restenosis in sirolimus-eluting stents. Circulation 2005;111:
321-7.
11. Brener SJ, Prasad AJ, Khan Z, Sacchi TJ. The relationship be- tween late lumen loss and restenosis among various drug-eluting stents: a systematic review and meta-regression analysis of ran- domized clinical trials. Atherosclerosis 2011;214:158-62.
12. Carter AJ, Aggarwal M, Kopia GA, Tio F, Tsao PS, Kolata R, et al. Long-term effects of polymer-based, slow-release, sirolimus- eluting stents in a porcine coronary model. Cardiovasc Res 2004;
63:617-24.
13. Farb A, Heller PF, Shroff S, Cheng L, Kolodgie FD, Carter AJ, et al. Pathological analysis of local delivery of paclitaxel via a poly- mer-coated stent. Circulation 2001;104:473-9.
14. Nakazawa G, Vorpahl M, Finn AV, Narula J, Virmani R. One step forward and two steps back with drug-eluting-stents: from pre- venting restenosis to causing late thrombosis and nouveau athero- sclerosis. JACC Cardiovasc Imaging 2009;2:625-8.
15. Nakazawa G, Otsuka F, Nakano M, Vorpahl M, Yazdani SK, La- dich E, et al. The pathology of neoatherosclerosis in human coro- nary implants bare-metal and drug-eluting stents. J Am Coll Car- diol 2011;57:1314-22.
16. Ko YG, Kim DM, Cho JM, Choi SY, Yoon JH, Kim JS, et al. Op- tical coherence tomography findings of very late stent thrombosis after drug-eluting stent implantation. Int J Cardiovasc Imaging 2012;28:715-23.
17. Takano M, Yamamoto M, Murakami D, Inami S, Okamatsu K, Seimiya K, et al. Lack of association between large angiographic late loss and low risk of in-stent thrombus: angioscopic compari- son between paclitaxel- and sirolimus-eluting stents. Circ Cardio- vasc Interv 2008;1:20-7.
18. Rivero F, Moreno R, Barreales L, Galeote G, Sánchez-Recalde A, Calvo L, et al. Lower levels of in-stent late loss are not associated with the risk of stent thrombosis in patients receiving drug-eluting stents. EuroIntervention 2008;4:124-32.
the results of this long-term clinical follow-up study.
REFERENCES
1. Tu JV, Bowen J, Chiu M, Ko DT, Austin PC, He Y, et al. Effec- tiveness and safety of drug-eluting stents in Ontario. N Engl J Med 2007;357:1393-402.
2. Stone GW, Moses JW, Ellis SG, Schofer J, Dawkins KD, Morice MC, et al. Safety and efficacy of sirolimus- and paclitaxel-eluting coronary stents. N Engl J Med 2007;356:998-1008.
3. Daemen J, Wenaweser P, Tsuchida K, Abrecht L, Vaina S, Morger C, et al. Early and late coronary stent thrombosis of sirolimus- eluting and paclitaxel-eluting stents in routine clinical practice:
data from a large two-institutional cohort study. Lancet 2007;
369:667-78.
4. Iakovou I, Schmidt T, Bonizzoni E, Ge L, Sangiorgi GM, Stankovic G, et al. Incidence, predictors, and outcome of throm- bosis after successful implantation of drug-eluting stents. JAMA 2005;293:2126-30.
5. Finn AV, Joner M, Nakazawa G, Kolodgie F, Newell J, John MC, et al. Pathological correlates of late drug-eluting stent thrombosis:
strut coverage as a marker of endothelialization. Circulation 2007;115:2435-41.
6. Kim BK, Kim JS, Ko YG, Choi D, Jang Y, Hong MK. Correlation of angiographic late loss with neointimal coverage of drug-eluting stent struts on follow-up optical coherence tomography. Int J Car- diovasc Imaging 2012;28:1289-97.
7. Kim U, Kim JS, Kim JS, Lee JM, Son JW, Kim J, et al. The initial extent of malapposition in ST-elevation myocardial infarction treated with drug-eluting stent: the usefulness of optical coherence tomography. Yonsei Med J 2010;51:332-8.
8. Pocock SJ, Lansky AJ, Mehran R, Popma JJ, Fahy MP, Na Y, et al. Angiographic surrogate end points in drug-eluting stent trials: a systematic evaluation based on individual patient data from 11 randomized, controlled trials. J Am Coll Cardiol 2008;51:23-32.
9. Cutlip DE, Windecker S, Mehran R, Boam A, Cohen DJ, van Es
![Table 1. Baseline Clinical and Angiographic Characteristic among the Three Groups 0.3 mm<LL (n=378) 0.3 mm≤LL ≤0.6 mm (n=124) LL>0.6 mm (n=134) p value Clinical variable Age (yrs) 59.3±9.6 61.1±10.5 60.6±9.9 0.144 Male [n (%)] 265 (70.1) 8](https://thumb-ap.123doks.com/thumbv2/123dokinfo/5487875.667594/4.892.84.791.122.868/table-baseline-clinical-angiographic-characteristic-groups-clinical-variable.webp)