J F E S
Journal of Forest and Environmental Science
Journal of Forest and Environmental Science Vol. 34, No. 2, pp. 119-125, April, 2018 https://doi.org/10.7747/JFES.2018.34.2.119
Basal Area-Stump Diameter Models for Tectona grandis Linn. F. Stands in Omo Forest Reserve, Nigeria
Onyekachi Chukwu* and Johnson S. A. Osho
Department of Forest Resources Management, University of Ibadan, Ibadan, Nigeria
Abstract
The tropical forests in developing countries are faced with the problem of illegal exploitation of trees. However, dearth of empirical means of expressing the dimensions, structure, quality and quantity of a removed tree has imped conviction of offenders. This study aimed at developing a model that can effectively estimate individual tree basal area (BA) from stump diameter (Ds) for Tectona grandis stands in Omo Forest Reserve, Nigeria, for timber valuation in case of illegal felling. Thirty-six 25 m×25 m temporary sample plots (TSPs) were laid randomly in six age strata; 26, 23, 22, 16, 14, and 12 years specifically. BA, Ds and diameter at breast height were measured in all living T. grandis trees within the 36 TSPs. Least square method was used to convert the counted stumps into harvested stem cross-sectional areas.
Six basal area models were fitted and evaluated. The BA-Ds relationship was best described by power model which gave least values of Root mean square error (0.0048), prediction error sum of squares (0.0325) and Akaike information criterion (-15391) with a high adjusted coefficient of determination (0.921). This study revealed that basal area estimation was realistic even when the only information available was stump diameter. The power model was validated using independent data obtained from additional plots and was found to be appropriate for estimating the basal area of Tectona grandis stands in Omo Forest Reserve, Nigeria.
Key Words: Dbh, models, Omo Forest Reserve, stump diameter, Tectona grandis
Received: September 1, 2017. Revised: January 16, 2018. Accepted: February 26, 2018.
Corresponding author: Onyekachi Chukwu
Department of Forest Resources Management, University of Ibadan, Oyo Road, Ibadan, Oyo State, Nigeria Tel: 234-80-3263-3835, Fax: 234-80-8250-9607, E-mail: [email protected]
Introduction
Illegal logging is a major problem facing tropical forests in developing countries. The Federal Ministry of Environ- ment (2016) estimated that Nigerian forests are being de- pleted at an annual rate of 3.5%. However, this depiction rate was attributed to illegal logging of timber species (Emeghara 2012; Ikuomola et al. 2016). Adebagbo (1992) reported that a in the year 1990, a total of 298 trees com- prising 19 different valuable species of unknown log di- mensions were illegally extracted from Supoba Forestry
Reserve in Edo State of Nigeria. Lack of empirical in- formation on the dimensions of trees removed from a forest could act as impediment in the conviction of offenders.
Hence, evidence backed up with relevant facts are neces- sary in judicial proceedings (Evidence Act 1990).
Basal area (BA) is important tree characteristic in forestry.
It is the common term used to describe the average amount of an area occupied by tree stem. However, basal area de- fined as the total cross-sectional area of all stems in a stand measured at breast height (1.3 m). Basal area is a useful in- dex for making timber harvest decisions and understanding
forest-wildlife habitat relationships. Basal area is used to de- termine more than just forests stand density; it is also linked with timber stand volume and growth (Barlow and Elledge 2012). Therefore, it is often the basis for making important forest management decisions such as estimating forest re- generation needs. Tree variables such as diameter at breast height (Dbh) and stump diameter (Ds) are easy to measure with simple instruments and widely used in forest inven- tories. However, a number of studies have shown that de- rived variables such as basal area, are good predictors of forest dynamics and they can improve the reliability of tools like growth and yield models. Hence, BA has received in- creasing attention as a means to estimate tree growth (Murphy and Shelton 1996; Chen et al. 2007).
According to Corral-Rivas et al. (2007) and Westfall (2010), numerous reasons could necessitate the reconstruc- tion of sizes of removed trees. These reasons include; re- viewing harvesting practices, assessing damage due to cata- strophic events, creating historical records of past manage- ment activities and establishing loss due to indiscriminate and/or illegal felling. Previous studies have shown that tree stump diameter (Ds) is highly correlated with diameter at breast height (Dbh), and as such have being used in place of Dbh to predict most tree growth variable especially in the case of illegal logging (Osho 1983; Westfall 2010; Özçelík et al. 2010; Shamaki and Akindele 2013; Chukwu et al. 2017).
The ability to develop models that can estimate tree growth variables from stem diameter for Tectona grandis will guide the forester manager on the estimation of the for- est stock (Shamaki and Akindele 2013), as well as quantifi- cation and valuation of a removed tree (Osho 1983;
Chukwu et al. 2017). Hence, there is need to evolve a method of predicting basal area of trees from stumps, which should be accurate and easily applicable, since basal area can be used as index in the estimation of growth and yield of the forest. This can be possible by using the regression be- tween stump diameter as independent variable and basal area as dependent variable.
However, this study aimed to develop models for pre- dicting basal area from stump diameter for T. grandis plan- tations in Omo Forest Reserve, Nigeria, which will serve as tool in estimation of timber lost, descriptive evidence for a removed tree cross-sectional area in litigation process as well as creating historical records of past management activities.
Materials and Methods
Study area
This study was carried out at Area J4 of Omo Forest Reserve in Ijebu-Ode East local government area of Ogun State, Nigeria. The Reserve is situated between Latitude 6°35' to 7°05 N and Longitudes 4°9' to 4°40' E with a total land area of 139,100 ha. The reserve is bounded by Benin- Shagamu expressway to the south and Omo River and Oni River to the east. The Reserve lies within the equatorial belt and has a mean annual rainfall of 1,200 mm and average el- evation of about 91.47 m (Alo 2016).
Tree species description
Tectona grandis (Teak) is a tropical hardwood trees spe- cies in the family Verbenaceae. The tree is deciduous, grows up to 30-40 m tall and usually large stem diameter (Robertson 2002). Teak is termed as one of the most val- uable timber species in the world owned to its outstanding physical properties (vigorous, straight, single stem with slight branches that leave minimal knot formation following pruning) and timber qualities (attractiveness in colour and grain, durability, lightness with strength, ease of seasoning without splitting and cracking, ease of working and carv- ing, resistance to termite, fungus, and weathering). Teak plantations have been widely established throughout the tropics from the 1850s, this is due to its high timber qual- ities which includes; market demand, ease of domestication and cultivation. The excellent properties and versatile na- ture of teak timber and its eminent suitability for an array of uses is well documented (FAO 1957; Kaosa-ard 1993;
Miranda et al. 2011). Hence, this species was selected for this present study based on its high rate of illegal felling in the study area which has been attributed to its market de- mand in the world.
Sampling procedure
This study was carried out in temporary sample plots (TSPs) of Tectona grandis stands of different age series; 26, 23, 22, 16, 14 and 12 years specifically. A stratified random sampling technique was employed for this study. The six age series constitute the strata in the study area with a total land area of 66.5 hectare. Hence, simple random sampling technique was used in allocating thirty six (36) TSPs of 25
Table 1. Summary statistics of tree growth variables
Variables Descriptive Statistics
N Min Max Mean SE SD
Ds 1919 7.67 48.97 22.08 0.15 6.55
Dbh 1919 6.01 38.85 17.93 0.12 5.38
BA 1919 0.0028 0.1185 0.0275 0.0004 0.0168
Where: SD, standard deviation; SE, Standard error; BA, basal area (m2); Dbh, diameter at breast height (cm); Ds, stump diameter (cm); N, total number of trees measured.
m×25 m size in the stands (six plots per age stratum). A to- tal number of one thousand nine hundred and nineteen (1919) trees were measured in all the thirty six randomly se- lected sample plots.
Data collection
Diameter tape was used to measure individual trees di- ameter (over bark) at breast height (cm) and stump diame- ter (cm) of T. grandis found within the sample plots. The point of the measurement was recorded from the uphill sides of the trees and on the inside of the lean for leaning trees (Husch et al. 1982). During the measurement, loose bark, climbers and epiphytes were lifted above the diameter tape. Finally, basal area was derived from Dbh as mathe- matically shown below:
(1)
Where: BA=Basal Area (m2); π=Pi is constant (3.143) and D2=Dbh (cm)
Model description and fitting
The available fitting data consists of measurements taken from trees located within different selected plots. Least square method was used to fit data using the various candi- date functions listed below. In this study, six basal area-stump diameter equations were proposed as candidate models for the basal prediction of T. grandis in the study area. These equations are listed accordingly as linear, single logarithm, double logarithm, power, growth and ex- ponential functions. As mathematically shown below:
BA=b0+b1Ds (2)
BA=b0+b1lnDs (3)
lnBA=b0+b1lnDs (4)
BA=b0Ds b1 (5)
BA=e(b0+b1Ds) (6)
BA=b0e(b1 Ds) (7)
Where: BA=Basal Area (m2), Ds=Stump diameter, b0
and b1=regression parameters, e=exponential and ln=
natural logarithm.
Model evaluation and validation
The evaluation of the candidate models was based on graphical and numerical analysis of the residuals which are;
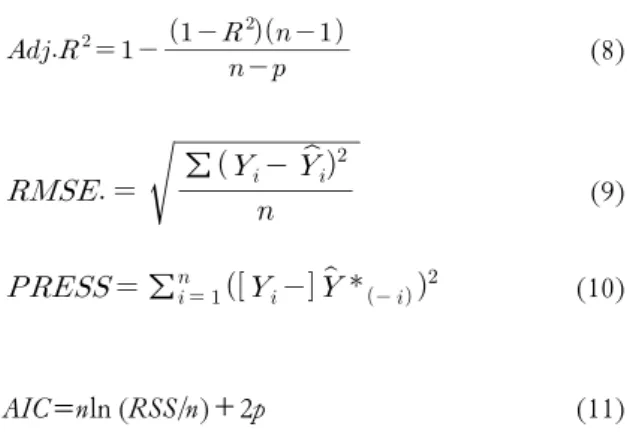
model with least values of the standard error of estimate (RMSE), prediction error sum of squares (PRESS), Akaike information criterion (AIC) and highest adjusted coefficient of determination (Adj.R2) was selected as best. They are mathematically expressed as follows:
(8)
∑
(9)
∑ (10)
AIC=nln (RSS/n)+2p (11)
Where; =arithmetic mean of the observed value, = observed value of Y for observation i, =predicted value
Table 3. Examined Crown-Stump Diameter Models
Model Code Function Fit Statistics
Adj.R2 RMSE PRESS AIC
B1 BA=−0.026+0.002Ds 0.888 0.0056 0.0459 -14895
B2 BA=−0.123+0.049lnDs 0.792 0.0077 0.0853 -14001
B3 lnBA=−9.784+1.973lnDs 0.947 0.1421 29.066 -5611
B4 BA=0.0001×Ds1.966 0.921 0.0048 0.0325 -15391
B5 BA=e(−5.191+0.068Ds)
0.891 0.0056 0.0448 -14930
B6 BA=0.006×e(0.068Ds) 0.891 0.0061 0.0529 -14930
Where: Adj.R2, adjusted coefficient of determination; PRESS, prediction residual error sum of squares; RMSE, root mean square error sta- tistics; AIC, Akaike information criterion; BA, basal area (m2); Ds, stump diameter; and ln, natural logarithm. N=1439.
Table 2. Correlation matrix of tree growth variables
Ds Dbh BA
Ds 1 0.96* 0.94*
Dbh 0.96* 1 0.98*
BA 0.94* 0.98* 1
*Correlation coefficient is significant at the 0.05 level (2-tailed), N=265. BA, basal area (m); Dbh, diameter at breast height (cm);
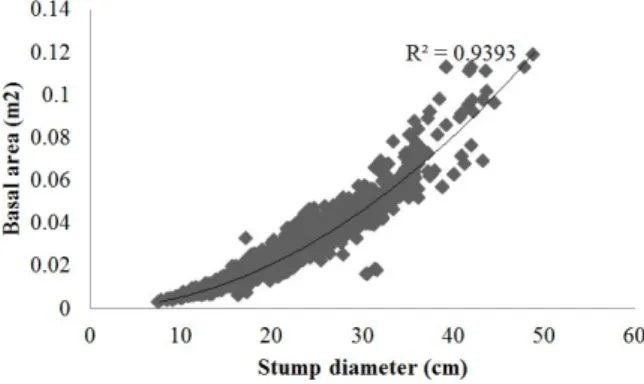
Ds, stump diameter (cm). Fig. 1. Relationship between basal area and stump diameter.
i, =predicted value of Y for observation i as calcu-
lated from a regression equation derived through fitting the p parameter model to data obtained by deleting observation i from the original data set, n=the total number of ob- servations (trees) used in fitting the model, p=the number of model fixed parameters, RSS=Residual sum of square.
The overall best candidate model was validated using an independent data of about 25% of the data used for the model calibration and fitting. The t-test for paired samples was adopted as model validation method. In all statistical analysis, a confidence level of p<0.05 was used for stat- istical significance.
Results
Summary statistics for tree growth variables The data used in this study comprise of tree growth vari- ables measured from 36 TSPs of Tectona grandis stands in the Omo Forest Reserve, Nigeria. A total of 1919 trees were measured and summary statistics of the data used in this study are presented in (Table 1). The distribution of
stump diameter (Ds) ranged from 7.67 to 48.97cm, Dbh ranged from 6.01 to 38.85 cm and BA ranged from 0.0028 to 0.1185 m2. The result of Pearson’s product-moment cor- relation analysis between BA, Ds and Dbh (Table 2) re- vealed that Ds is highly and positively correlated with Dbh and BA (r=0.96 and 0.94 respectively). The graphical re- lation between the explanatory variable (Ds) versus re- sponse variable (BA) was displayed in Fig. 1. The scatter plot (graph) showed a curve-linearly relationship between basal area and stump diameter of T. grandis in the study area.
Basal area–Stump diameter Models
The models developed in this study was to estimate the present and future values of basal area at individual tree lev- el for T. grandis stands in Omo Forest Reserve, Nigeria.
The models were developed using individual tree stump di- ameter as independent variable and basal area as dependent variable (Table 3). All parameters were found to be sig-
Table 4. Results of Validation of Model 3 using t test for Paired Sample
Variable Mean SD Diff t Df p Remark
Cd Observed 0.02694 0.01646
Cd Predicted 0.02653 0.01598 0.00042 1.648 479 0.1001 ns
SD, standard deviation; Diff, hypothesized mean difference; df, degree of freedom; p, probability value; ns, not significant at 0.05. N=480.
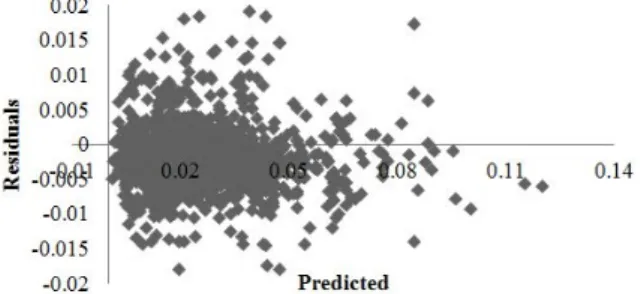
Fig. 2. Residual plot of basal area for power model (Model B4) using stump diameter as independent variable.
nificant at the 5% level of probability. On the basis of esti- mated Adj.R2 values, about 79.2 to 94.7% of the total varia- tion in observed Basal area values was explained by Stump diameter in the six candidate models.
Out of the six models fitted using Ds as independent var- iable; the power model (B4) gave the least values of RMSE (0.0048), PRESS (0.0325) and AIC (-15391) and a high Adj.R2 (0.921). However, the double logarithmic function (Model B3) gave the highest values RMSE (0.1421), PRESS (0.0325), AIC (-5611) and Adj.R2 (0.947).
Fig. 2 showed the graph of the residuals distribution against the predicted of basal area (Model B4).
Model validation
Table 4 shows the result of the validation of the best model (equation 5).
The validation test shows that observed value was not sig- nificantly different from the predicted value of natural loga- rithm of basal area at probability level of 0.05.
Discussion
In this study, information on the tree growth variables (Ds and BA) from Area J4 in Omo Forest Reserve was pre- sented in Table 1 and Fig. 1. However, correlation analysis
was carried out on the dataset before models were devel- oped to understand the association between stump diame- ter, Dbh and basal area. Stump diameter showed strong positive correlation with diameter at breast height and basal area. This infers that Dbh and BA increase with the in- crease in stump diameter. The result of the correlation fur- ther implies that, the larger the stump diameter of a tree;
the larger the cross sectional area the tree's stem occupies at breast height (1.3 m). Observation from the graphical anal- ysis for basal area showed a curve linear relationship with stump diameter.
Conversely, in this study effort was directed towards ob- taining basal area prediction models at individual tree basis using stump diameter. Correlation result (Table 2) revealed that Dbh was positive and highly correlated with Ds.
However, this result is in congruent the report of Oyebade and Onyambo (2011) and Shamaki and Akindele (2013) that diameter at breast height (Dbh) and stump diameter (Ds) are highly correlated. Hence, to avoid co-linearity be- tween the two growth variables (Ds and Dbh) as indicated by Huang et al. (2003), only stump was selected as in- dependent variable for developing models in this study. The principle of using stump diameter alone was to help forest managers obtain information on the original structure of a forest after exploitation either by legal or illegal activities within the forest. This method was upheld by Osho (1983), Westfall (2010), Özçelík et al. (2010) and Shamaki and Akindele (2013) stating that, estimating tree growth varia- bles after exploitation can only be possibly done through the stumps diameter.
The BA-Ds models fitted in this study were in linear, single logarithmic, double logarithmic, power, and ex- ponential functions form (Equations 2-7, respectively). All parameters were found to be significant at the 5% level of probability. On the basis of estimated Adj.R2 values, about 79.2 to 94.7% of the total variation in observed Basal area
values was explained by Stump diameter in the candidate models. This implies that all the candidate models had good and similar performance. The criteria adopted for selecting the best model was through comparison of Adj.R2, SEE, PRESS and AIC which are standard ways of verifying models predictive ability as pointed out by Li et al. (2002), Huang et al. (2003) and Shamaki and Akindele (2013).
Based on the model evaluation result, the power model (B4) was selected out of the six candidate models. Model B4 had the least values of; SEE, PRESS and AIC with a high Adj.R2. This result was similar to report of Tewari and Singh (2008) that developed basal area projection model for unthinned pure even-aged plantations of Eucalyptus hybrid in Gujarat State of India. Similar result was also re- ported by Murphy and Shelton (1996) who modeled in- dividual-tree basal area growth for loblolly pine. Elledge and Barlow (2012) recommended prediction of basal area and further stated that, basal area determines more than just stand density; it is also linked with timber volume and tree growth. Therefore, it is often the basis for making im- portant forest management decisions such as estimating forest regeneration needs. In the same vein, the perform- ance of power model in this study was in no doubt justified by the theories in plant science; that many structure and functional variables of organisms (Y) scale as power func- tions of measures of sizes (X) such as body mass, length, di- ameter, area, and volume (Norberg 1988; West et al. 1999;
Enquist 2002; Chen et al. 2007).
Therefore, all the evaluation criteria (Adj.R2, SEE, PRESS and AIC) were considered in the selection of the models. The higher the Adjusted R2 value the better the model, also the lower the SEE, PRESS and AIC the better the model. The efficiency of this procedure was confirmed by Akindele (1985) and Odunlami (1992). Furthermore, independent data set not used in the models calibration was used to validate the model. The paired t-test was used to test for significance between predicted and the observed basal areas. The result showed a non-significant difference.
This indicates that the developed BA-Ds model (B4) was valid for estimating basal area of T. grandis stands in the study area.
Conclusion
Predicting tree growth characteristics from stump diam- eter can aid the reconstruction of sizes of removed trees.
These includes; reviewing harvesting practices, assessing damage due to catastrophic events, creating historical re- cords of past management activities, and establishing loss due to timber trespass. Hence, stump diameter was there- fore, used as the only independent variable owing to its strong positive correlation with Dbh as asserted by this study. Thus, both Dbh and Ds can be used interchangeably.
This study concludes that, individual tree basal area can be estimated from stump diameter using the power func- tion (Model B4) in an event of indiscriminate and/or illegal felling in Omo Forest Reserve, Nigeria. Furthermore, in- clusion of other stump variables (stump basal area and stump height) as independent variables is recommended for further study. Hence, stump diameter should be taken at several points above and below 0.3 m.
References
Adebagbo CA. 1992. Illegal felling: An Environmental Degrad- ation Activity (case study: Sapoba Forest Reserve), Proceedings of the 22nd Annual Conference of the Forestry Association of Nigeria, 2nd - 7th November, Kano, Nigeria.
Akindele SO. 1985. The development of various linear volume equations for Teak in Gambari Forest Reserve. Unpublished B.Sc. Project. University of Ibadan, Nigeria. pp. 1-72.
Alo AA. 2016. Development of Digital Elevation Models for Omo Forest Reserve Nigeria, Forestry and Allied Natural Resources Disciplines in Nigerian Institutions: Inputs for Future Solutions to Dwindling Forest Estate in Nigeria. Proceedings of the 1st Commonwealth Forestry Association (CFA) Conference, Nigeria Chapter. pp. 357-363.
Chen Q, Gong P, Baldocchi D, Tian YQ. 2007. Estimating basal area and stem volume for individual trees from lidar data.
Photogramm Eng Remote Sens 73: 1355-1365.
Chukwu O, Dau JH, Ezenwenyi JU. 2017. Crown-stump diame- ter model for parkia biglobosa benth. Species in Makurdi, Benue State, Nigeria. J Trop For Environ 7: 43-53.
Corral-Rivas JJ, Barrio-Anta M, Aguirre-Calderón OA, Diéguez- Aranda U. 2007. Use of stump diameter to estimate diameter at breast height and tree volume for major pine species in El Salto Durango (Mexico). Forestry 80: 29-40.
Elledge J, Barlow B. 2012. Basal Area: A measure made for management. Alabama Cooperative Extension System. ANR- 1371. https://store.aces.edu/DisplayImage.aspx?ProductID=13433&
size=large Assessed 13 May 2017.
Emeghara EE. 2012. Forestry: a veritable tool for sustainable rural development in Nigeria. Int J Agric Rural Dev 15: 953-957.
Enquist BJ. 2002. Universal scaling in tree and vascular plant all- ometry: toward a general quantitative theory linking plant form and function from cells to ecosystems. Tree Physiol 22: 1045- 1064.
Evidence Act. 1990. Chapter 112: Laws of the Federation of Nigeria 1990. http://www.nigeria-law.org/EvidenceAct.htm. Accessed on 31 Aug 2017.
FAO. 1957. Report on teak growing under exotic conditions.
FAO/TSC57/3, FAO, Rome.
Federal Ministry of Environment. 2016. Nigeria National Policy on the Environment (REVISED 2016). http://environment.
gov.ng/media/attachments/2017/09/22/revised-national-policy- on-the-environment-final-draft.pdf Accessed on 21 Nov 2017.
Huang S, Yang Y, Wang Y. 2003. A Critical look at Procedures for Validating Growth and Yield Models. In: Modeling Forest Systems (Amaro A, Reed D, Soares P, eds). CABI Pub, Wallingford, UK, pp. 271-294.
Husch B, Miller CI, Beers TW. 1982. Forest mensuration. John Wiley & Sons, New York.
Ikuomola AD, Okunola RA, Akindutire AF. 2016. Criminality:
Illegal Logging of Woods in Nigeria’s South-West Forest Belt.
Afr J Criminol Justice Stud 9: 141-153.
Kaosa-ard A. 1993. Teak international provenance trials I. Growth and stem quality. In Proceedings "50th Year of Huay Tak Teak Plantation: Teak Seminar" pp 113-129.
Li B, Morris J, Martin EB, 2002. Model selection for partial least squares regression. Chemom Intell Lab Syst 64: 79-89.
Miranda I, Sousa V, Pereira H. 2011. Wood properties of teak (Tectona grandis) from a mature unmanaged stand in East Timor. J Wood Sci 57: 171-178.
Murphy PA, Shelton MG. 1996. An individual-tree basal area
growth model for loblolly pine stands. Can J For Res 26:
327-337.
Norberg A. 1988. Theory of growth geometry of plants and self- thinning of plant populations: geometry similarity, elastic sim- ilarity, and different growth modes of plants Parts. Am Nat 131:
220-256.
Odunlami BA. 1992. Development of volume equations for Gmelina arborea plantation in Oluwa Forest Reserve. Unpu- blished B. Agric (Teh) project FUT Akure, pp 1-66.
Osho JSA. 1983. Volume prediction from stump diameter for teak (Tectona grandis L.f.) in onigambari forest reserve. Nig J For 13: 53-56.
Oyebade BA, Onyambo E. 2011. Height-diameter predictive equa- tions for rubber (Hevea brasilliensis-A. Juss- Muell) Plantation, Choba, Port-Harcourt, Nigeria. J Agric Soc Res 11: 1-11.
Robertson B. 2002. Growing Teak in the Top End of the NT. Ag note 812 No G26.
Shamaki SB, Akindele SO. 2013. Volume estimation models from stump diameter for Teak (Tectona grandis Linn f.) plantation in Nimbia forest reserve, Nigeria. J Environ Sci Water Resour 2:
89-94.
Tewari VP, Singh B. 2008. Potential density and basal area pre- diction equations for unthinned Eucalyptus hybrid plantations in the Gujarat state of India. Bioresour Technol 99: 1642-1649.
West GB, Brown JH, Enquist BJ. 1999. A general model for the structure and allometry of plant vascular systems. Nature 400:
664-667.
Westfall JA. 2010. New models for predicting diameter at breast height from stump dimensions. North J Appl For 27: 21-27.
Özçelík R, Brooks JR, Diamantopoulou MJ, Wiant HV Jr. 2010.
Estimating breast height diameter and volume from stump di- ameter for three economically important species in Turkey.
Scand J For Res 25: 32-45.