Environmental Science
Vol. 30, No. 4, pp. 315-321, November, 2014 http://dx.doi.org/10.7747/JFES.2014.30.4.315
Development of Site Index Equation and Curves for Site Quality Assessment of Pinus caribea Monoculture Plantations in Southwestern Nigeria
Bukola Amoo Oyebade1,*, Johnson Sunday Ajose Osho2 and Peter Oluremi Adesoye2
1Department of Forestry & Wildlife Management, University of Port Harcourt, Port Harcourt 500102, Nigeria
2Department of Forest Resources Management, University of Ibadan, Ibadan 200213, Nigeria
Abstract
Forest timber production potential of any site is oftentimes measured quantitatively by site index, which is defined as dominant height of a particular stand at a specified age. A site index was developed for estimating site quality of monoculture Pinus caribaea plantations in southwestern Nigeria using a base age of 25 years. Dominant height data were collected from 60 Temporary Sample Plots (TSPs) of 20x20 m in plantations of 15 to 37 years. Linear and non-linear models as been widely applied in quantitative forest measurements were fitted to dominant height- age data and the best site index equation is : SI=Exp(InHd-23.495 (A -0.04)
. The site index curves constructed for the three sites (Omo Forest Reserve - OFR (J4), Oluwa Forest Reserve - OLFR and Shasha Forest Reserve - SFR) across the southwestern Nigeria using the chosen equation revealed that a 15 year old Pinus caribaea in the study area attained average dominant heights of 25, 22 and 21 m in OFR (J4), OLFR and SFR respectively. The site index equation and curves proffer veritable insight into better silvicultural options and management practices for the future plantations suitable sites.
Key Words: site quality, dominant height, index age, Pinus caribaea, timber production potential
Received: June 30, 2013. Revised: March 27, 2014. Accepted: August 5, 2014.
Corresponding author: Bukola Amoo Oyebade
Department of Forestry & Wildlife Management, University of Port Harcourt, Nigeria Tel: 07034464789, Fax: 2347034464789, E-mail: [email protected]
Introduction
The importance of site quality assessment remains im- perative in quantitative forestry, simply for its potential and possibility of determining the productive capacity of the plantations area for sustainable management. Site index has traditionally been defined as the top height of a stand at a particular age (Clutter et al. 1983). According to Hägglund (1981) the top height is the arithmetic mean height of the 100 trees ha-1 with the greatest diameters. Heights of in- dividual trees can be measured easily and the average height
growth of the dominant trees is less affected by thinning op- erations (Bailey and Clutter 1974; Clutter et al. 1983) and also less affected by stand density (Monserud 1984).
The importance of site index and its curves expression can never be over-emphasized. The curves are extensively used by foresters for site quality description and evaluation as well as in estimating potential productivity of forest sites (Hägglund 1981). The application of site index curves is based on the fact that there is a association between stand height and total volume production (Beamont 1999) with plausible notion of where there is high quality sites, height
-2
Fig. 1. Map of Southwestern Ni- geria showing location of Oluwa, Omo and Shasha Forest Reserves of the study area.
growth is good (Bailey and Clutter 1974; Clutter et al.
1983).
Pinus caribaea has been identified as a medium-growing tree that reaches 45 m in height and more than 1 m diame- ter at breast height (d.b.h). The shafts are generally straight and free of branches. The bark is thick with wide fissures and is reddish brown to ashy brown. Pinus caribaea as a pe- culiar variety has fascicles of three, and in the young trees these fascicles have four to six acicular leaves. The acicular leaves are 15 to 25 cm long and 1.5 mm wide; they are stiff and finely serrated, dark green to yellowish green, and cov- ered with white stripes of stomata. The tree has a pivot root in deep soils, and superficial roots in slightly deep soils. It adapts very well to a wide variety of environments, includ- ing degraded, poor, lixiviated, rather low soils with good drainage (Lamprecht 1990). The species grows well in acid sandy soils (pH 4.3 to 6.5) and, to a lesser degree, san- dy-clayey soils. Generally, moisture in the soil determines development more than the availability of nutrients. The tree grows well in oxisol soils that are not very deep, are sa- turated with water during the rainy season, and are very dry in the rainless season. In wet climates of the Tropics the spe- cies tends to form foxtail. It can tolerate drought for up to 6 months and sporadic floods. However, drought can also cause large losses in young stands (Lamprecht 1990).
Though several works have been recorded on site quality assessment of some exotic species in Nigeria and many Sub- Saharan Africa countries (Akindele 1990, 1991;
Malende and Temu 1990; Onyekwelu 1998; Teshome and Petty 2000; Onyekwelu 2003), there exists paucity of re- search on site quality assessment of Pinus caribaea and no equation has been developed for assessing the relative pro- ductive capacity of Pinus caribaea plantations in Nigeria.
This study was aimed at developing site index curves for site quality assessment of Pinus caribaea monoculture plan- tations in three southwestern Forest Reserves, Nigeria.
Obviously, the site index curves resulting from this study will be significant in determining the productive capacity of both current and future management plans of Pinus caribaea in Nigeria.
Materials and Methods
Study area
The study areas are Omo (J4) Forest Reserve, Shasha Forest Reserve and Oluwa Forest Reserve pine plantations.
The Omo Forest Reserve is located between latitudes 6o 421 and 7o 001 N and longitude 4o 171 and 4o 251 E. Similarly, the Oluwa forest reserve geographically lies within latitude 6o55' and 7o20'N and longitude 3o45' and 4o32'E while Shasha Forest Reserve is situated in the Ife South Local Government Area of Osun State, Nigeria. It has landed area coverage of about 310.798 km2 or 31,079.857 ha and geographically located on 70 and 70 10' N and 40 20' and 40 40'E (Fig. 1).
Sampling Procedure and data collection
Sixty Temporary Sample Plots (TSPs) of size 20x20 m each and of different Age (A) series based on stocking den- sity were sampled from Omo Forest Reserve (16 TSPs -15 and 21 years), Oluwa Forest Reserve (36 TSPs-18, 20, 35, 36 and 37 years) and Shasha Forest Reserve (8TSPs-27 years) in Ogun, Ondo and Osun States respectively using stratified random sampling method. In each plot, the diam- eter at breast height (dbh) and height measurements of all the trees were measured from where four largest trees per plot were selected as representative of 100 largest trees per plots. The average height of the four largest trees in a plot was referenced as the dominant height for every plot and the plantation age according to the year of establishment of the species was used as stand age.
Development of site index equation
Though several methods have been developed and ap- plied, the method used by Akindele (1990) was adopted in this study following its simplistic procedures of develop- ment of site index equation for estimating the site indices of the sample plots, the computation of site index values of the corresponding sample plots, and fitting of the linear re- gression model for predicting site index from the growth characteristics variables with agreement of linearized re- gression function of Schumacher (1939) for site index esti- mation of the order:
Hd=exp (bo+b1(A-1) eqn.1
Where,
Hd=average dominant height A=Stand Age
bo-b1=Regression coefficients
Taking the logarithm of the equation, the equation be- comes:
lnHd=bo+b1A-1 eqn.2
Fitting the equation to dominant height data when A equals the index age (25 years); the average dominant
height (Hd) will be equal to site index (SI). Twenty Five Tabl
e 1. Growth characteristics among different whole stand ages Whole stand growth characteristic
Whole stand age 15 years18 years20 years21 years27 years35 years36 years37 years SV/ha AVTHT AVSC AVMHT AVDBH CPA/ha
306.54±16.78b,c 9.99±0.18a 55.56±1.06a 8.58±0.11a 18.96±0.49a 8,294.08±545.19ac
195.60±46.23a 13.82±1.01b 69.74±4.29d 12.02±0.89b 20.62±0.99a,b 3,653.3±1,510.12a,b,c
255.63±24.11a,b 14.65±0.24b,c 82.89±1.81e 12.93±0.46b,c 18.70±0.59a 9,090.50±4,690.01c
242.22±16.81a,b 10.14±0.15a 46.98±1.52b 8.97±0.19a 22.86±0.75b,c 5,218.59±581.76a.b.c
413.53±49.17c 14.15±0.23b 62.37±1.74c 12.19±0.20b 24.08±0.67b,c 4,449.06±520.26a,b,c
365.34±28.05c 15.57±0.39c 64.92±1.85c,d 13.51±0.38c 26.08±0.87c 3,385.03±441.51a,b
352.53±23.52c 17.36±0.28d 51.96±2.95a,b 15.35±0.28d 35.92±1.55d 1,736.41±160.25b
443.41±36.17c 17.27±0.25d 51.33±1.69a,b 15.35±0.27d 36.19±2.45d 1,774.03±345.03b Means with the same superscripts (alphabets a-d) along the rows are not significantly different at p>0.05. These show the means comparison across the age series.
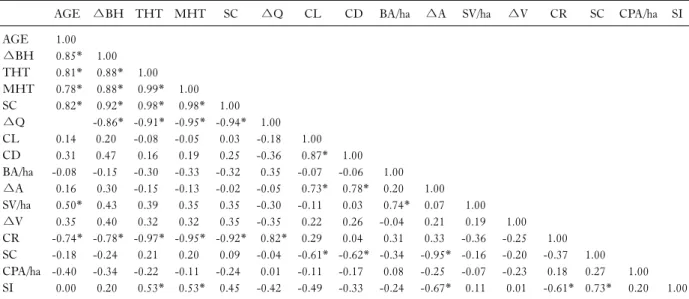
Table 2. Correlation matrix for whole stand growth characteristics
AGE ∆BH THT MHT SC ∆Q CL CD BA/ha ∆A SV/ha ∆V CR SC CPA/ha SI
AGE
∆BH THT MHT SC
∆Q CL CD BA/ha
∆A SV/ha
∆V CR SC CPA/ha SI
1.00 0.85*
0.81*
0.78*
0.82*
0.14 0.31 -0.08 0.16 0.50*
0.35 -0.74*
-0.18 -0.40 0.00
1.00 0.88*
0.88*
0.92*
-0.86*
0.20 0.47 -0.15 0.30 0.43 0.40 -0.78*
-0.24 -0.34 0.20
1.00 0.99*
0.98*
-0.91*
-0.08 0.16 -0.30 -0.15 0.39 0.32 -0.97*
0.21 -0.22 0.53*
1.00 0.98*
-0.95*
-0.05 0.19 -0.33 -0.13 0.35 0.32 -0.95*
0.20 -0.11 0.53*
1.00 -0.94*
0.03 0.25 -0.32 -0.02 0.35 0.35 -0.92*
0.09 -0.24 0.45
1.00 -0.18 -0.36 0.35 -0.05 -0.30 -0.35 0.82*
-0.04 0.01 -0.42
1.00 0.87*
-0.07 0.73*
-0.11 0.22 0.29 -0.61*
-0.11 -0.49
1.00 -0.06 0.78*
0.03 0.26 0.04 -0.62*
-0.17 -0.33
1.00 0.20 0.74*
-0.04 0.31 -0.34 0.08 -0.24
1.00 0.07 0.21 0.33 -0.95*
-0.25 -0.67*
1.00 0.19 -0.36 -0.16 -0.07 0.11
1.00 -0.25 -0.20 -0.23 0.01
1.00 -0.37 0.18 -0.61*
1.00 0.27 0.73*
1.00 0.20 1.00 AGE, Stand age; ∆BH, Stem diameter growth at breast height (cm/year); THT, Mean total height; MHT, Mean merchantable height; SV, Stand volume/ha; ∆A, Basal area (m2/year); BA, basal area/ha; SC, Slenderness coefficient; ∆PA, Crown projection area/ha; CR, Crown ratio; SQ, Stem quality; ∆Q, Stem quality (m/year); CL, Crown length; CD, Crown diameter; SI, Site Index (Marked correlations are sig- nificant at p<0.05).
(25) years was therefore used as an index age for this study, being a nominated age within the range of the plantation in the study area.
Thus
bo=lnHd-b1A-1 eqn.3
bo=ln(SI)-b1(25-1) eqn.4
Note that (25-1)=0.04
lnHd=ln(SI)-b1(0.04)+b1(A-1) eqn.5
lnHd=ln(SI)+b1(A-1-0.04) eqn.6
Making the SI the subject of the formula
Ln(SI)=lnHd-b1(A-1-0.04) eqn.7
Therefore,
SI=exp[lnHd-b (A )]
eqn.8 The above equation was conveniently used for site index estimation with known values of age and dominant age.
Results
The results of test of significance and the analysis of var- iance between the growth characteristics according to the age of the species at the whole stand level are shown in Table 1. The results showed significant variations among the growth characteristics across the years of evaluation.
Table 2 showed the linear correlation analysis at the whole stand level and revealed that there was high association be- tween tree age and other growth characteristics such as di- ameter at breast height, tree total height and merchantable height as well as slenderness coefficient. Stem age however revealed negative association with stem quality and crown ratio; indicating that as the tree age increases, these two var- iables significantly decrease. Slenderness coefficient at the whole stand is highly associated tree total height and mer- chantable height with correlation coefficients of r=0.98 and 0.99 respectively. Linear association only existed be- tween stand site index and slenderness coefficient sig- nificantly above all other growth characteristics within the whole stand level (Table 2).
The results of the site indices computed for this study and the parameters for the site index model used are shown
-1-0.04 -1
Table 3. Site index equation, model parameter and computed site index (SI) according to sites in the study area
Site
Average dominant
height
SI Site index model Model parameter R2 Oluwa FR
Shasha FR Omo FR
41.327 40.119 46.217
3.7215 3.6919 3.8333
lnHd=bo+b1A-1 b0=4.211 b1=23.495 0.9848 Hd, dominant height; SI, site index; FR, Forest Reserve; R2, co- efficient of determination; SEE, standard error of the estimate; b0
& b1 are model coefficients.
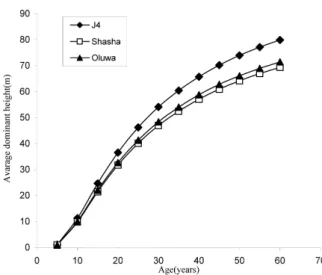
Fig. 2. Site index curves for Pinus caribaea in the three plantations of the study area.
in Table 3, while the values generated for dominant height between the stands are shown in Fig. 2. The curves as shown in Fig. 2 show that a 15 years old Pinus caribaea will attained dominant height of about 21 m average (Shasha Forest Reserve) and at least 25 m on the best site (Omo Forest Reserve -J4). This shows that Pinus caribaea would grow well in the dry high forest area of southwestern Nigeria.
Discussion
The site quality evaluation in this study revealed sig- nificant variations in the site index equations and curves be- tween the three contiguous study sites (Omo Forest Reserve Pine plantation, Shasha Forest Reserve Pine plan- tation and Oluwa Forest Reserve Pine plantations) with Omo Forest Reserve pine plantation having the highest site index among the three sites of the study area. This is in agreement with previous observations on site index study with possible variations among the site quality classes which ultimately describe the productivity of the categories of site worked in the study (Wang et al. 2008; Waring et al. 2006;
Johansson 1995). Akindele (1991) reported that for many exotic species in Nigeria, the leading factors that may re- sulted in such good growth seem to be the climate and rela- tive good soil. Essentially, the study of Huebschmann and Martin (1996) was in consonant with the trend of findings in this study which emphasized the essence of site index as being most importantly used in determining which stands to manage and that the stands with high site indexes pro- duce merchantable timber in a shorter time period than do stands with low indexes such that the former are more eco-
nomical to manage.
Site index concept remains a concomitant concept on the evaluation of site quality both in the tropical and temperate regions of the world. Waring et al. (2002) gave a plausible results on the assessment of site index and forest growth ca- pacity across the pacific and inland Northwest USA with a MODIS satellite- derived vegetation index with significant site equations of best fit indexes which similarly agrees with the findings in this study. Furthermore, the Omo Forest Reserve site index curve was in consonant with observation of Mahtatalo (2004) which observed that the development of site index models and site curves explanation of the site by site index concept of a shade-tolerant (dominant) tree species depends on mean tree size in the stand rather than on stand age. His study was also supported by Mahtatalo (2004) who observed that site properties affect the develop- ment rate of a forest stand; such that stands on poor sites develop more slowly and for longer than stands on rich sites. These revelations were similar to the observations in Omo Forest Reserve, Shasha Forest Reserve and Oluwa Forest Reserve with Omo having the highest site index and thus with greater possibility of highest merchantable timber production over Shasha and Oluwa Forest Reserve. On the factor of soil properties differentiation, the study of Johansson (1995) on Norway Spruce on farmland with dif- ferent soil types indicated similar results as it aligned with the report of Johansson (1995) who worked on European
Aspen growing forestland of different soils in Sweden.
However, Wang et al. (2008) reported that the tendency for a predictor age being derived, the closer be the base age among the plantation species, the higher the accuracy that would likely be obtained when he studied pine plantation of Taiwan using base age of 25 years. This site index curves produced for this study was on similar threshold of base age of 25 years, and was in consonant with the previous studies (Johansson 1995; 1996; 2012; Wang et al. 2008; Swenson et al. 2005).
Again, the base age of 25 years used for the development of the site index curves in this study was very suitable for any site quality study on Pinus caribaea since the base age is essential and always chosen to extrapolate rotation age of many tropical tree species (Teshome and Petty 2000;
Onyekwelu and Fuwape 1998; Curtis et al. 1974). The re- sults of the study showing pine plantation at Omo Forest Reserve having the highest height growth site curves over Shasha and Oluwa Forest Reserve pine plantations was in consonant with the study of Clutter et al. (1983) when he reported that site index curves of high height growth was an indication of a good site quality. Thus, the best site quality was found to be at Omo Forest Reserve whereas the poorest was presumably was at Oluwa Forest Reserve pine plantation.
This revelation about Omo Forest Reserve corresponds with the study of Onyekwelu (2005) on site index curves for site quality assessment of Nauclea diderrichi mono- culture plantation in Omo Forest Reserve, with several classes of sites considered found to be best for the species and the species growing on better site of high potential of higher volume production. Unarguable, the Omo Forest Reserve pine plantation was monoculture, and the study suggests that the Omo Forest Reserve site invariably would produce better volume (yield) of Pinus caribaea with the highest site index curves of height growth than any other pine plantation observed in this study. The plausible good of Omo Forest Reserve site quality as revealed by the re- sults of site index curves could be relevant in projection for possible large-scale establishment of more pine plantations around Omo Forest Reserve areas. The results could also be used as a guide in making reasonable management deci- sions on such established plantation.
References
Akindele SO. 1991. Development of a site index equation for teak plantations in southwestern Nigeria. Journal of Tropical Forest Science 4: 162-169.
Akindele SO. 1990. Site quality assessment and yield equations for teak plantations in the dry forest area of Nigeria. Ph. D. Thesis.
University of Ibadan, Ibadan, Nigeria.
Bailey RL, Clutter JL. 1974. Base-age invariant polymorphic site curves. Forest Science 20: 155-159.
Beaumont JF, Ung CH, Bernier-Cardou M. 1999. Relating site index to ecological factors in black spruce stands: tests of hypotheses. Forest Science 45: 484-491.
Clutter JL, Fortson JC, Pienaar LV, Brister GH, Bailey RL. 1983.
Timber management: a quantitative approach. Wiley, New York, N.Y, pp 333
Hägglund B. 1981. Evaluation of forest site productivity.
Commonwealth Forestry Bureau. Forest Abstracts Review Article 42: 515-527.
Huebschmann M, Martin J. 1996. Estimating and interpreting site index. G3361 Lake States Woodlands. University of Wisconsin Report Paper. pp 4.
Johansson T. 1995. Site index curves for Norway spruce plantations on farmland with different soil types. Studia forestalia Suecica, 198. pp 19.
Johansson T. 1996. Site index curves for European aspen (Populus tremula L.) growing on forest land of different soils in Sweden.
Silva Fennica 30: 437-458.
Johansson T. 2012. Site Index Curves for Young Hybrid Larch Growing on Former Farmland in Sweden. Forests 3: 723-735.
Lamprecht H. 1990. Silvicultura en los trópicos: los ecosistemas forestales en los bosques tropicales y sus especies arbóreas : pos- ibilidades y métodos para un aprovechimiento sostenido. Deut- sche Gesellschaft für Technische Zusammenarbeit, Eschborn, pp 340.
Malende YH, Temu AB. 1990. Site-index curves and volume growth of teak (Tectona grandis) at Mtibwa, Tanzania. Forest Ecology and Management 31: 91-99.
Mehtätalo L. 2005. Height-diameter models for Scots pine and birch in Finland. Silva Fennica 39: 55-66.
Mehtätalo L. 2004. A longitudinal height–diameter model for Norway spruce in Finland. Canadian Journal of Forest Research 34: 131-140.
Monserud RA. 1984. Height growth and site index curves for in- land Douglas-fir based on stem analysis data and forest habitat type. Forest Science 30: 943-965.
Onyekwelu JC. 2005. Site index curves for site quality assessment of Nauclea diderrichii monoculture plantations in Omo forest reserve, Nigeria. Journal of Tropical Forest Science 17:
532-542.
Onyekwelu JC. 2003. Choosing appropriate index age for estimat- ing site index of Gmelina arborea timber plantations in Oluwa
forest reserve. Food Agriculture and Environment 1: 286-290.
Onyekwelu JC, El Kateb H, Stimm B, Mosandl R. 2003. Growth characteristics of Nauclea diderrichii (De Wild.) Merr. in un- thinned plantations in south-western Nigeria. In: Waldbau - weltweit : Beiträge zur internationalen Waldbauforschung (Mosandl R, El Kateb H Stimm B, eds). Forstliche Forschungsberichte Munich, Freising, pp 147-163.
Onyekwelu JC. 2001. Growth characteristics and management sce- narios for plantation-grown Gmelina arborea and Nauclea di- derrichii in south-western Nigeria. Heieronymus Verlag, Munich, pp 196.
Onyekwelu JC, Fuwape JA. 1998. Site index equation for Gmelina arborea pulpwood in Oluwa Forest Reserve, Nigeria. Journal of Tropical Forest Science 10: 337-345.
Schumacher FX. 1939. A new growth curve and its application to timber yield studies. Journal of Forestry 37: 819-820.
Swenson JJ, Waring RH, Fan W, Coops N. 2005. Predicting site
index with a physiologically based growth model across Oregon, USA. Can J For Res 35: 1697-1707.
Teshome T, Petty JA. 2000. Site index equation for Cupressus lusi- tanica stands in Munessa forest, Ethiopia. Forest Ecology and Management 126: 339-347.
Wang DH, Tang SC, Hsieh HC, Chung CH. 2008. Site index curve for Taiwania plantations in the Liukuei area. Taiwan J For Sci 23: 335-349.
Waring RH, Milner KS, Jolly WM, Phillips L, McWethy D.
2006. Assessment of site index and forest growth capacity across the Pacific and Inland Northwest U.S.A. with a MODIS satel- lite-derived vegetation index. Forest Ecology and Management 228: 285-291.
Waring RH, Coops NC, Ohmann JL, Sarr DA. 2002.
Interpreting woody plant richness from seasonal ratios of photosynthesis. Ecology 83: 2964-2970.