22(2) : 140-145 (2016)
http://dx.doi.org/10.20307/nps.2016.22.2.140
140
Phenolic Constituents and Their Anti-inflammatory Activity from Echinochloa utilis Grains
Duc Hung Nguyen
1,4, Bing Tian Zhao
1, Duc Dat Le
1, Ki Yun Kim
2, Young Ho Kim
2, Young Ho Yoon
3, Jee Youn Ko
3, Koan Sik Woo
3, and Mi Hee Woo*
,11
College of Pharmacy, Catholic University of Daegu, Gyeongsan 38430, Republic of Korea
2
Laboratory of Immunobiology, School of Life Science and Biotechnology, College of Natural Sciences, Kyungpook National University, Daegu 39061, Republic of Korea
3
Functional Cereal Crop research Division, Department of Functional Crop, NICS, RDA, 50426, Republic of Korea
4
Phu Tho College of Pharmacy, Viettri City, Phutho Province 290000, Vietnam
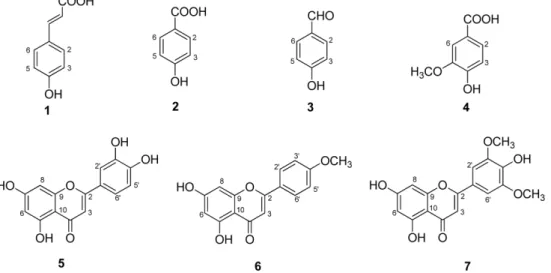
Abstract − Seven phenolic compounds including p-coumaric acid (1), 4-hydroxybenzoic acid (2), 4-hydroxy- benzaldehyde (3), vanillic acid (4), luteolin (5), acacetin (6), and tricin (7), were isolated from the methylene chloride and ethyl acetate fractions of Echinochloa utilis grains. Compounds (1 - 4, 6) were isolated for the first time from this plant. These compounds were tested for inhibitory activities against LPS-induced NO production in RAW 264.7 cells. Compounds 5 and 6 displayed significant inhibitory effects, with IC
50values of 27.9 ± 2.6 and 14.0 ± 1.1 µM, respectively. The results suggested that E. utilis ethanolic extract may be used as a potential source of anti-inflammatory agents and functional foods for the treatment of allergic diseases.
Keywords − Echinochloa utilis, Phenolic compounds, NO production
Introduction
Inflammation is a normal physiological and immune response to injury that occurs in response to trauma, infection, autoimmune or microbial activities, heat and toxins.
1,2Nitric oxide (NO) plays a wide variety of roles in biological processes and it is recognized as a mediator and regulator of the inflammatory response.
3In the lipopolysaccharide (LPS)-stimulated macrophages, NO is generated by the process of single enzymes such as inducible NOS (iNOS) and cyclooxygenase-2 (COX-2).
4Echinochloa utilis (barnyard millet, Japanese barnyard millet, E. esculenta, E. frumentacea) is a crop species belonging to the Poaceae family and is cultivated in Korea, Japan, and China.
5The grains of this plant have excellent agricultural characteristics, including animal forage, easy cultivation, salt tolerance, drought resistance, cold tolerance, and assured crop harvest.
6,7In several Asian countries, E. utilis grains are consumed in a manner similar to rice. Furthermore, they are used as a functional food to treat allergic diseases such as atopic dermatitis.
8,9A previous biological study on E. utilis grains revealed its strong antioxidant activity.
9However, information on the anti-inflammatory activity of this plant is lacking.
Therefore, we conducted this study to isolate and determine their anti-inflammatory activity from this plant. We describe the isolation, structural determination and NO production inhibitory activity in LPS-stimulated RAW246.7 cells for the components isolated from E. utilis grains.
Experimental
General experimental procedures – The infrared spec- troscopy (IR) spectra were measured on a Mattson Polaris FT/IR-300E spectrophotometer. The nuclear magnetic resonance (NMR) spectra were recorded in methanol-d
4on Varian OXFORD-AS 400 MHz instrument (Palo Alto, CA, USA) or Agilent 600 MHz instrument (Santa Clara, CA, USA). Low resolution FAB-MS and EI-MS data were measured on a Quattro II mass spectrometer. Open column chromatography was performed on silica gel (Merck, 63 - 200 µm particle size), RP-18 (Merck, 150 µm particle size), and Sephadex LH-20 (Pharmacia Co.
Ltd.). Fractions were monitored by TLC, and spots were visualized by spraying with 10% H
2SO
4in ethanol, followed by heating. For thin-layer chromatography, pre-
*Author for correspondence
Mi Hee Woo, College of Pharmacy, Catholic University of Daegu, Gyeongsan 38430, Republic of Korea
Tel: +82-53-850-3620; E-mail: [email protected]
coated TLC was carried out on silica gel 60 F
254and RP- 18 plates from Merck. High performance liquid chromato- graphy (HPLC) system was carried out using a Gilson system with an UV detector and an Optima Pak C18 column (10 × 250 mm, 10 µm particle size, RS Tech Corp., Korea).
Plant materials – The grains of E. utilis were collected from National Institute of Crop Science of Miryang in February 2013. A voucher specimen (EU.2013002) has been deposited at the College of Pharmacy, Catholic Uni- versity of Daegu.
Extraction and isolation – The dried grains of E. utilis (30 kg) were extracted with 80% ethanol (20 L × 4 times) at 80
oC for 4 h to yield 1.1 kg of extract. The concen- trated extract was suspended in H
2O (6 L), and the resulting H
2O layer was partitioned between H
2O and n- hexane (6 L × 7 times, 305 g), CH
2Cl
2(6 L × 7 times, 68 g), ethyl acetate (EtOAc) (6 L × 7 times, 35 g), n-butanol (n- BuOH) (6 L × 7 times, 130 g), and H
2O-soluble fractions, respectively. The n-hexane, the CH
2Cl
2, the EtOAc, the n- BuOH and the H
2O-soluble layers were analyzed by the TLCs, the results showed both the CH
2Cl
2and EtOAc fractions to be quite similarity. Therefore, they were com- bined for isolation. The CH
2Cl
2and EtOAc fractions were subjected to open column chromatography, eluted with gradient solvent system as n-hexane-EtOAc-MeOH (1:0:0 to 1:1:0 and 1:1:0.1 to 1:1:1, each 5 L) to obtain 14 fractions (A to N) according to their TLC patterns. These fractions were assayed for the NO production. Fractions G, H, and L displayed strong anti-inflammatory activity.
Fraction G (2.8 g) was loaded onto a RP-18 column eluting with a stepwise gradient of MeOH-H
2O (1:1, 2:1, 4:1, 8:1, 12:1) to afford 14 sub-fractions (G-1 to G-14).
Sub-fraction G-1 (67.5 mg) was subjected to semi-pre- parative Gilson HPLC eluted with solvent system of 33%
MeOH in H
2O for 60 min to give compounds 2 (7.1 mg, t
R= 38.2 min) and 4 (11.2 mg, t
R= 51.7 min), respectively.
Fraction L (1.8 g) was subjected to chromatography over Sephadex LH-20 with MeOH, to afford six sub-fractions (L-1 to L-6). Sub-fraction L-3 (215 mg) was further purified to RP-18 column chromatography, eluted with MeOH- H
2O (1:1, 2:1, 4:1, 8:1 and 12:1), to afford compounds 5 (6.8 mg) and 6 (5.0 mg), respectively. Sub-fraction L-6 (210 mg) was purified by using Sephadex LH-20 eluted with MeOH to yield compound 7 (80.0 mg). Fraction H (2.4 g) was subjected to chromatography over Sephadex LH-20 with methanol, to afford five sub-fractions (H-1 to H-5). Sub-fraction H-4 (326 mg) was further subjected to RP-18 column chromatography, eluted with MeOH-H
2O (1:1, 2:1, 4:1, 8:1 and 12:1), to afford six fractions (H-4-1
to H-4-6). Sub-fraction H-4-3 (160 mg) was subjected to RP-18 column chromatography, eluted with 66% MeOH in H
2O, to afford compounds 1 (40.1 mg) and 3 (8.1 mg), respectively.
p-Coumaric acid (1) – White powder; IR (KBr) cm
−1: 3380, 2908, 1672, 1626, 1600, 1520, 1448, 1250, 972, 830, 515; ESI-MS m/z 164 [M]
+;
1H NMR (CD
3OD, 600 MHz) δ: 7.58 (1H, d, J = 15.9 Hz, H-7), 6.26 (1H, d, J = 15.9 Hz, H-8), 7.42 (2H, d, J = 8.5 Hz, H-2, 6), 6.79 (2H, d, J = 8.5 Hz, H-3, 5);
13C NMR (CD
3OD, 150 MHz) δ: 127.4 (C-1), 131.2 (C-2, 6), 116.9 (C-3, 5), 161.2 (C- 4), 146.7 (C-7), 115.9 (C-8) 171.2 (COOH).
4-Hydroxybenzoic acid (2) – White crystalline solid;
IR (KBr) cm
−1: 3401, 2918, 2800, 2105, 1672, 1600, 852;
EI-MS m/z 138 [M]
+;
1H NMR (CD
3OD, 400 MHz) δ:
7.86 (2H, d, J = 8.6 Hz, H-2, 6), 6.79 (2H, d, J = 8.6 Hz, H-3, 5);
13C NMR (CD
3OD, 100 MHz) δ: 170.5 (COOH), 123.2 (C-1), 133.4 (C-2, 6), 116.4 (C-3, 5), 163.7 (C-4).
4-Hydroxybenzaldehyde (3) – White solid; IR (KBr) cm
−1: 3409, 1681, 1597, 1509, 1248, 821; FAB-MS m/z 123 [M + H]
+;
1H NMR (CD
3OD, 400 MHz) δ: 7.76 (2H, d, J = 8.7 Hz, H-2, 6), 6.90 (2H, d, J = 8.7 Hz, H-3, 5), 9.75 (1H, s);
13C NMR (CD
3OD, 100 MHz) δ: 193.0 (CHO), 130.4 (C-1), 133.6 (C-2, 6), 117.0 (C-3, 5), 165.3 (C-4).
Vanillic acid (4) – Colorless gum; IR (KBr) cm
−1: 3384, 2910, 1672, 1627, 1602, 1512, 1450, 1245, 977, 833, 516;
FAB-MS m/z 169 [M+H]
+;
1H NMR (CD
3OD, 400 MHz) δ: 7.54 (2H, overlapped, H-2, 6), 6.82 (1H, d, J = 6.8 Hz, H-3), 3.87 (3H, s);
13C NMR (CD
3OD, 100 MHz) δ: 170.0 (COOH), 124.5 (C-1), 125.1 (C-2), 113.6 (C-3), 152.4 (C- 4), 148.5 (C-5), 115.6 (C-6), 56.2 (OCH
3).
Luteolin (5) – Yellow powder; IR (KBr) cm
−1: 3421, 1670, 1619, 1621, 1420, 1108, 967, 836; EI-MS m/z 287 [M+H]
+;
1H NMR (CD
3OD, 400 MHz) δ: 7.38 (2H, overlapped, H-2', 6'), 6.91 (1H, d, J = 8.9 Hz, H-5'), 6.54 (1H, s, H-3), 6.44 (1H, d, J = 2.1 Hz, H-8), 6.21 (1H, d, J = 2.1 Hz, H-6);
13C NMR (CD
3OD, 100 MHz) δ: 166.1 (C-2), 104.0 (C-3), 184.0 (C-4), 159.5 (C-5), 100.2 (C-6), 166.5 (C-7), 95.1 (C-8), 163.3 (C-9), 105.4 (C-10), 120.4 (C-1'), 114.3 (C-2'), 147.2 (C-3'), 151.1 (C-4'), 116.9 (C- 5'), 123.8 (C-6').
Acacetin (6) – Pale yellow powder; IR (KBr) cm
−1: 3172, 2945, 2251, 2126, 1660, 1615; EI-MS m/z 285 [M+
H]
+;
1H NMR (CD
3OD, 400 MHz) δ: 7.74 (2H, d, J = 8.0
Hz, H-2', 6'), 7.38 (2H, d, J = 8.0 Hz, H-3', 5'), 6.81 (1H,
d, J = 2.0 Hz, H-8), 6.49 (1H, d, J = 2.0 Hz, H-6), 6.34
(1H, s, H-3), 3.85 (3H, s, OCH
3);
13C NMR (CD
3OD, 100
MHz) δ: 165.8 (C-2), 104.3 (C-3), 183.8 (C-4), 163.1 (C-
5), 103.9 (C-6), 166.6 (C-7), 95.2 (C-8), 159.6 (C-9), 105.4
(C-10), 121.9 (C-1'), 129.6 (C-2', 6'), 117.2 (C-3', 5'), 161.0 (C-4'), 56.8 (OCH
3).
Tricin (7) – Yellow powder; IR (KBr) cm
−1: 3238, 2930, 2812, 2359, 1661, 1610, 1506, 1480, 1020, 838; EI- MS m/z 329 [M−H]
−;
1H NMR (CD
3OD, 400 MHz) δ:
7.16 (2H, s, H-2', 6'), 6.39 (1H, d, J = 2.0 Hz, H-8), 6.12 (1H, d, J = 2.0 Hz, H-6), 6.57 (1H, s, H-3), 3.86 (6H, s, 2OCH
3);
13C NMR (CD
3OD, 100 MHz) δ: 166.2 (C-2), 104.7 (C-3), 184.0 (C-4), 159.6 (C-5), 100.3 (C-6), 163.4 (C-7), 95.3 (C-8), 166.2 (C-9), 105.4 (C-10), 122.8 (C-1'), 105.5 (C-2',6'), 149.8 (C-3',5'), 141.3 (C-4'), 57.2 (2 × OCH
3).
Cell culture – The RAW 264.7 cells were cultured in Dulbecco’s Modified Essential. These cells were grown at 37
oC in Dulbecco’s modified Eagle’s medium supple- mented with 10% heat-inactivated fetal bovine serum, penicillin (100 units/mL), and streptomycin sulfate (100 µg/mL) in a humidified incubator with 5% CO
2.
Determination of NO production and the cell viability assay – The amount of NO was calculated by measuring the amount of nitrite, in the cell culture supernatants was perform using Griess reagent as described previously.
10Briefly, the RAW 264.7 cells (5 × 10
4cells/
mL) were stimulated with or without 0.1 µg/mL of LPS for 24 h in the presence or absence of various concentra- tion of each compounds (1.25 - 100.0 µg/mL). The culture supernatant was used for nitric dioxide determination using Griess reagent.
11Equal volumes of culture supernatant and Griess reagent were mixed and the absorbance was determined at 570 nm. Cell viability test was performed based on the reduction of using 3-(4,5-demethyl-thiazol- 2-yl)-2,5-diphenyltetrazolium bromide (MTT) (Sigma Che- mical Co., St. Louis, MO) reagent into an insoluble, dark
purple formazan product in viable cell (5 × 10
4cell/mL) were incubated with test compounds (1.25 - 100.0 µg/mL) for 24 h. Then, 50 µL of 2 mg/mL MTT reagent was added to the culture plates and further incubated at 37 ºC for 2 h and absorbance was determined at 570 nm.
11Result and Discussion
The seven compounds (1 - 7) (Fig. 1) were isolated from the methylene chloride and ethyl acetate fractions of the E. utilis grains using open column chromatography and HPLC. The structures of these compounds were identified by comparing their spectroscopic data with those in the literature coupled with mass spectroscopic analysis. To the best of our knowledge, compounds 1 - 4, and 6 were isolated from E. utilis grains for the first time.
Compound 1 was obtained as a white solid. The IR spectrum showed typical absorption bands of hydroxyl (3380 cm
−1), carbonyl (1672 cm
−1), and aromatic substituents (1520 and 1448 cm
−1). The
1H NMR spectrum of 1 displayed ortho-coupled A
2B
2-type proton signals at δ
H7.42 and 6.79 (each 2H, d, J = 8.5 Hz), which were assigned to H-2, 6 and H-3, 5, respectively. In addition, compound 1 showed a pair of trans-olefinic proton signals at δ
H7.58 (1H, d, J = 15.9 Hz) and δ
H6.26 (1H, d, J = 15.9 Hz). The
13C NMR spectrum of 1 contained one carboxylic acid signal at δ
C171.2, one oxygenated olefin quaternary carbon signal at δ
C161.2 (C-4), and six olefin methine carbon signals at δ
C131.2 (C-2, 6), 116.9 (C-3, 5), 146.7 (C-7), and 115.9 (C-8). Based on the above evidence and comparison with the literature data,
12com- pound 1 was identified as p-coumaric acid.
Compound 2 was obtained as a white crystalline solid,
Fig. 1. Chemical structures of compounds 1 - 7 isolated from the grains of E. utilis.
and compound 3 was a white solid. The
1H NMR spectrum of 2 showed ortho-coupled A
2B
2-type proton signals at δ
H7.86 and 6.79 (each 2H, d, J = 8.6 Hz), which were assigned to H-2, 6 and H-3, 5, respectively. The
13C NMR of 2 contained one carboxyl carbon signal at δ
C170.5, one oxygenated olefin carbon signal at δ
C163.7 (C-4), and four olefin methine carbon signals at δ
C133.4 (C-2, 6) and 116.4 (C-3, 5). The
1H and
13C NMR data of 3 were identical with those of 2, except for a proton signal at δ
H9.75 (1H, s) and a carbon signal at δ
C193.0 (CHO).
With the above evidence and comparison with the literature data,
13,14compounds 2 and 3 were identified as 4-hydroxybenzoic acid and 4-hydroxybenzaldehyde, res- pectively.
Compound 4 was a colorless gum. The IR spectrum of 4 demonstrated absorption bands for hydroxyl (3384 cm
−1), carbonyl (1672 cm
−1), and aromatic (1602, 1512 cm
−1) groups. The
1H NMR spectrum of 4 displayed an ABX spin system at δ
H7.54 (2H, overlapped) and 6.82 (1H, d, J = 6.8), and one methoxyl proton signal at δ
H3.87 (3H, s). The
13C NMR of 4 demonstrated one carboxyl carbon signal at δ
C170.0, two oxygenated olefin quaternary carbon signals at δ
C152.4 (C-4) and 148.5 (C-5), three olefin methine carbon signals at δ
C125.1 (C-2), 113.6 (C-3), and 115.6 (C-6), and one methoxyl carbon signal at δ
C56.2 (OCH
3). Therefore, compound 4 was determined to be vanillic acid by comparing with reported data.
15Compound 5 was a yellow powder, and showed IR absorbance bands for hydroxyl (3421 cm
−1), carbonyl (1670 cm
−1), and aromatic (1621 cm
−1) groups. The
1H NMR spectrum of 5 displayed two meta-coupling doublets at δ
H6.21 (1H, d, J = 2.1 Hz) and 6.44 (1H, d, J = 2.1 Hz), assigned to H-6 and H-8 on ring A of 5,7- dihydroxyflavonoids, respectively. The ABX system at δ
H7.38 (2H, overlapped) and 6.91 (1H, d, J = 2.0 Hz) was assigned to H-5', H-6', and H-2'. In addition, the olefin proton signal at 6.54 (1H, s) was assigned to H-3. The
13C NMR data of 5 showed the presence of a ketone carbonyl at δ
C184.0, six oxygenated olefin quaternary carbon signals at δ
C166.5 (C-7), 166.1 (C-2), 159.5 (C-5), 147.2 (C-3'), 151.1 (C-4'), and 163.3 (C-9), and six olefin methine carbon signals at δ
C114.3 (C-2'), 116.9 (C-5'), 123.8 (C-6'), 104.0 (C-3), 100.2 (C-6), and 95.1 (C-8).
Based on the above evidence and comparison with the literature data,
9,15compound 5 was identified as luteolin.
Compound 6 was a pale yellow powder, and showed IR absorbance bands for hydroxyl (3172 cm
−1), conjugated ketone (1660 cm
−1), and aromatic (1615 cm
−1) groups. In the
1H NMR spectrum, compound 6 contained resonances characteristic for an ArOCH
3group due to a proton signal
at δ
H3.85 (3H, s), the ortho-coupled A
2B
2-type aromatic proton at δ
H7.74 and 7.38 (each 2H, d, J = 8.0 Hz) assigned to H-2', 6' and H-3', 5', respectively, and meta- coupling proton at δ
H6.81 and 6.49 (each 1H, d, J = 2.0) assigned to H-8 and H-6, respectively. In addition, the singlet proton at δ
H= 6.34 (1H, s) was assigned to H-3.
The
13C NMR spectrum displayed 15 carbon signals and one signal from the methoxyl group. These data indicated that 6 belonged to a flavonoid moiety. The carbon signals observed included one ketone signal at 183.8 (C-4), five oxygenated olefin quaternary carbon signals at δ
C165.8 (C-2), 163.1 (C-5), 166.6 (C-7), 161.0 (C-4'), and 159.6 (C-9), seven olefin methine carbon signals at δ
C104.3 (C- 3), 103.9 (C-6), 95.2 (C-8), 129.6 (C-2', 6'), and 117.2 (C- 3', 5'), and one methoxyl carbon signal at δ
C56.8 (OCH
3).
After detailed comparison of the
1H and
13C NMR with those published in literature,
16compound 6 was identified as acacetin.
Compound 7 was a yellow powder, and showed IR absorbance bands for hydroxyl (3238 cm
−1), carbonyl (1661 cm
−1), and aromatic (1610, 1506, 1480 cm
−1) groups.
The
1H NMR spectrum of 7 showed the presence of two meta-coupling proton signals at δ
H6.12 (1H, d, J = 2.0 Hz) and 6.39 (1H, d, J = 2.0 Hz), assigned to H-6 and H- 8, respectively. The methoxyl groups in B ring were detected as two proton singlets in
1H NMR at δ
H= 7.16, attributed to H-2' and H-6' protons. In addition, the singlet proton at δ
H= 6.57 (1H, s) was assigned to H-3.
13C NMR spectrum revealed a ketone signal at δ
C184.0 (C- 4), seven oxygenated olefin quaternary carbon signals at δ
C166.2 (C-2), 159.6 (C-5), 163.4 (C-7), 166.2 (C-9), 141.3 (C-4'), and 149.8 (C-3', 5'), four olefin methine carbon signals at δ
C105.5 (C-2', 6'), 100.3 (C-6), and 95.3 (C-8), and two methoxyl signals at δ
C57.2 (3', 5'-OCH
3).
On the basic of the above spectral evidence and com- parison with the literature data,
9compound 7 was concluded to be tricin.
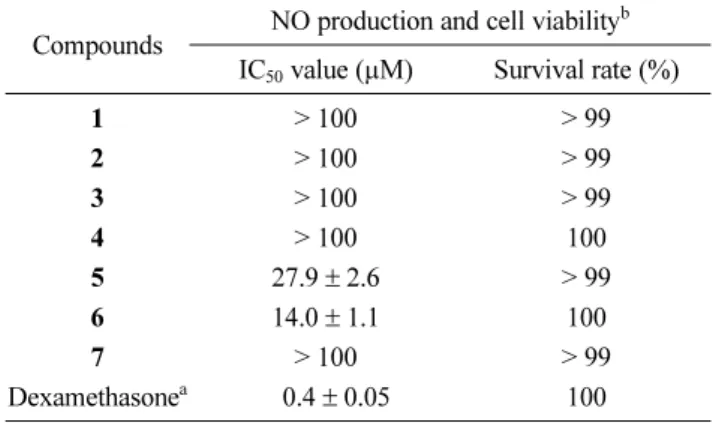
To determine inhibitory activities against LPS-induced NO production of isolated compounds in RAW 264.7 cells, the NO levels were quantified using the Griess reaction. The cytotoxic effect of the isolated compounds was also evaluated in the presence of LPS using MTT assay; the compounds showed no cytotoxicity at the concentration of 100 µg/mL (Table 1). The isolated com- pounds (1 - 7) were examined to determine their inhibitory activities against NO production in LPS-stimulated RAW 264.7 macrophage cells. As shown in Table 1, compounds 5 and 6 displayed half maximal inhibitory concentration (IC
50) values of 27.9 ± 2.6 and 14.0 ± 1.1 µM, respectively.
Other compounds exhibited weak or no effects (IC
50values > 100 µM). Compound 6, a flavonoid with methoxy at C-4' in a B ring displayed the strongest inhibition of NO production in LPS-stimulated RAW 264.7 cells (IC
50:
14.0 ± 1.1 µM). Compound 5 exhibited significant inhi- bitory effects (IC
50: 27.9 ± 2.6 µM). The inhibitory effects of active compounds on pro-inflammatory mediators related to the modulation of iNOS and COX-2 expression were tested by Western blotting. The results showed that compounds 5 and 6 (2.5 - 10.0 µg/mL) dose-dependently reduced the LPS-induced iNOS expression (Fig. 2).
Therefore, compounds 5 and 6 could suppress LPS- induced iNOS expressions at the transcription level. In addition, pre-incubation of cells with compounds 5 and 6 significantly suppressed the LPS-induced expression of COX-2 protein (Fig. 2). Compound 5 (luteolin), a naturally occurring flavonoid present in many types of plants, was reported to be associated in part with the anti-oxidant potential,
17,18anti-cancer,
19anti-inflammatory and anti- allergic activities of LPS.
20Luteolin was also reported to inhibit NO production and prostaglandin E
2as well as the expression of iNOS and COX-2.
21,22The hydroxyl moieties and the double bond between C-2 and C-3 are important structural features in luteolin which are responsible for biochemical and biological activities.
23Similarly, Com- pound 6 (acacetin) was also reported to inhibit NO production, the expression of iNOS and COX-2.
24,25Acknowledgments
This work was supported by the Cooperative Research Program for Agriculture Science & Technology Develop- ment (Project No. PJ009865), Rural Development Admi- nistration, Republic of Korea. We are grateful to Korea Basic Science Institute (KBSI) for mass spectral measure- ments.
References
(1) Zedler, S.; Faist, E. Curr. Opin. Crit. Care 2006, 12, 595-601.
(2) Mariathasan, S.; Monack, D. M. Nat. Rev. Immunol. 2007, 7, 31-40.
(3) Korhonen, R.; Lahti, A.; Kankaanranta, H.; Moilanen, E. Curr. Drug Targets Inflamm. Allergy 2005, 4, 471-479.
(4) Salvemini, D.; Ischiropoulos, H.; Cuzzocrea, S. Methods Mol. Biol.
2003, 225, 291-303.
(5) Yabuno, T. Econ. Bot. 1987, 41, 484-493.
(6) Nozawa, S.; Takahashi, M.; Nakai, H.; Sato, Y. Breed. Sci. 2006, 56, 335-340.
(7) Park, K.Y.; Park, R. K.; Choi, B. H. Korean J. Crop Sci. 1991, 36, 249-253.
(8) Kim, J. Y.; Jang, K. C.; Park, B. R.; Han, S. I.; Choi, K. J.; Kim, S.
Y.; Oh, S. H.; Ra, J. E.; Ha, T. J., Lee, J. H.; Hwang, J. Y.; Kang, H. W.;
Seo, W. D. Food Sci. Biotechnol. 2011, 20, 461-469.
(9) Watanabe, M. J. Agric. Food Chem. 1999, 47, 4500-4505.
(10) Migliorini, P.; Corradin, G.; Corradin, S. B. J. Immunol. Methods 1991, 139, 107-114.
(11) Lee, Y. J.; Han, J. Y.; Lee, C. G.; Heo, K.; Park, S. I.; Park, Y. S.;
Kim, J. S.; Yang, K. M.; Lee, K. J.; Kim, T. H.; Rhee, M. H.; Kim, S. D.
Table 1. Effects of IC
50values of isolated compounds 1 - 7 from E. utilis on LPS-stimulated NO production and cell viability.
Compounds NO production and cell viability
bIC
50value (µM) Survival rate (%)
1 > 100 > 99
2 > 100 > 99
3 > 100 > 99
4 > 100 100
5 27.9 ± 2.6 > 99
6 14.0 ± 1.1 100
7 > 100 > 99
Dexamethasone
a0.4 ± 0.05 100
a
Dexamethasone was used as a positive control.
Data are present as mean ± SD (n = 3).
IC
50values, concentrations inhibiting NO production by 50%.
b