Cytotoxic Activity and Structure Activity Relationship of Ceramide Analogues in Caki-2 and HL-60 Cells
7
0
0
전체 글
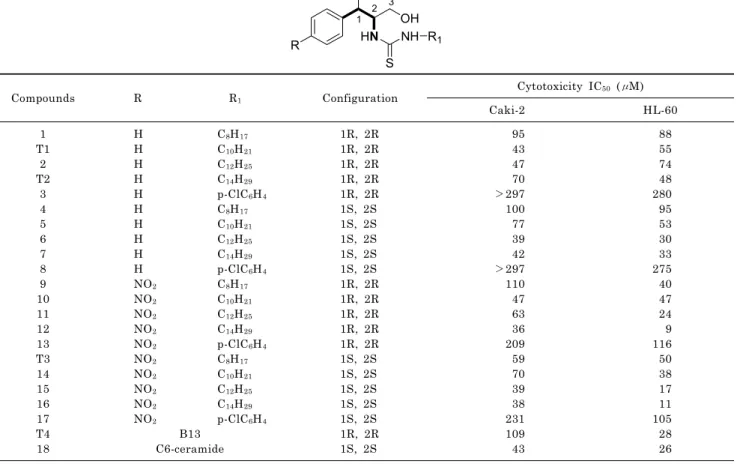
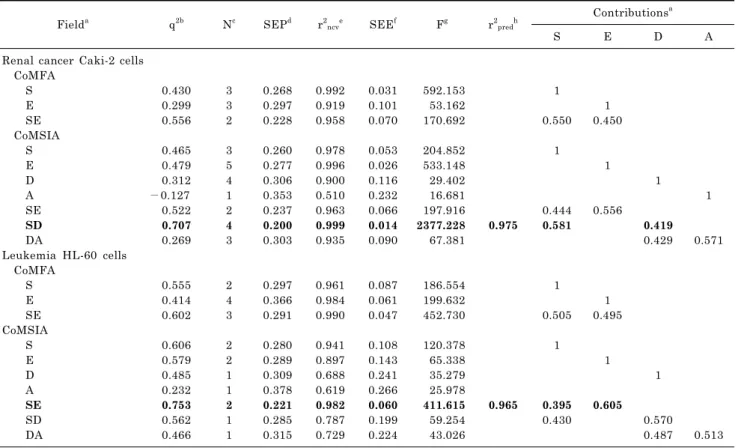
(2) 442. YJ Kim, et al. Fig. 1. Structures analogues.. of. ceramide. Table 1. Structures and in vitro cytotoxic activities of the ceramide analogues. OH 1. 2. 3. OH NH R1. HN. R. S Compounds 1 T1 2 T2 3 4 5 6 7 8 9 10 11 12 13 T3 14 15 16 17 T4 18. R. R1. H H H H H H H H H H NO2 NO2 NO2 NO2 NO2 NO2 NO2 NO2 NO2 NO2. Configuration. C 8H 17 C 10H 21 C 12H 25 C 14H 29 p-ClC 6H 4 C 8H 17 C 10H 21 C 12H 25 C 14H 29 p-ClC 6H 4 C 8H 17 C 10H 21 C 12H 25 C 14H 29 p-ClC 6H 4 C 8H 17 C 10H 21 C 12H 25 C 14H 29 p-ClC 6H 4. 1R, 1R, 1R, 1R, 1R, 1S, 1S, 1S, 1S, 1S, 1R, 1R, 1R, 1R, 1R, 1S, 1S, 1S, 1S, 1S, 1R, 1S,. B13 C6-ceramide 4. 2R 2R 2R 2R 2R 2S 2S 2S 2S 2S 2R 2R 2R 2R 2R 2S 2S 2S 2S 2S 2R 2S. Cytotoxicity IC 50 (μM) Caki-2. HL-60. 95 43 47 70 >297 100 77 39 42 >297 110 47 63 36 209 59 70 39 38 231 109 43. 88 55 74 48 280 95 53 30 33 275 40 47 24 9 116 50 38 17 11 105 28 26. The cells were plated at a density of approximately 1×10 cells/well in 96-well plates. Each well contained 180 μl of medium and 20 μl of 10×concentration of prepared compounds or PBS were added. After 96 h of culture, 0.1 mg of MTT was added to each well and incubated at 37oC for 4 h. The plates were centrifuged at 450×g to precipitate the formazan crystals. The medium was removed and 150 µl of DMSO was added to each well to dissolve the formazan. In this assay, MTT was converted to blue formazan by mitochondrial dehydrogenase. The intensity of the blue color was measured with a microplate reader at a wavelength of 540 nm. The measured mean values were expressed as the IC 50, the concentration that reduced the optical density of the treated cells by 50% with respect to the untreated controls..
(3) 443. Cytotoxicity and SAR of Ceramide Analogues in Caki-2 and HL-60 Cells. Human tumor cell lines of renal cancer Caki-2 and leukemic cancer HL-60 were obtained from Chongkundang Pharmaceutical Corp. A series of thiourea B13 analogues were previously synthesized in our lab [28]. In vitro cytotoxic assay The thiourea B13 analogues were evaluated for their cytotoxicity in the following human tumor cell lines: renal cancer Caki-2 and leukemic cancer HL-60. The cells were treated as described in the Table 1 legend and the cytotoxic assay was performed with a MTT-based colorimetric assay [29,30]. CoMFA and CoMSIA analysis A data set of 22 compounds was used to carry out the 3D-QSAR analysis. The molecular structures of the training and test sets are described in Table 1. The data set was divided into two groups. Eighteen compounds (1∼18) were randomly selected for the training set and four compounds (T1∼T4) for the test set, which was used for external validation of the 3D-QSAR models. The IC50 values were converted into pIC50 (−log IC50) values and used as the dependent variable in deriving CoMFA and CoMSIA. All computational studies were performed with Tripos Sybyl-X 1.1.1 software [31]. Molecular structures were built by the Sketch Molecule tool in SYBYL. The structural opti-. mization was carried out using TRIPOS force field with the Gasteiger Huckel charges and conjugated gradient method with a gradient convergence value of 0.05 kcal/mol. Low energy conformation was searched by simulated annealing method. The structures were aligned by using align database. One of the most important requirements for CoMFA and CoMSIA models is that the 3D structures of the molecules should be aligned to a suitable conformational template. The most active compound (12) was used as a template molecule, and the bold line moiety of thiourea B13 analogues in Table 1 was used as a common substructure in the alignment. CoMFA and CoMSIA are based on the relationship between biological activity and structural properties of compounds when the receptor structure is not known. CoMFA was performed on the steric and electrostatic fields with the default values. A three-dimensional cubic lattice with 2.0 Å grid spacing was generated around the aligned molecules. The steric and electrostatic field energies of CoMFA were calculated for each molecule using LennardJones potential and Coulombic potential, respectively. The sp3 carbon probe atom with a charge of +1 and a Van der Waals radius of 1.52 Å was used to generate the CoMFA steric and electrostatic fields. The CoMSIA method involves a common probe atom and similarity indices calculated at regularly spaced grid intervals for the aligned molecules. The CoMSIA calculates five fields: steric, electrostatic, hydrophobic, hydrogen bond ac-. Table 2. Statistical data for CoMFA and CoMSIA models Fielda. q2b. Renal cancer Caki-2 cells CoMFA 0.430 S 0.299 E 0.556 SE CoMSIA S 0.465 E 0.479 D 0.312 A −0.127 SE 0.522 SD 0.707 DA 0.269 Leukemia HL-60 cells CoMFA S 0.555 E 0.414 SE 0.602 CoMSIA S 0.606 E 0.579 0.485 D 0.232 A SE 0.753 0.562 SD DA 0.466 a. Nc. SEPd. r2ncve. SEE f. Fg. 3 3 2. 0.268 0.297 0.228. 0.992 0.919 0.958. 0.031 0.101 0.070. 592.153 53.162 170.692. 3 5 4 1 2 4 3. 0.260 0.277 0.306 0.353 0.237 0.200 0.303. 0.978 0.996 0.900 0.510 0.963 0.999 0.935. 0.053 0.026 0.116 0.232 0.066 0.014 0.090. 204.852 533.148 29.402 16.681 197.916 2377.228 67.381. 2 4 3. 0.297 0.366 0.291. 0.961 0.984 0.990. 0.087 0.061 0.047. 186.554 199.632 452.730. 2 2 1 1 2 1 1. 0.280 0.289 0.309 0.378 0.221 0.285 0.315. 0.941 0.897 0.688 0.619 0.982 0.787 0.729. 0.108 0.143 0.241 0.266 0.060 0.199 0.224. 120.378 65.338 35.279 25.978 411.615 59.254 43.026. r2predh. Contributions S. E. a. D. A. 1 0.550. 1 0.450. 1 1 1 1 0.975. 0.444 0.581. 0.556 0.419 0.429. 0.571. 1 0.505. 1 0.495. 1 1 1 0.965. b 2. 0.395 0.430. 0.605 0.570 0.487. 0.513. Fields used (S, steric; E, electrostatic; D, H-bond donor); A, H-bond acceptor; q , cross-validated correlation coefficient from leave-one-out (LOO); cN, optimum number of components; dSEP, standard error of prediction; er2ncv, non-cross-validated correlation f g h 2 coefficient; SEE, standard error of estimate; F, F-test value; r pred, predicted correlation coefficient..
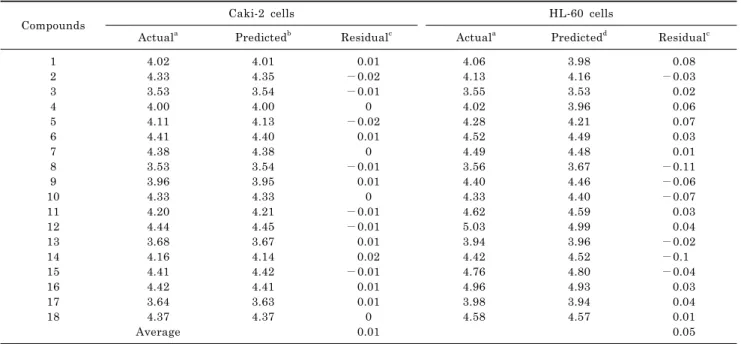
(4) 444. YJ Kim, et al. ceptor, and hydrogen bond donor fields. The common probe atom with radius 1.0 Å, charge +1, hydrophobicity +1, hydrogen bond donating +1, and hydrogen bond accepting +1 was used to calculate the five fields. A default value of 0.3 was used for the attenuation factor. Partial least squares (PLS) regression analysis was used with cross-validation to determine the optimum number of components, which were then used for the final 3D-QSAR model without cross-validation. Cross-validation was performed with the leave-one-out (LOO) method in which one compound was removed from the data set and its biological activity was predicted with the model derived from the rest of the data set. Finally, non-cross-validated analysis was carried out using the optimal number of components for CoMFA and CoMSIA.. RESULTS In vitro cytotoxic activity Twenty-two compounds were evaluated for their cytotoxicity in vitro against human renal cancer Caki-2 and leukemic cancer HL-60 cells. The biological activities of the compounds are presented in Table 1. B13 showed moderate cytotoxicity with IC50 values of 109 and 28 μM against Caki-2 and HL-60 tumor cell lines, while C6-ceramide exhibited more potent activity with IC50 values of 43 and 26 μM in our assay conditions, respectively. In renal cancer Caki-2 cells, most B13 analogues except p-chlorophenyl compounds (3, 8, 13, and 17) had more potent activity than B13, and the long alkyl chain analogues (6, 7, 12, 15, and 16) exhibited stronger cytotoxicity than C6-ceramide. For leukemic cancer HL-60 cells, the long alkyl chain compounds with a nitro group at the phenyl ring. (11, 12, 15, and 16) exhibited more potent cytotoxicity than B13 and C6-ceramide. Compounds 12, 15, and 16 were more active than B13 and C6-ceramide against both tumor cell lines and compound 12 was the most potent. These compounds had a nitro group at the phenyl ring, a long alkyl chain at the thiourea moiety, and IC50 values of 36, 39, and 38 μM against renal cancer Caki-2 cells and 9, 17, and 11 μM against leukemic cancer HL-60 cells, respectively. The IC50 values of the other compounds ranged from 43 to 297 μM for Caki-2 cells and 24 to 280 μM for HL-60 cells. 3D-QSAR analysis The statistical results from CoMFA and CoMSIA models are summarized in Table 2. Renal cancer Caki-2 cells: Seven CoMSIA models were performed with the steric, electrostatic, hydrogen bond donor, and hydrogen bond acceptor fields. PLS analyses with steric and hydrogen bond donor field gave a cross-validated 2 coefficient (q ) value of 0.707 and non-cross-validated coefficient (r2ncv) value of 0.999 with 4 optimum number of components. The CoMFA model with steric and electro2 2 static fields gave q =0.556, N=2, and r ncv=0.958. The CoMSIA model with steric and hydrogen bond donor fields 2 showed higher q value (0.707) than any other CoMFA and CoMSIA models. The predictive ability of the model is expressed by the r2pred value, which is analogous to cross-vali2 2 dated q , and the predicted r value of this model was 0.975. For this model, the predicted pIC50 values and residuals for training set and test set are shown in Tables 3 and 4, respectively. Fig. 2A shows the correlation between the actual versus predicted pIC50 values of the 22 training and test set compounds. Leukemic cancer HL-60 cells: The CoMSIA model with steric and electrostatic fields gave a cross-validated co-. Table 3. Actual and predicted activities (pIC50) of the training set Compounds 1 2 3 4 5 6 7 8 9 10 11 12 13 14 15 16 17 18 a. Caki-2 cells Actual. a. 4.02 4.33 3.53 4.00 4.11 4.41 4.38 3.53 3.96 4.33 4.20 4.44 3.68 4.16 4.41 4.42 3.64 4.37 Average. Predicted 4.01 4.35 3.54 4.00 4.13 4.40 4.38 3.54 3.95 4.33 4.21 4.45 3.67 4.14 4.42 4.41 3.63 4.37. b. HL-60 cells Residual 0.01 −0.02 −0.01 0 −0.02 0.01 0 −0.01 0.01 0 −0.01 −0.01 0.01 0.02 −0.01 0.01 0.01 0 0.01. c. Actual 4.06 4.13 3.55 4.02 4.28 4.52 4.49 3.56 4.40 4.33 4.62 5.03 3.94 4.42 4.76 4.96 3.98 4.58. a. Predicted 3.98 4.16 3.53 3.96 4.21 4.49 4.48 3.67 4.46 4.40 4.59 4.99 3.96 4.52 4.80 4.93 3.94 4.57. d. Residual. c. 0.08 −0.03 0.02 0.06 0.07 0.03 0.01 −0.11 −0.06 −0.07 0.03 0.04 −0.02 −0.1 −0.04 0.03 0.04 0.01 0.05. Actualcytotoxic activity; bpredicted activity by the CoMSIA model with steric and hydrogen bond donor fields; cdifference between the actual and predicted activity; dpredictedactivity by the CoMSIA model with steric and electrostatic fields. The pIC50 (−log IC 50) values were converted from IC50 values..
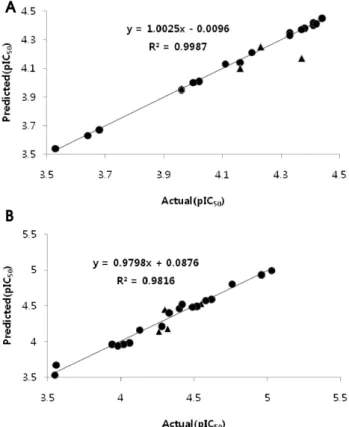
(5) 445. Cytotoxicity and SAR of Ceramide Analogues in Caki-2 and HL-60 Cells. Table 4. Actual and predicted activities (pIC 50) of the test set Compounds T1 T2 T3 T4. Caki-2 cells Actual. a. 4.37 4.16 4.23 3.96 Average. Predicted 4.17 4.10 4.25 3.96. b. HL-60 cells Residual 0.2 0.06 −0.02 0 0.07. c. Actual 4.26 4.32 4.30 4.55. a. Predicted. d. 4.14 4.18 4.45 4.53. Residual. c. 0.12 0.14 −0.15 0.02 0.11. a Actualcytotoxic activity; bpredicted activity by the CoMSIA model with steric and hydrogen bond donor fields; cdifference between d the actual and predicted activity; predictedactivity by the CoMSIA model with steric and electrostatic fields. The pIC 50 (−log IC50) values were converted from IC 50 values.. DISCUSSION. Fig. 2. Plot of the actual versus predicted activities against tumor cell lines. (A) Renal cancer Caki-2 cells. (B) Leukemic cancer HL-60 cells. The IC50 values were converted into pIC50 (−log IC50) values (●: training set molecules, ▲: test set molecules).. 2. efficient (q ) of 0.753 and a non-cross-validated coefficient (r2ncv) of 0.982 with an optimum number component (N) of 2. CoMFA with steric and electrostatic fields showed 2 2 q =0.602, N=3, and r ncv=0.990. CoMSIA with steric and electrostatic fields gave a higher q2 value (0.753) than any 2 other models, and its predicted r value was 0.965. With this model, the predicted pIC50 values and residuals of the training set and test set were calculated and shown in Tables 3 and 4, respectively. A graph of actual versus predicted pIC50 values for the training set and test set is shown in Fig. 2B.. Compounds 12, 15, and 16 showed more potent cytotoxicity than B13, suggesting that the amide group of B13 could be replaced by a thiourea group. This could provide clues for the design of new B13 analogues, since the thiourea group is generally more water soluble and stable to hydrolysis by amidase than the amide group. The stereochemistry of 1,3-propandiol may not be essential for cytotoxicity, although some (1S, 2S) compounds with long alkyl chains (6, 7 and 15) gave slightly more potent activity than (1R, 2R) compounds (2, T2, and 11). But the (1R, 2R) compound with short alkyl chains (1) had stronger activity than (1S, 2S) compound (4). The introduction of a p-chlorophenyl ring at the thiourea moiety significantly decreased cytotoxicity, while the nitro group at the phenyl ring in 1,3-propandiol increased activity against both cancer cell lines. Therefore, compounds with a p-chlorophenyl group (3, 8, 13, and 17) were less active than other compounds, while compounds with a nitro group at phenyl ring (12, 13, T3, 14, 15, 16, and 17) were more potent than compounds without a nitro group (T2, 3, 4, 5, 6, 7, and 8). In general, compounds with long alkyl chains (6, 7, 12, 15, and 16) showed increased activity compared with those with short alkyl chains (4, 5, 10, T3, and 14). This was consistent with the reported trend that the biological activity increased with the acyl chain length of ceramide [22,32]. For renal cancer Caki-2 cells, the statistical data from 2 the CoMSIA model showed high cross-validated value q 2 (0.707) and non-cross-validated coefficient value r ncv (0.999), which suggested that this model was predictive. In 2 general, a q value higher than 0.5 is considered an indication that the model is internally predictive. The relative contributions of steric field (0.581) and hydrogen bond donor field (0.419) indicated that steric and hydrogen bond donor interactions in the receptor were similarly important in the activity. For leukemic cancer HL-60 cells, the CoMSIA model with steric and electrostatic fields showed a higher q2 value than the other models. Good predictivity 2 2 of this model was indicated by high q (0.753) and r ncv (0.982) coefficient values. The steric (39.5%) and electrostatic field (60.5%) contributions suggested that strong electrostatic ligand-receptor interactions were involved in the cytotoxicity. The small average residual values (0.01 and 0.05) between actual and predicted activity in Table 3 showed that the predicted activity from CoMSIA models correlated well with actual activity. The test set was used to validate the predictive ability of these CoMSIA models and their small average residual values (0.07 and 0.11) in-.
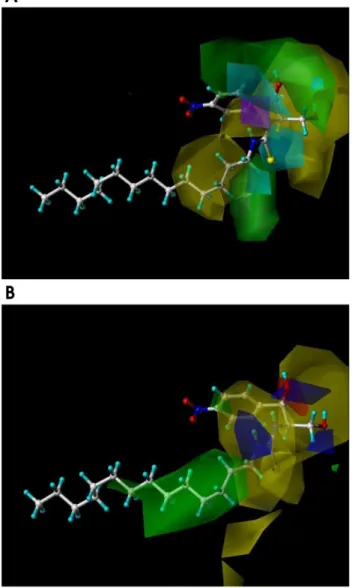
(6) 446. YJ Kim, et al. dicated that both models predicted the biological activity of the test set molecules well. Contour maps showed the regions around molecules where increased or decreased activity was predicted by physicochemical property changes in the molecules. The CoMSIA contour map of steric and hydrogen bond donor fields in renal cancer Caki-2 cells and that of steric and electrostatic fields in leukemia cancer HL-60 cells are shown in Fig. 3. The green contours indicate sterically favored regions, whereas the yellow contours designate sterically unfavorable regions in the steric contour map. The cyan area is a hydrogen bond donor favored region, while the purple area shows a hydrogen bond donor unfavorable. Fig. 3. 3D-contour maps of CoMSIA models. (A) CoMSIA model with steric and hydrogen bond donor fields for renal cancer Caki-2 cells. (B) CoMSIA model with steric and electrostatic fields for leukemic cancer HL-60 cells. Compound 12 is shown inside fields (green: sterically favorable; yellow: sterically unfavorable; cyan: hydrogen bond donor favorable; purple: hydrogen bond donor unfavorable; blue: positive charge favorable; red: negative charge favorable).. region in the hydrogen bond donor contour map. In the electrostatic contour map, blue and red regions are favorable for positive charge and negative charge, respectively. The molecule in the contour maps is compound 12, which showed the most potent cytotoxicity. The CoMSIA contour map of renal cancer Caki-2 cells (Fig. 3A) illustrated yellow contours at C1-H, C2-H and C3-OH in 1,3-propandiol and alkyl chain from C2 to C5. These yellow contours suggested that bulky groups at these regions were unfavorable for cytotoxic activity. This finding was supported by the compounds with a bulky p-chlorophenyl ring (3, 8, 13, and 17) at the alkyl chain, which were much less active than other compounds. The presence of green contours at C1-OH and C3-H in 1,3-propandiol and C1 of the alkyl chain indicated that a bulky substituent in these regions may enhance the cytotoxic activity. The cytotoxicity was likely to be increased by introduction of a hydrogen bonding donor group at the cyan regions around C2-H in 1,3-propandiol, ortho hydrogen of phenyl ring, and C1-H of alkyl chain. The CoMSIA contour map in leukemic cancer HL-60 cells (Fig. 3B) showed a sterically favorable green region at the alkyl chain from C2 to C6, where bulky groups were likely to increase the cytotoxic activity. But the bulky substituent at C1-H, C2-H, and C3-OH in 1,3-propandiol and C1-H of alkyl chain were expected to decrease the activity, since they were in sterically unfavorable yellow regions. The CoMSIA contour map also showed favorable regions for positive charge (blue contour) near C1-H and C3-H in 1,3-propandiol and NH of the alkyl chain, and favorable regions for negative charge (red contour) at the oxygen of C1-OH. Since the hydrogen of C1-H and C3-H in 1,3-propandiol and NH at the alkyl chain are electron deficient atoms due to electron withdrawing oxygen and sulfur atoms and the negative charge of the oxygen of C1-OH itself, they correlated well with the CoMSIA electrostatic contour map. Thus, 1,3-propandiol and the thiourea moiety were important for cytotoxicity. In conclusion, compounds 12, 15, and 16 exhibited stronger cytotoxicity than B13 and C6-ceramide in both tumor cell lines. The good predictivity of CoMSIA models was 2 2 shown by high q (0.707 and 0.753) and r ncv (0.999 and 0.982) coefficient values. The small average residual values of the training (0.01 and 0.05) and test (0.07 and 0.11) sets indicated that the predicted activities from CoMSIA models correlated well with the actual activity. Cytotoxic assays suggested that the amide group of B13 could be replaced by thiourea, that the stereochemistry of 1,3-propandiol may not be essential for activity and that long alkyl chains increased cytotoxicity. The bulky substituents at C1-H, C2-H and C3-OH in 1,3-propandiol were expected to decrease the activity in both cancer cell lines. But, a bulky substituent at C1-H of alkyl chain and small groups at the alkyl chain from C2 to C5 were likely to enhance the cytotoxicity against renal cancer Caki-2 cells but decrease the cytotoxicity against leukemic cancer HL-60 cells. This could provide some valuable information for the design of new B13 analogues.. ACKNOWLEDGEMENTS This Research was supported by Chung-Ang University Research Scholarship Grants in 2009-2010..
(7) Cytotoxicity and SAR of Ceramide Analogues in Caki-2 and HL-60 Cells. REFERENCES 1. Kolesnick RN, Goni FM, Alonso A. Compartmentalization of ceramide signaling: physical foundations and biological effects. J Cell Physiol. 2000;184:285-300. 2. Merrill AH Jr, Sullards MC, Allegood JC, Kelly S, Wang E. Sphingolipidomics: high-throughput, structure-specific, and quantitative analysis of sphingolipids by liquid chromatography tandem mass spectrometry. Methods. 2005;36:207-224. 3. Merrill AH Jr. De novo sphingolipid biosynthesis: a necessary, but dangerous, pathway. J Biol Chem. 2002;277:25843-25846. 4. Hannun YA, Obeid LM. The ceramide-centric universe of lipid-mediated cell regulation: stress encounters of the lipid kind. J Biol Chem. 2002;277:25847-25850. 5. Kolesnick RN. The therapeutic potential of modulating the ceramide sphingomyelin pathway. J Clin Invest. 2002;110:3-8. 6. Hanada K, Kumagai K, Yasuda S, Miura Y, Kawano M, Fukasawa M, Nishijima M. Molecular machinery for nonvesicular trafficking of ceramide. Nature. 2003;426:803-809. 7. Lee DW, Park SY, Ryu JS, Kim SH, Im C, Choi SH, Lee SE, Ko SK, Sohn UD. Relaxation effect of synthetic ceramide analogues in cat esophageal smooth muscle cells. Korean J Physiol Pharmacol. 2008;12:137-142. 8. Kanto T, Kalinski P, Hunter OC, Lotze MT, Amoscatto AA. Ceramide mediates tumor-induced dendritic cell apoptosis. J Immunol. 2001;167:3773-3784. 9. Noda S, Yoshimura S, Sawada M, Naganawa T, Iwama T, Nakashima S, Sakai N. Role of ceramide during cisplatininduced apoptosis in C6 glioma cells. J Neurooncol. 2001;52: 11-21. 10. Selzner M, Bielawska A, Morse MA, Rudiger HA, Sindram D, Hannun YA, Clavien PA. Induction of apoptotic cell death and prevention of tumor growth by ceramide analogues in metastatic human colon cancer. Cancer Res. 2001;61:1233-1240. 11. Zheng W, Kollmeyer J, Symolon H, Momin A, Munter E, Wang E, Kelly S, Allegood JC, Liu Y, Peng Q. Ceramides and other bioactive sphingolipid backbones in health and disease: lipidomic analysis, metabolism and roles in membrane structure, dynamics, signaling and autophagy. Biochim Biophys Acta. 2006;1758:1864-1884. 12. Liu X, Elojeimy S, El-Zawahry AM, Holman DH, Bielawska A, Bielawski J, Rubinchik S, Guo GW, Dong JY, Keane T, Hannun YA, Tavassoli M, Norris JS. Modulation of ceramide metabolism enhances viral protein apoptin’s cytotoxicity in prostate cancer. Mol Ther. 2006;14:637-646. 13. Michael JM, Lavin MF, Watters DJ. Resistance to radiationinduced apoptosis in burkitt’s lymphoma cells is associated with defective ceramide signaling. Cancer Res. 1997;57:3600-3605. 14. Norris JS, Bielawska A, Day T, El-Zawahri A, ElOjeimy S, Hannun Y, Holman D, Hyer M, Landon C, Lowe S, Dong JY, McKillop J, Norris K, Obeid L, Rubinchik S, Tavassoli M, Tomlinson S, Voelkel-Johnson C, Liu X. Combined therapeutic use of AdGFPFasL and small molecule inhibitors of ceramide metabolism in prostate and head and neck cancers: a status report. Cancer Gene Ther. 2006;13:1045-1051. 15. Senchenkov A, Litvak DA, Cabot MC. Targeting ceramide metabolism a strategy for overcoming drug resistance. J Natl Cancer Inst. 2001;93:347-357. 16. Mathias S, Pena LA, Kolensnick RA. Signal transduction of. 447. stress via ceramide. Biochem J. 1998;335:465-480. 17. Eto M, Bennouna J, Hunter OC. C16-ceramide accumulates following androgen ablation in LNCaP prostate cancer cells. Prostate. 2003;57:66-79. 18. Pettus BJ, Chalfant CE, Hannun YA. Ceramide in apoptosis: an overview and current perspectives. Biochim Biophys Acta. 2002;1585:114-125. 19. Bose R, Verheij M, Haimovitz FA, Scotto K, Fuks Z, Kolesnick R. Ceramide synthase mediates daunorubicin-induced apoptosis: an alternative mechanism for generating death signals. Cell. 1995;82:405-414. 20. Hannun YA, Luberto C. Ceramide in the eukaryotic stress response. Trends Cell Biol. 2000;10:73-80. 21. Nam EJ, Lee HS, Lee YJ, Joo WS, Maeng S, Im HI, Park CW, Kim YS. Ceramide is involved in MPP+ -induced cytotoxicity in human neuroblastoma cells. Korean J Physiol Pharmacol. 2002;6:281-286. 22. Bieberich E, Hu B, Silva J, Mackinnon S, Yu RK, Fillmore H, Broaddus WC, Ottenbrite RM. Synthesis and characterization of novel ceramide analogs for induction of apoptosis in human cancer cells. Cancer Letters. 2002;181:55-64. 23. Radin NS. Killing cancer cells by poly-drug elevation of ceramide levels: a hypothesis whose time has come? Eur J Biochem. 2001;268:193-204. 24. Bielawska A, Greenberg MS, Perry D, Jayadev S, Shayman JA, McKay C, Hannun YA. (1S,2R)-D-erythro-2-(N-myristoylamino)1-phenyl-1-propanol as an inhibitor of ceramidase. J Biol Chem. 1996;271:12646-12654. 25. Raisova M, Goltz G, Bektas M, Bielawska A, Riebeling C, Hossini AM, Eberle J, Hannun YA, Orfanos CE, Geilen CC. Bcl-2 overexpression prevents apoptosis induced by ceramidase inhibitors in malignant melanoma and hacat keratinocytes. FEBS Lett. 2002;516:47-52. 26. Samsel L, Zaidel G, Drumgoole HM, Jelovac D, Drachenberg C, Rhee JG, Brodie AM, Bielawska A, Smyth MJ. The ceramide analog, B13, induces apoptosis in prostate cancer cell lines and inhibits tumor growth in prostate cancer xenografts. Prostate. 2004;58:382-393. 27. Holman DH, Turner LS, El-Zawahry A, Elojeimy S, Liu X, Bielawski J, Szulc ZM, Norris K, Zeidan YH, Hannun YA, Bielawska A, Norris JS. Lysosomotropic acid ceramidase inhibitor induces apoptosis in prostate cancer cells. Cancer Chemother Pharmacol. 2008;61: 231-242. 28. Kwon OH. Synthesis and anticancer activity of Aryl-1,3propanediol thiourea derivatives. Chung-Ang Graduate School Master Thesis. 2002. 29. Park JG, Kramer BS, Steinberg SM, Carmichael J, Collins JM, Minna JD, Gazdar AF. Chemosensitivity testing of human colorectal carcinoma cell lines using a tetrazolium-based colorimetric assay. Cancer Research. 1987;47:5875-5879. 30. Manthey JA, Guthrie N. Antiproliferative activities of citrus flavonoids against six human cancer cell lines. J Agric Food Chem. 2002;50:5837-5843. 31. SYBYL Molecular Modeling Software. Tripos Inc., St. Louis, USA. 2010. 32. Chang YT, Choi J, Ding S, Prieschl EE, Baumruker T, Lee JM, Chung SK, Schultz PG. The synthesis and biological characterization of a ceramide library. J Am Chem Soc. 2002;124: 1856-1857..
(8)
수치
+2
관련 문서
