25(2) : 130-135 (2019)
https://doi.org/10.20307/nps.2019.25.2.130
130
Chemical Constituents of Impatiens balsamina Stems and Their Biological Activities
Dong Hyun Kim
1, Tae Hyun Lee
1, Lalita Subedi
2,3, Sun Yeou Kim
2,3, and Kang Ro Lee
1,*
1
Natural Products Laboratory, School of Pharmacy, Sungkyunkwan University, Suwon 16419, Korea
2
Gachon Institute of Parmaceutical Science, Gachon University, 191 Hambakmoero, Yeonsu-gu, Incheon 21936, Republic of Korea
3
College of pharmacy, Gachon University, 191 Hambakmoero, Yeonsu-gu, Incheon 21936, Republic of Korea
Abstract − The purification of the MeOH extract from Impatiens basamina by repeated column chromatography led to the isolation of one new tetrahydronaphthalene (1), together with eleven known compounds (2 - 12). The structure of the new compound (1) was determined by spectral data analysis (
1H and
13C-NMR,
1H-
1H COSY, HSQC, HMBC, NOESY, and HR-ESI-MS). Isolated compounds (1 - 12) were evaluated for their inhibitory effects on NO production in LPS-activated murine microglial BV-2 cells and their effects on NGF secretion from C6 glioma cells. Compounds 3, 7, and 10 reduced NO levels in LPS-activated murine microglial cells with IC
50values of 26.89, 25.59, and 44.21 µM, respectively. Compounds 1, 5, and 9 upregulated NGF secretion to 153.09 ± 4.66, 156.88 ± 8.86, and 157.34 ± 3.30%, respectively.
Keywords − Impatiens balsamina, balsaminaceae, tetrahydronaphthalene, neuroprotective effect
Introduction
Impatiens balsamina (Balsaminaceae), also known as Garden balsam, is widely distributed in Korea, China and India. I. balsamina has been used as Chinese medicine to treat anti-cancer and anti-inflammatory herb, also has been used as a Korean traditional medicine for the treatment of scrofulosis, carbuncle, and dysentery.
1-3Previous phytochemical investigations on I. balsamina reported the isolation of triterpenoid saponins, quinones, coumarin, flavonoids, and phenolic compounds, and there were several reports on various biological activities.
4-10Our earlier phytochemical investigation on white petal of I. balsamina resulted in the isolation of anti- neurodegenerative biflavonoid glycosides and anti- inflammatory phenolic compounds.
9,10In a continuing search for bioactive constituents from Korean medical plant sources, we investigated the MeOH extract of stems of I. balsamina. The purification of hexane and EtOAc fractions by repeated column chromatography led to the isolation of one new tetrahydronaphthalene (1), together with eleven known compounds (2 - 12). The structure of 1 was established on spectral data analysis (
1H and
13C-NMR,
1
H-
1H COSY, HSQC, HMBC, and NOESY). Isolated com-
pounds (1 - 12) were evaluated for their inhibitory effects on nitric oxide (NO) production in lipopolysaccharide (LPS)-activated murine microglial cells and their effects on NGF secretion from C6 glioma cells.
Experimental
General experimental procedures – Optical rotations were measured on a Jasco P-2000 polarimeter using methanol solvent. Ultraviolet (UV) spectra were recorded with a Shimadzu UV-1601 UV–vis spectrometer. High Resolution ESI Mass Spectrometer data were obtained with a Waters SYNAPT G2 mass spectrometer. Infrared (IR) spectra were recorded on a Bruker IFS-66/S Fourier- transform IR spectrometer. NMR spectra were recorded on Varian UNITY INOVA 500 NMR spectrometer at 500 MHz (
1H) and 125 MHz (
13C), and Bruker AVANCE III 700 NMR spectrometer at 700 MHz (
1H) and 175 MHz (
13C). Preparative HPLC was performed using a Gilson 321 pump with a Shodex Refractive Index Detector, YMC-Triart C
185 μm column (250 × 10 mm) and HAISIL 100 silica 5 μm column (250 × 10 mm). Silica gel 60 (Merck, 70 - 230 mesh and 230 – 400 mesh) and RP-C
18silica gel (Merck, 230 – 400 mesh) was used for column chromatography. LPLC was performed over a LiChroprep Lobar-A silica 60 column (Merck, 240 mm × 10 mm i.d.) equipped with a FMI QSY-0 pump. Merck precoated
*Author for correspondence
Kang Ro Lee, Natural Products Laboratory, School of Pharmacy, Sungkyunkwan University, Suwon 16419, Korea
Tel: +82-31-290-7710; E-mail: [email protected]
silica gel F
254plates and reversed-phase (RP)-18 F
254splates (Merck) were used for thin-layer chromatography (TLC). Spots were detected on TLC under UV light or by heating after spraying with anisaldehyde-sulfuric acid
Plant materials – The dried stems of I. balsamina (2 kg) were collected at Asan in Chungcheongnam-Do, Korea, in August 2014. The plants were identified by one of the authors (K.R.L.). A voucher specimen (SKKU- NPL-1425) of the plant was deposited in the herbarium of the School of Pharmacy at Sungkyunkwan University, Suwon, Korea.
Extraction and isolation – The dried stems of I.
balsamina (2 kg) were extracted with 80% MeOH at room temperature. The filtrate was evaporated in vacuo to yield MeOH extract (294 g), which was suspended in distilled H
2O (2.4 L) and then successively partitioned with hexane, CHCl
3, EtOAc and n-BuOH, yielding 20, 11, 6, and 28 g, respectively. The EtOAc fraction (5 g) was separated over a silica gel column with a solvent system of CHCl
3/ MeOH/water (7:1:0.1) to yielded five sub-fractions (E1- E5). Sub-fraction E1 (1.8 g) was chromatographed on a RP-C
18silica gel column with 30% aqueous MeOH to yield nine sub-fractions (E11-E19). Fraction E12 (430 mg) was purified by RP-C
18semi-prep. HPLC (30%
MeOH) to yield 2 (9 mg, t
R= 17.1 min). Fraction E2 (1.1 g) was separated by RP-C
18silica gel column with 30% aqueous MeOH to give nine sub-fractions (E21- E29). Sub-fraction E23 (161 mg) was purified using RP- C
18semi-prep. HPLC (30% MeOH) to yield 1 (20 mg, t
R= 15.1 min), 6 (24 mg, t
R= 21.1 min), and 3 (7 mg, t
R= 22.4 min). E3 (557 mg) was subjected to RP-C
18silica gel column with 45% aqueous MeOH to give five sub-fractions (E31-E35). Fraction E31 (148 mg) was purified by RP-C
18semi-prep. HPLC (30% CH
3CN) to
yield 4 (100 mg, t
R= 11.1 min). Fraction E5 (235 mg) was purified using RP-C
18semi-prep. HPLC (20% CH
3CN) to yield 5 (32 mg, t
R= 21.2 min). The hexane soluble fraction was chromatographed on a silica gel column with hexane/EtOAc (20:1 to 1:1) to give eight sub-fractions (H1-H8). Fraction H2 (546 mg) was subjected to using a RP-C
18silica gel column with 95% aqueous MeOH to yield 11 (9 mg, t
R= 34.4 min). Fraction H3 (918 mg) was separated to RP-C
18silica gel column with 90% aqueous MeOH to yield eight sub-fractions (H31-H38). Subfraction H32 (85 mg) was purified using RP-C
18semi-prep. HPLC (90% MeOH) to yield 7 (9 mg, t
R= 36.9 min). Fraction H36 (117 mg) was purified by semi-prep. HPLC (CHCl
3/ MeOH 120:1) to give 12 (88 mg, t
R= 11.0 min). Fraction H5 (2.4 g) was chromatographed on a RP-C
18silica gel column (95% aqueous MeOH) to give twelve sub-fractions (H51-H512). Subfraction H56 (89 mg) was purified using RP-C
18semi-prep. HPLC (95% MeOH) to yield 8 (4 mg, t
R= 17.8 min). Fraction H57 (169 mg) was purified by semi-prep. HPLC (hexane/EtOAc 3:1) to yield 9 (3 mg, t
R= 15.3 min). Fraction H512 (112 mg) was purified using semi-prep. HPLC (hexane/EtOAc 3:1) to give 10 (7 mg, t
R= 8.8 min).
1β,2α,4β-Triol-1,2,3,4-tetrahydronaphthalene (1) − Colorless gum. : -35.8 ( c 0.10, MeOH); IR (KBr) ν
maxcm
-1: 3348, 2938, 2836, 1448, 1412, 1055, 1025; UV (MeOH) λ
max(log ε) 201 (0.75), 213 (0.45), 217 (0.38), 262 (0.02) nm;
1H and
13C NMR : see Table 1; HRESIMS m/z 181.0865 [M+H]
+; (calcd. for C
10H
13O
3, 181.0865).
1β,2β,4β-Triol-1,2,3,4-tetrahydronaphthalene (2) − Colorless gum. : -57.8 ( c 0.11, MeOH); IR (KBr) ν
maxcm
-1: 3340, 2944, 2832, 1460, 1408, 1054, 1021; UV (MeOH) λ
max(log ε) 203 (1.28), 211 (1.11), 215 (0.92), 256 (0.04) nm;
1H and
13C NMR : see Table 1.
α [ ]
D25α [ ]
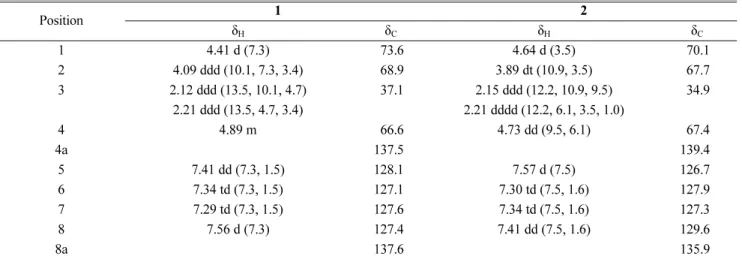
D25Table 1.
1H and
13C NMR data of 1 and 2 in CD
3OD. (δ in ppm, 500 MHz for
1H and 125 MHz for
13C)
aPosition 1 2
δ
Hδ
Cδ
Hδ
C1 4.41 d (7.3) 73.6 4.64 d (3.5) 70.1
2 4.09 ddd (10.1, 7.3, 3.4) 68.9 3.89 dt (10.9, 3.5) 67.7
3 2.12 ddd (13.5, 10.1, 4.7) 37.1 2.15 ddd (12.2, 10.9, 9.5) 34.9
2.21 ddd (13.5, 4.7, 3.4) 2.21 dddd (12.2, 6.1, 3.5, 1.0)
4 4.89 m 66.6 4.73 dd (9.5, 6.1) 67.4
4a 137.5 139.4
5 7.41 dd (7.3, 1.5) 128.1 7.57 d (7.5) 126.7
6 7.34 td (7.3, 1.5) 127.1 7.30 td (7.5, 1.6) 127.9
7 7.29 td (7.3, 1.5) 127.6 7.34 td (7.5, 1.6) 127.3
8 7.56 d (7.3) 127.4 7.41 dd (7.5, 1.6) 129.6
8a 137.6 135.9
a
J values are in parentheses and reported in Hz; the assignments were based on
1H-
1H COSY, HSQC, and HMBC experiments.
(7R,8S)-Dihydrodehydrodiconiferyl alcohol-9-β-O-
D- glucopyranoside (3) − White gum;
1H NMR (CD
3OD, 500 MHz): δ 6.99 (1H, d, J = 1.9 Hz, H-2), 6.85 (1H, dd, J = 8.1, 1.9 Hz, H-6), 6.79 (1H, s, H-6'), 6.75 (1H, d, J = 8.1 Hz, H-5), 6.72 (1H, s, H-2'), 5.58 (1H, d, J = 6.4 Hz, H-7), 4.35 (1H, d, J = 7.8 Hz, H-1''), 3.85 (3H, s, 3'-OCH
3), 3.82 (3H, s, 3-OCH
3), 3.56 (2H, t, J = 6.5 Hz, H-9'), 2.62 (2H, m, H-7'), 1.81 (2H, tt, J = 13.1, 6.5 Hz, H-8');
13C NMR (CD
3OD, 125 MHz): δ 147.6 (C-3), 146.1 (C-4), 146.0 (C-4'), 143.8 (C-3'), 135.6 (C-1'), 133.2 (C-1), 128.3 (C-5'), 118.4 (C-6), 116.8 (C-6'), 114.6 (C-5), 112.8 (C-2'), 109.4 (C-2), 102.8 (C-1''), 87.8 (C-7), 76.8 (C-5''), 76.7 (C-3''), 73.7 (C-2''), 70.9 (C-9), 70.2 (C- 4''), 61.3 (C-6''), 60.8 (C-9'), 55.4 (3'-OCH
3), 55.1 (3- OCH
3), 51.5 (C-8), 34.4 (C-8'), 31.5 (C-7').
Kaempferol-3-O-β-
D-glucopyranoside (4) − Yellow needles;
1H NMR (CD
3OD, 500 MHz): δ 8.08 (2H, d, J = 8.8 Hz, H-2', 6'), 6.91 (2H, d, J = 8.8 Hz, H-3', 5'), 6.43 (1H, s, H-8), 6.23 (1H, s, H-6), 5.28 (1H, d, J = 7.4 Hz, H- 1'');
13C NMR (CD
3OD, 125 MHz): δ 178.1 (C-4), 164.7 (C-7), 161.7 (C-5), 160.1 (C-4'), 157.7 (C-9), 157.1 (C-2), 134.0 (C-3), 130.8 (C-2', 6'), 121.4 (C-1'), 114.7 (C-3', 5'), 104.3 (C-10), 102.7 (C-1''), 98.5 (C-6), 93.6 (C-8), 77.2 (C-5''), 76.7 (C-3''), 74.3 (C-2''), 70.0 (C-4''), 61.2 (C-6'').
Nicotiflorin (5) − Yellow needles;
1H NMR (CD
3OD,
500 MHz): δ 8.09 (2H, d, J = 8.8 Hz, H-2', 6'), 6.91 (2H,
d, J = 8.8 Hz, H-3', 5'), 6.42 (1H, s, H-8), 6.23 (1H, d,
J = 1.8 Hz, H-6), 5.15 (1H, d, J = 7.4 Hz, H-1''), 4.54 (1H,
d, J = 0.9 Hz, H-1'''), 3.66 (1H, m, H-2'''), 3.55 (1H, dd,
J = 9.5, 3.3 Hz, H-3'''), 1.14 (3H, d, J = 6.2 Hz, H-6''');
13C
Fig. 1. Structures of compounds 1 - 12 isolated from I. balsamina.
NMR (CD
3OD, 125 MHz): δ 178.0 (C-4), 164.8 (C-7), 161.6 (C-5), 160.1 (C-4'), 158.0 (C-9), 157.2 (C-2), 134.1 (C-3), 130.1 (C-2', 6'), 121.4 (C-1'), 114.7 (C-3', 5'), 104.2 (C-10), 103.2 (C-1''), 101.0 (C-1'''), 98.6 (C-6), 93.5 (C- 8), 76.8 (C-3''), 75.8 (C-5''), 74.4 (C-2''), 72.5 (C-4'''), 70.9 (C-2'''), 70.7 (C-3'''), 70.0 (C-4''), 68.3 (C-5'''), 67.2 (C-6''), 16.5 (C-6''').
p-Hydroxybenzoic acid (6) − White gum;
1H NMR (CD
3OD, 500 MHz): δ 7.90 (2H, d, J = 8.8 Hz, H-2', 6'), 6.84 (2H, d, J = 8.8 Hz, H-3', 5');
13C NMR (CD
3OD, 125 MHz): δ 170.1 (C-7), 163.3 (C-4), 133.0 (C-2, 6), 122.8 (C-1), 116.0 (C-3, 5).
β-Amyrin (7) − Colorless gum;
1H NMR (CDCl
3, 500 MHz): δ 5.19 (1H, t, J = 3.6 Hz, H-12), 3.22 (1H, dd, J = 11.0, 4.6 Hz, H-3), 1.14 (3H, s, H-27), 1.01 (3H, s, H- 26), 0.97 (3H, s, H-23), 0.94 (3H, s, H-25), 0.88 (6H, s, H-29, 30), 0.84 (3H, s, H-28), 0.80 (3H, s, H-24);
13C NMR (CDCl
3, 175 MHz): δ 145.4 (C-13), 121.9 (C-12), 79.3 (C-3), 55.4 (C-5), 47.8 (C-9), 47.4 (C-18), 47.0 (C- 19), 41.9 (C-14), 40.0 (C-8), 39.0 (C-4), 38.8 (C-1), 37.3 (C-10), 37.2 (C-22), 34.9 (C-21), 33.5 (C-29), 32.8 (C-7), 32.7 (C-17), 31.3 (C-20), 28.6 (C-28), 28.3 (C-23), 27.3 (C-2), 27.1 (C-16), 26.3 (C-15), 26.2 (C-27), 23.9 (C-30), 23.7 (C-11), 18.5 (C-6), 17.0 (C-26), 15.8 (C-25), 15.7 (C-24).
Erythrodiol (8) − Colorless gum;
1H NMR (CDCl
3, 500 MHz): δ 5.20 (1H, t, J = 3.5 Hz, H-12), 3.55 (1H, d, J = 10.9 Hz, H-28a), 3.22 (1H, d, J = 10.9 Hz, H-28b), 3.22 (1H, d, J = 10.9 Hz, H-3), 1.17 (3H, s, H-27), 1.00 (3H, s, H-23), 0.95 (3H, s, H-26), 0.94 (3H, s, H-25), 0.89 (3H, s, H-29), 0.88 (3H, s, H-30), 0.79 (3H, s, H-24);
13C NMR (CDCl
3, 175 MHz): δ 144.2 (C-13), 122.4 (C-12), 79.0 (C-3), 69.7 (C-28), 55.2 (C-5), 47.6 (C-9), 46.5 (C- 19), 42.4 (C-18), 41.7 (C-14), 39.8 (C-8), 38.9 (C-4), 38.6 (C-1), 37.0 (C-10, 17), 34.1 (C-21), 33.2 (C-29), 32.6 (C- 7), 31.0 (C-20), 30.9 (C-22), 28.0 (C-23), 27.2 (C-2), 25.9 (C-27), 25.6 (C-15), 23.6 (C-11), 23.5 (C-30), 22.0 (C- 16), 18.3 (C-6), 16.7 (C-26), 15.6 (C-24), 15.5 (C-25).
α-Spinasterol (9) − White needles;
1H NMR (CDCl
3, 500 MHz): δ 5.16 (1H, dd, J = 15.7, 8.7 Hz, H-22), 5.03 (1H, dd, J = 15.2, 8.6 Hz, H-23), 3.60 (1H, tt, J = 10.9, 4.5 Hz, H-3), 1.03 (3H, d, J = 6.6 Hz, H-3), 0.85 (3H, d, J = 6.5 Hz, H-26), 0.56 (3H, s, H-18);
13C NMR (CDCl
3, 175 MHz): δ 139.8 (C-8), 139.4 (C-22), 129.7 (C-23), 117.7 (C-7), 71.3 (C-3), 56.1 (C-17), 55.4 (C-14), 51.5 (C-24), 49.7 (C-9), 43.5 (C-13), 41.0 (C-20), 40.5 (C-5), 39.7 (C-12), 38.2 (C-4), 37.4 (C-1), 34.4 (C-10), 32.1 (C- Table 2. Inhibitory effects of compounds 1 - 12 on NO production
in LPS-activated BV-2 cells
Compound IC
50(µM)
aCell Viability (% of LPS)
b1 50.29 89.42 ± 6.36
2 >500 93.08 ± 5.10
3 26.89 109.90 ± 3.47
4 60.27 107.24 ± 2.72
5 >500 92.35 ± 7.51
6 108.55 112.35 ± 4.80
7 25.59 111.09 ± 4.11
8 >500 82.11 ± 2.89
9 >500 91.41 ± 7.19
10 44.21 101.07 ± 2.86
11 94.38 97.45 ± 11.50
12 >500 86.83 ± 4.21
L
-NMMA
c21.40 100.14 ± 2.54
a
IC
50value of each compound was defined as the concentration (µM) that caused
50% inhibition of NO production in LPS-activated BV-2 cells.
b
Cell viability after treatment with 20 µM of each compound was determined by
MTT assay and is expressed in percentage (%). The results are averages of three
independent experiments, and the data are expressed as mean ± SD.
cL-NMMA as positive control.
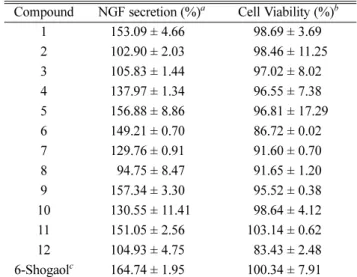
Table 3. Effects of compounds 1 - 12 on NGF secretion in C6 cells Compound NGF secretion (%)
aCell Viability (%)
b1 153.09 ± 4.66
898.69 ± 3.692 102.90 ± 2.03
898.46 ± 11.253 105.83 ± 1.44
897.02 ± 8.024 137.97 ± 1.34
896.55 ± 7.385 156.88 ± 8.86
896.81 ± 17.296 149.21 ± 0.70
886.72 ± 0.027 129.76 ± 0.91
891.60 ± 0.708
894.75 ± 8.47 891.65 ± 1.209 157.34 ± 3.30
895.52 ± 0.3810 130.55 ± 11.41
898.64 ± 4.1211 151.05 ± 2.56 103.14 ± 0.62
12 104.93 ± 4.75
883.43 ± 2.486-Shogaol
c164.74 ± 1.95 100.34 ± 7.91
a
C6 cells were treated with 20 µM of the compounds. After 24 h, the content of
NGF secreted into C6-conditioned media was measured by ELISA. The level of
secreted NGF is expressed as a percentage of the untreated con- trol (set at 100%).
Data are the mean ± SD of three independent experiments per- formed in triplicate.
b
Cell viability after treatment with 20 µM of each compound was determined by
the MTT assay and is expressed as a percentage (%). Results are the mean of three
independent experiments, and the data are expressed as the mean
± SD.
c
6-shogaol was used as positive control.
25), 31.7 (C-2), 29.9 (C-6), 28.7 (C-16), 25.6 (C-28), 23.2 (C-15), 21.8 (C-11), 21.6 (C-26), 21.3 (C-21), 19.2 (C- 27), 13.2 (C-19), 12.5 (C-29), 12.3 (C-18).
29-Nor-20-oxolupeol (10) − White gum;
1H NMR (CDCl
3, 500 MHz): δ 3.19 (1H, dd, J = 11.4, 4.8 Hz, H- 3), 2.58 (1H, td, J = 11.3, 6.0 Hz, H-19), 2.15 (3H, s, H- 30), 1.02 (3H, s, H-26), 0.97 (6H, s, H-23, 27), 0.83 (3H, s, H-25), 0.78 (3H, s, H-28), 0.76 (3H, s, H-24);
13C NMR (CDCl
3, 175 MHz): δ 213.1 (C-20), 79.2 (C-3), 55.5 (C-5), 52.9 (C-19), 50.5 (C-9), 49.9 (C-18), 43.3 (C- 14), 42.9 (C-17), 41.0 (C-8), 40.1 (C-22), 39.1 (C-4), 38.9 (C-1), 37.4 (C-10), 37.3 (C-13), 35.2 (C-16), 34.4 (C-7), 29.4 (C-30), 28.2 (C-23), 27.9 (C-21), 27.6 (C-15), 27.5 (C-2), 27.4 (C-12), 21.1 (C-11), 18.5 (C-6), 18.2 (C-28), 16.3 (C-25), 16.1 (C-26), 15.6 (C-24), 14.7 (C-27).
Lupenone (11) − Colorless gum;
1H NMR (CDCl
3, 500 MHz): δ 4.69 (1H, d, J = 2.4 Hz, H-29a), 4.57 (1H, dd, J = 2.4, 1.4 Hz, H-29b), 1.69 (3H, brs, H-30), 1.07 (6H, s, H-24, 26), 1.03 (3H, s, H-23), 0.96 (3H, s, H-27), 0.93 (3H, s, H-25), 0.80 (3H, s, H-28);
13C NMR (CDCl
3, 175 MHz): δ 218.2 (C-3), 150.9 (C-20), 109.4 (C-29), 54.9 (C-5), 49.8 (C-9), 48.2 (C-18), 47.9 (C-19), 47.3 (C- 4), 43.0 (C-14), 42.9 (C-17), 40.8 (C-8), 40.0 (C-22), 39.6 (C-2), 38.2 (C-13), 36.9 (C-10), 35.5 (C-16), 34.1 (C-1), 33.6 (C-7), 29.8 (C-21), 27.4 (C-15), 26.6 (C-23), 25.1 (C-12), 21.5 (C-11), 21.0 (C-24), 19.7 (C-6), 19.3 (C-30), 18.0 (C-28), 16.0 (C-25), 15.8 (C-26), 14.5 (C-27).
Lupeol (12) − White gum;
1H NMR (CDCl
3, 500 MHz):
δ 4.69 (1H, d, J = 2.3 Hz, H-29a), 4.57 (1H, dd, J = 2.4, 1.4 Hz, H-29b), 3.19 (1H, dd, J = 11.4, 4.9 Hz, H-3), 2.37 (1H, td, J = 11.1, 5.8 Hz, H-19), 1.68 (3H, brs, H-30), 1.03 (3H, s, H-26), 0.97 (3H, s, H-27), 0.95 (3H, s, H-23), 0.83 (3H, s, H-25), 0.79 (3H, s, H-24), 0.76 (3H, s, H-28);
13
C NMR (CDCl
3, 175 MHz): δ 151.2 (C-20), 109.4 (C- 29), 79.1 (C-3), 55.6 (C-5), 50.5 (C-9), 48.7 (C-19), 48.3 (C-18), 43.2 (C-17), 43.1 (C-14), 41.1 (C-8), 40.3 (C-22), 39.0 (C-1, 4), 38.3 (C-13), 37.2 (C-10), 35.6 (C-16), 34.4 (C-7), 30.1 (C-21), 28.4 (C-23), 27.9 (C-15), 27.7 (C-2), 25.4 (C-12), 21.3 (C-11), 19.7(C-30), 18.6 (C-6), 18.3(C- 28), 16.5 (C-25), 16.3 (C-26), 15.7 (C-24), 14.7 (C-27).
Measurement of NO Production and Cell Viability − Murine microglial BV-2 cells were plated into a 96-well plate (3 × 10
4cells/well). After 24 h, cells were pretreated with samples for 30 min and then stimulated with 100 ng/
mL of LPS for another 24 h. Nitrite, a soluble oxidation product of NO, was measured in culture media using the Griess reaction. The supernatant (50 μL) was harvested and mixed with an equal volume of Griess reagent (1%
sulfanilamide, 0.1% N-1-naphthylethylenediamine dihy- drochloride in 5% phosphoric acid). After 10 min, the
absorbance at 540 nm was measured using a microplate reader. Sodium nitrite was used as a standard to calculate the NO
2-concentration. Cell viability was tested by the 3- [4,5-dimethylthiazol-2-yl]-2,5-diphenyl-tetrazolium bromide (MTT) assay. N
G-Mono-methyl-
L-arginine was evaluated as a positive control.
NGF and cell viability assays − C6 glioma cells were used to measure NGF release into the medium. C6 cells were purchased from the Korean Cell Line Bank and maintained in DMEM supplemented with 10% FBS and 1% penicillin-streptomycin in a humidified incubator with 5% CO
2. C6 cells were seeded into 24-well plates (1 × 10
5cells/well). After 24 h, the cells were treated with DMEM containing 2% FBS and 1% penicillin-streptomycin with 20 μM of each sample for one day. The cell viability of the C6 cells was tested via an MTT assay. 6-shogaol was evaluated as a positive control.
Result and Discussion
The structures of compounds 2 - 12 were determined by comparison of their spectroscopic data with those in the literatures to be 1 β,2β,4β-triol-1,2,3,4-tetrahydronaphthalene (2),
11(7 R,8S)-dihydrodehydrodiconiferyl alcohol-9-O-β-
D
-glucopyranoside (3),
12kaempferol-3- O-β-
D-glucopyra- noside (4),
13nicotiflorin (5),
14p-hydroxybenzoic acid (6),
15β-amyrin (7),
16erythrodiol (8),
17α-spinasterol (9),
1829-nor- 20-oxolupeol (10),
19lupenone (11),
20and lupeol (12).
21Compound 1 was obtained as a colorless gum. The molecular formula was determined to be C
10H
12O
3, based on molecular ion peak [M+H]
+at m/z 181.0865 (calcd for C
10H
13O
3, 118.0865) in the positive-ion HR-ESI-MS. The IR spectrum of 1 indicated the presence of hydroxy group (3348 cm
-1). The
1H NMR spectrum of 1 showed the presence of a 1,2-disubstituted aromatic ring protons at δ
H7.56 (1H, d, J = 7.3 Hz), 7.41 (1H, dd, J = 7.3, 1.5 Hz), 7.34 (1H, td, J = 7.3, 1.5 Hz), and 7.29 (1H, td, J = 7.3, 1.5 Hz), three oxygenated proton signals at δ
H4.89 (1H, m), 4.41 (1H, d, J = 7.3 Hz), and 4.09 (1H, ddd, J = 10.1, 7.3, 3.4 Hz) and one methylene proton signal at δ
H2.21 (1H, ddd, J = 13.5, 4.7, 3.4 Hz), and 2.12 (1H, ddd, J = 13.5, 10.1, 4.7 Hz). The
13C NMR spectrum displayed 10 carbon signals, including aromatic carbon signals at δ
C137.6, 137.5, 128.1, 127.6, 127.4, and 127.1, three
oxygenated carbon signals at δ
C73.6, 68.9, and 66.6, one
methylene carbon signal at δ
C37.1. These NMR data
were similar to 1 α,2α,4β-triol-1,2,3,4-tetrahydronaphthalene,
except for chemical shifts and coupling constants of
methine protons.
22The location of hydroxyl groups was
confirmed by
1H-
1H COSY correlations and HMBC data
(Fig. 2). The relative configuration of 1 established based on coupling constants (
3J
1,2= 7.3 Hz,
3J
2,3= 10.1, 3.4 Hz, and
3J
3,4= 4.7 Hz) of
1H-NMR spectra, leading oxygenated protons at C-1, C-2, and C-4 to be as axial, axial, and equatorial positions, respectively (Fig. 2).
22,23In the NOESY spectrum, correlations of H-3
axwith H-1 and H- 4 indicated that OH groups at C-1 and C-4 were to be in the same orientation, and cross peak H-2/H-3
eqshowed that OH groups at C-1 and C-2 were to be in the opposite orientation (Fig. 2). Thus, the structure of 1 was established as 1 β,2α,4β-triol-1,2,3,4-tetrahydronaphthalene.
The isolated compounds (1 - 12) were evaluated for their inhibitory effects on NO production in LPS-activated murine microglial cells and their effects on NGF secretion from C6 glioma cells. Among them, compounds 3, 7, and 10 reduced NO levels in LPS-activated murine microglial BV-2 cells with IC
50values of 26.89, 25.59, and 44.21 μM, respectively. Compounds 1, 5, and 9 upregulated NGF secretion to 153.09 ± 4.66, 156.88 ± 8.86, and 157.34
± 3.30%, respectively.
Acknowledgments
This research was supported by the Basic Science Research Program through the National Research Foundation of Korea (NRF) funded by the Ministry of Education, Science and Technology (2012R1A5A2A 28671860). We are thankful to the Korea Basic Science Institute (KBSI) for the NMR and mass spectrum data.
References
(1) Meenu, B.; Neeraja, E. D.; Rejimon, G.; Varghese, A. J. Chem.
Pharm. Res. 2015, 7, 16-21.
(2) Ding, Z. S.; Jiang, F. S.; Chen, N. P.; Lv, G. Y.; Zhu, C. G. molecules 2008, 13, 220-229.
(3) Kang, S. N.; Goo, Y. M.; Yang, M. R.; Ibrahim, R. I. H.; Cho, J. H.;
Kim, I. S.; Lee, O. H. molecules 2013, 18, 6356-6365.
(4) Shoji, N.; Umeyama, A.; Yosikawa, K.; Nagai, M. Arihara, S.
Phytochemistry, 1994, 37, 1437-1441.
(5) Panichayupakaranant, P.; Noguchi, H.; De-Eknamkul, W.; Sankawa.
U. Phytochemistry, 1995, 40, 1141-1143.
(6) Li, Q.; Zhang, X.; Cao, J.; Guo, Z.; Lou, Y.; Ding, M.; Zhao, Y.
Fitoterapia 2015, 105, 234-239.
(7) Ishiguro, K.; Ohira, Y.; Oku, H. J. Nat. Prod. 1998, 61, 1126-1129.
(8) Imam, M. Z.; Nahar, N.; Akter, S.; Rana, M. S. J. Ethnopharmacol.
2012, 142, 804-810.
(9) Kim, C. S.; Subedi, L.; Kim, S. Y.; Choi, S. U.; Choi, S. J.; Son, M.
W.; Kim, K. H.; Lee, K. R. Phytochem. lett. 2015, 14, 215-220.
(10) Kim, C. S.; Bae, M.; O, J.; Subedi, L.; Suh, W. S.; Choi, S. Z.; Son, M. W.; Kim, S. Y.; Choi, S. U.; Oh, D. C.; Lee, K. R. J. Nat. Prod. 2017, 80, 471-478.
(11) Rashid, A.; Read, G. J. Chem. Soc. 1969, 15, 2053-2058.
(12) Zhao, X. C.; Du. J. L.; Xie, Y. G.; Zhang, Y.; Jin, H. Z. Chem. Nat.
Compd. 2018, 54, 556-558.
(13) Jayasinghe, U. L. B.; Balasooriya, B. A. I. S.; Bandara, A. G. D.;
Fujimoto, Y. Nat. Prod. Res. 2004, 18, 499-502.
(14) Park, S. Y.; Kim, S. J.; Lee, S. Y.; Bae, K. H.; Kang, S. S. Nat.
Prod. Sci. 2008, 14, 281-288.
(15) Rho, T. W.; Yoon, K. D. Nat. Prod. Sci. 2017, 23, 253-257.
(16) Wang, H.; Tian, X.; Chen, Y. Z. J. Chin. Chem. Soc. 2002, 49, 433- 436.
(17) Ge, Y. C.; Zhang, H. J.; Lei, J. X.; Wang, K. W. Chem. Nat.
Compd. 2018, 54, 600-602.
(18) Choi, S. Z.; Lee, S. O.; Choi, S. U.; Lee, K. R. Arch. Pharm. Res.
2003, 26, 521-525.
(19) Kotowicz, C.; Catalan, C. A. N.; Griffin, C. L.; Herz, W. Biochem.
Syst. Ecol. 2005, 33, 737-742.
(20) Puapairoj, P.; Naengchomnong, W.; Kijjoa, A.; Pinto, M. M.;
Pedro, M.; Nascimento, M. S.; Silva, A. M.; Herz, W. Planta Med. 2005, 71, 208-213.
(21) Fotie, J.; Bohle, D. S.; Leimanis, M. L.; Georges, E.; Rukunga, G.;
Nkengfack, A. E. J. Nat. Prod. 2006, 69, 62-67
(22) Chen, X. M; Qian, S. H; Feng, F. Chine. Chem. Lett. 2010, 21, 440-442.
(23) Naemura, K.; Wakebe, T.; Hirose, K.; Tobe, Y. Tetrahedron:
Asymmetry 1997, 15, 2585-2595.