Evaluation of mandibular buccal shelf
characteristics in the Colombian population:
A cone-beam computed tomography study
Objective: To evaluate the mandibular buccal shelf (MBS) in terms of the angulation and bone depth and thickness according to sex, age, and sagittal and vertical skeletal patterns in a Colombian population using cone-beam computed tomography (CBCT). Accordingly, the optimal site for miniscrew insertion in this area was determined. Methods: This descriptive, retrospective study included 64 hemi-arches of 34 patients. On CBCT images, the angulation, buccal bone depth (4 and 6 mm from the cementoenamel junction [CEJ] of MBS), and buccal bone thickness (6 and 11 mm from the CEJ of MBS) were measured at the mesial and distal roots of the mandibular first and second molars. Results: There were no statistically significant differences in the angulation, depth, and thickness of MBS between male and female patients. The values for the bone around the distal root of the mandibular second molar were significantly greater than the other values. The osseous characteristics were significantly better in participants aged 16–24 years. Class III patients exhibited the best osseous characteristics, with the bone depth at 6 mm being significantly different from that in Class I and Class II patients. Although values tended to be greater in patients with low angles, the difference was not statistically significant. Conclusions: MBS provides an optimal bone surface for miniscrew insertion, with better osseous characteristics at the distal root of the mandibular second molar, 4 mm from CEJ. Adolescent patients, Class III patients, and patients with a low angle exhibit the most favorable osseous characteristics in the MBS area.
[Korean J Orthod 2021;51(1):23-31]
Key words: Miniscrew, Cone-beam computed tomography, Bone-implant contact, Anchorage
Natalia Escobar-Correa
aMaria Antonia Ramírez- Bustamante
aLuis Alejandro Sánchez- Uribe
aJuan Carlos Upegui-Zea
aPatricia Vergara-Villarreal
bDiana Milena Ramírez- Ossa
aa
Department of Orthodontics, Faculty of Dentistry, University of Antioquia, Medellín, Colombia
b
Department of Orthodontics, Faculty of Dentistry, University of Cartagena, Cartagena, Colombia
Received May 13, 2020; Revised August 19, 2020; Accepted August 21, 2020.
Corresponding author: Diana Milena Ramírez-Ossa.
Professor, Orthodontic Program Director, Department of Orthodontics, Faculty of Dentistry, University of Antioquia, Calle 70 # 52-51, Medellín, Colombia.
Tel +57-4-219-6772 e-mail [email protected]
How to cite this article: Escobar-Correa N, Ramírez-Bustamante MA, Sánchez-Uribe LA, Upegui-Zea JC, Vergara-Villarreal P, Ramírez-Ossa DM. Evaluation of mandibular buccal shelf characteristics in the Colombian population: A cone-beam computed tomography study. Korean J Orthod 2021;51:23-31.
© 2021 The Korean Association of Orthodontists.
This is an Open Access article distributed under the terms of the Creative Commons Attribution Non-Commercial License (http://creativecommons.org/licenses/by-nc/4.0) which permits unrestricted non-commercial use, distribution, and reproduction in any medium, provided the original work is properly cited.
pISSN 2234-7518 • eISSN 2005-372X
https://doi.org/10.4041/kjod.2021.51.1.23
INTRODUCTION
The field of modern orthodontics faces the perma- nent challenge of developing and implementing new techniques, materials, and approaches that improve the efficiency of treatments. Miniscrews were developed to achieve this objective because they prevent anchorage loss in the reaction zone during orthodontic treat- ment. These miniscrews are inserted in the maxilla and mandible to provide different treatment alternatives in cases with dental crowding or nonsurgical solutions to avoid tooth extractions in cases with certain skeletal discrepancies.
1,2Since the popularization of the first temporary an- chorage device in the field of orthodontics,
3the design of such devices has been improved to optimize their use. Although they are temporary and must be removed once their objective has been achieved, their stability is important for successful function. Factors that influence the success or failure of miniscrews could be classified into patient-related factors (age, sex, skeletal pattern, and oral hygiene), miniscrew-related factors (diameter, length, and shape of the device), and treatment-related factors (technique, forces applied to the miniscrews, and their insertion site).
4The stability of miniscrews does not depend on osseo- integration; rather, it depends on mechanical retention due to the interaction between the miniscrew surface and the surrounding bone. This interaction is known as primary stability,
5and satisfactory primary stability re- quires an anatomical region with specific characteristics in terms of bone density, depth, thickness, and adequacy.
6Some researchers have evaluated bone characteristics in different regions of the maxilla, mandible, and alveolar bone in order to identify the best places for miniscrew insertion.
7,8The most preferred sites for their placement are the interradicular vestibular alveolar zone, hard pal- ate, and infrazygomatic crest; and in the mandible, these regions include mandibular triangle, retromolar area, and mandibular buccal shelf (MBS).
1,9-11In cases requiring retraction of the lower teeth, MBS is the best area for miniscrew insertion in the extra-alveolar bone of the posterior zone of the mandible.
12,13MBS is bilat- erally located buccal to the roots of the first and second mandibular molars and anterior to the oblique line of the mandibular ramus, and it provides adequate quantity and quality of bone for miniscrew insertion.
13However, variations in the depth and thickness of the bone along its course may affect miniscrew placement. Therefore, the purpose of this study was to evaluate MBS in terms of the angulation and bone depth and thickness accord- ing to sex, age, sagittal skeletal pattern (SSP), and verti- cal skeletal pattern (VSP) using cone-beam computed tomography (CBCT) images in a Colombian population.
Accordingly, we explored the optimal site for miniscrew insertion in this area.
MATERIALS AND METHODS
This descriptive, retrospective study included digital lateral cephalograms (DLCs) and CBCT records of 88 patients recruited from different private practices in the cities of Cartagena (n = 10), Medellín (n = 39), and Pereira (n = 39) in the country of Colombia. For all eli- gible patients, CBCT images were obtained as part of their initial records. These records were collected over a period of 10 months from May 2018 to February 2019 and were preselected according to the following inclu- sion criteria: 1) male or female patients aged > 16 years;
2) availability of initial records (DLC and unilateral or bilateral mandibular CBCT images) and presence of the second premolar and first and second molars; and 3) provision of informed consent for access to the records of each patient. The exclusion criteria were as follows:
1) incomplete or erroneous CBCT images; 2) extensive coronal restorations on the first and/or second molar;
and 3) findings like periapical lesions or periradicular pathologies (endodontic or periodontal in origin), osse- ous or odontogenic tumors, supernumerary teeth, and horizontal or vertical bone loss in the area of study.
The final sample included a total of 64 hemi-arches (32 on the right side and 32 on the left side) of 34 patients were included (30 with bilateral mandibular records, two with right hemi-arch records, and two with left hemi- arch records) and classified according to sex, age, SSP, and VSP. There was a female predominance (59%), and the mean age for the overall sample, male patients, and female patients was 30.7 ± 10.5, 28.8 ± 9.4, and 32.1 ± 11.9 years, respectively.
To define the skeletal diagnosis, DLCs were measured using the overbite depth indicator and the antero- posterior dysplasia indicator, as described by Kim,
14,15with Solid Edge 2019 Academic Edition Siemens© PLM software (https://www.plm.automation.siemens.com/
plmapp/education/solid-edge/en_us/free-software/stu- dent) (Table 1 and Figure 1). With regard to SSP, 44%, 35%, and 21% cases exhibited Class I, II, and III skeletal patterns, respectively. With regard to VSP, 21%, 12%, and 67% cases exhibited high, low, and neutral angles, respectively.
All CBCT records had been obtained using the I-CAT
CBCT scanner (Imaging Sciences International, Hatfield,
PA, USA) with the following parameters: field of view,
13–17 cm; 120 kVp; 37 mA; acquisition time, 26.9 sec-
onds; and voxel size resolution, 0.25 mm. The records
were imported into a 3-dimensional software platform
(OsiriX Lite v 10.0.5; Pixmeo, Bernex, Switzerland) for
the analysis of digital imaging and communications in
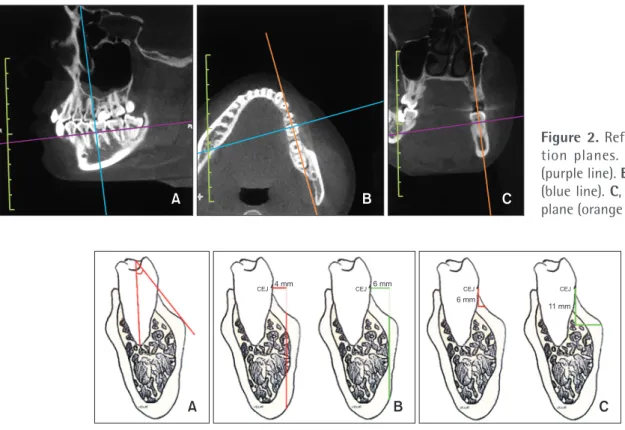
medicine (DICOM) multifiles. Before the measurements, three reference lines were considered for orientation in the different planes (Figure 2). 1) Axial plane (transverse):
This plane runs along the Y axis and allows the image to be moved from top to bottom. It is oriented at the furcation of the first and second mandibular molars; 2) Sagittal plane (anteroposterior): This plane runs along the Z axis and allows the image to be moved from right to left. It is located at the center of the dentoalveolar process from the mesial root of the mandibular first molar to the distal root of the mandibular second man- dibular molar; and 3) Frontal/coronal plane (vertical):
This plane belongs to the X axis and allows the image to be moved in the anterior and posterior directions. It is located at the axial axis of the four roots being evalu-
ated (mesial and distal roots of the mandibular first and second molars).
For each hemi-arch, four regions were selected for analysis: 1) mesial root of the first molar, 2) distal root of the first molar, 3) mesial root of the second molar, and 4) distal root of the second molar. The measure- ments made in each region are described below (Figures 3 and 4).
• Angulation of MBS: This was measured as the angle formed by the axial axis of the molar and a tangent to the outermost surface of the buccal shelf (inner angle).
• Apicocoronal depth: The cortical and medullary ves- tibular bone was measured by drawing two horizontal reference lines from the cementoenamel junction (CEJ), one at 4 mm and the other at 6 mm parallel to the Y axis. From these, two vertical lines were drawn toward the outermost part of the cortex.
• Thickness: The cortical and medullary buccal bone was measured by drawing two vertical reference lines from CEJ, one at 6 mm and the other at 11 mm paral- lel to the Z axis. From these, two horizontal lines were drawn toward the outermost part of the cortex.
Bias control
All measurements were performed by three examiners (DMRO, NEC, MARB) and repeated for nine randomly selected patients at an interval of 1 month, after theori- cal calibration with a gold standard (LASU – CS). Inter- and intraoperator concordances were evaluated on the basis of intraclass correlation and kappa coefficients, which should be ≥ 0.8. When the coefficients were < 0.8, the measurements and analyses were repeated until the established agreement limit was reached.
Statistical analysis
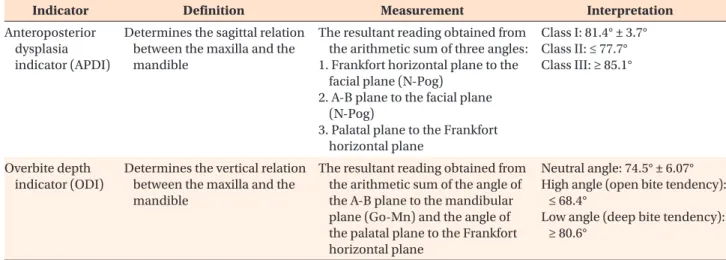
All statistical analyses were performed using IBM SPSS Table 1. Cephalometric analysis according to the method of Kim
14,15Indicator Definition Measurement Interpretation
Anteroposterior dysplasia indicator (APDI)
Determines the sagittal relation between the maxilla and the mandible
The resultant reading obtained from the arithmetic sum of three angles:
1. Frankfort horizontal plane to the facial plane (N-Pog)
2. A-B plane to the facial plane (N-Pog)
3. Palatal plane to the Frankfort horizontal plane
Class I: 81.4° ± 3.7°
Class II: ≤ 77.7°
Class III: ≥ 85.1°
Overbite depth indicator (ODI)
Determines the vertical relation between the maxilla and the mandible
The resultant reading obtained from the arithmetic sum of the angle of the A-B plane to the mandibular plane (Go-Mn) and the angle of the palatal plane to the Frankfort horizontal plane
Neutral angle: 74.5° ± 6.07°
High angle (open bite tendency):
≤ 68.4°
Low angle (deep bite tendency):
≥ 80.6°
N, nasion; Pog, pogonion; A, A point; B, B point; Go, gonion; Mn, menton.
Figure 1. Cephalometric analysis according to the meth-
od of Kim.
14,15Statistics ver. 23.0 (IBM Corp., Armonk, NY, USA). A spreadsheet was generated using Microsoft Excel 2016 (Microsoft, Redmond, WA, USA) to digitize the data
derived from the cephalograms and CBCT images. De- scriptive statistics (mean and standard deviation) were used to summarize the MBS measurements (angulation, depth, and thickness). Before the comparative analysis, the distribution of normality was evaluated using the Kolmogorov–Smirnov test.
To evaluate the variability in the osseous characteris- tics of MBS, Student’s t-test for independent samples was performed to compare the values for the angula- tion, depth, and thickness between the right and left hemi-arches and between male and female patients.
One-way analysis of variance (ANOVA) was used to com- pare the measurements according to the roots (mesial or distal) and molars (first or second), the age ranges, SSP, and VSP. When ANOVA showed statistically significant differences, a post-hoc test was performed; according to the variance homogeneity test, the Tukey or Games–
Howell test was applied. A p-value of < 0.05 was con- sidered statistically significant.
Ethical considerations
This study was approved by the Committee for the Figure 2. Reference orienta- tion planes. A, Axial plane (purple line). B, Sagittal plane (blue line). C, Frontal/Coronal plane (orange line).
A B C
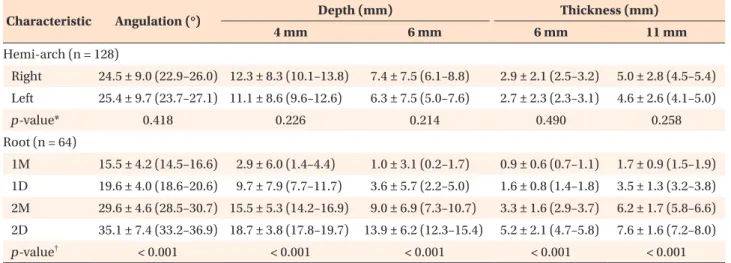
Figure 3. Analysis of the mandibular buccal shelf. A, Angulation: This is measured as the inner angle made by the axial axis of the molar and a tangent to the outermost surface of the buccal shelf. B, Apicocoronal depth: This is measured using two vertical lines drawn toward the outermost part of the cortex, from two horizontal reference lines from cemen- toenamel junction (CEJ), one at 4 mm and the other at 6 mm parallel to the Y axis. C, Thickness: This is measured using two horizontal lines drawn toward the outermost part of the cortex, from two vertical reference lines from CEJ, one at 6 mm and the other at 11 mm parallel to the Z axis.
A B C
6 mm CEJ 4 mm
11 mm
CEJ 6 mm CEJ CEJ
Figure 4. Representative images showing analysis of the mandibular buccal shelf on cone-beam computed tomography images. A, Angulation measurement. B, Api- cocoronal depth and thickness measurements. a: Depth measurements. b: Thickness measurements.
*References lines for depth measurement at 4 and 6 mm from the cementoenamel junction (CEJ).
†
Reference lines for thickness measurement at 6 and 11 mm from CEJ.
A B
Angulo: 34.48 /325.52
4 mm*
6 mm *
(b) 6 mm (b) 8.54 mm
(a) 14.9 mm (a) 17.8 mm 11 mm
6 mm
Development of Research and the Ethics Committee of the Faculty of Dentistry, University of Antioquia (Insti- tutional Review Board number 20-2018). None of the records were acquired for research purposes only.
RESULTS
There was no significant difference in any measure- ment between the left and right hemi-arches (p > 0.05;
Table 2). The values progressively increased from the anterior to the posterior area, being significantly lower at the mesial root of the first molar and greater at the distal root of the second molar (p < 0.05). The aver- age values were as follows: angulation, 35.1° ± 7.4°;
bone depth, 18.7 ± 3.8 and 13.9 ± 6.2 mm at 4 and 6 mm from CEJ, respectively; and bone thickness, 5.2 ± 2.1 and 7.6 ± 1.6 mm at 6 and 11 mm from CEJ, re- spectively (Table 2). For both molars, the bone depth was greater at 4 mm than at 6 mm from CEJ, while the thickness was greater at 11 mm than at 6 mm from CEJ (Table 2).
There were no significant differences in the angula- tion, depth, and thickness between male and female pa- tients (p > 0.05; Table 3). All values were greater for the age range of 16–24 years than for the other age ranges, with a statistically significant difference in the angula- tion and thickness at 6 mm from CEJ (Table 3).
With regard to SSP, Class III patients showed greater values than did Class I and Class II patients, with a sig- nificant difference in the bone depth at 6 mm from CEJ (p < 0.05; Table 4). With regard to VSP, the values tend-
ed to be greater for patients with low angles, although the difference was not statistically significant (p > 0.05;
Table 4).
DISCUSSION
Evidence has identified multiple factors to be related to the success or failure of miniscrews during orthodon- tic treatment; moreover, it has determined that bone characteristics play a fundamental role in this process in terms of their stability at the insertion site.
4,16-18In the present study, it was observed that the angula- tion, depth, and thickness of MBS increased progressive- ly from the anterior to the posterior area. This suggests that the best site for miniscrew insertion within MBS, in terms of the bone characteristics, is the bone around the distal root of the second molar, whereas the least indi- cated site is the bone around the mesial root of the first molar.
With regard to the angulation of MBS, the value was 19.6° ± 4.0° at the distal root of the first molar, 29.6° ± 4.6° at the mesial root of the second molar, and 35.1° ± 7.4° at the distal root of the second molar. Chang et al.
1documented similar values for an Oriental population (Taiwan), with an increase in the angulation from the first to the second molar as follows: 39.1° (interradicu- lar space between the first and second molars), 40.2°
(mesial surface of the second molar), and 55.2° (middle of the second molar). However, in our population, the angulation values were smaller; this suggests that Asian patients exhibit greater projection of MBS.
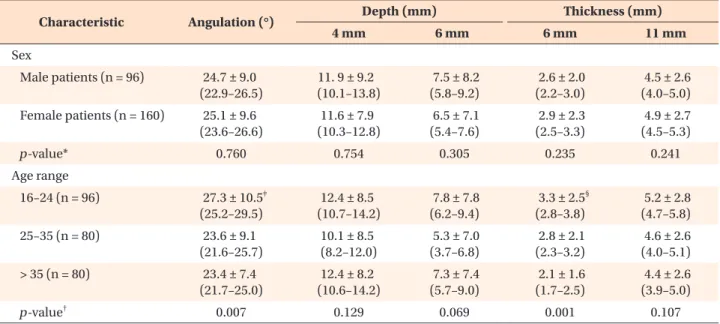
Table 2. Angulation, depth, and thickness of the mandibular buccal shelf according to the hemi-arch and molar root
Characteristic Angulation (°) Depth (mm) Thickness (mm)
4 mm 6 mm 6 mm 11 mm
Hemi-arch (n = 128)
Right 24.5 ± 9.0 (22.9–26.0) 12.3 ± 8.3 (10.1–13.8) 7.4 ± 7.5 (6.1–8.8) 2.9 ± 2.1 (2.5–3.2) 5.0 ± 2.8 (4.5–5.4) Left 25.4 ± 9.7 (23.7–27.1) 11.1 ± 8.6 (9.6–12.6) 6.3 ± 7.5 (5.0–7.6) 2.7 ± 2.3 (2.3–3.1) 4.6 ± 2.6 (4.1–5.0)
p-value* 0.418 0.226 0.214 0.490 0.258
Root (n = 64)
1M 15.5 ± 4.2 (14.5–16.6) 2.9 ± 6.0 (1.4–4.4) 1.0 ± 3.1 (0.2–1.7) 0.9 ± 0.6 (0.7–1.1) 1.7 ± 0.9 (1.5–1.9) 1D 19.6 ± 4.0 (18.6–20.6) 9.7 ± 7.9 (7.7–11.7) 3.6 ± 5.7 (2.2–5.0) 1.6 ± 0.8 (1.4–1.8) 3.5 ± 1.3 (3.2–3.8) 2M 29.6 ± 4.6 (28.5–30.7) 15.5 ± 5.3 (14.2–16.9) 9.0 ± 6.9 (7.3–10.7) 3.3 ± 1.6 (2.9–3.7) 6.2 ± 1.7 (5.8–6.6) 2D 35.1 ± 7.4 (33.2–36.9) 18.7 ± 3.8 (17.8–19.7) 13.9 ± 6.2 (12.3–15.4) 5.2 ± 2.1 (4.7–5.8) 7.6 ± 1.6 (7.2–8.0)
p-value
†< 0.001 < 0.001 < 0.001 < 0.001 < 0.001
Values are presented as mean ± standard deviation (95% confidence interval).
According to Tukey’s post-hoc test, all measurements showed differences between the mesial and distal roots.
n, total of measurements; 1M, mesial root of the first molar; 1D, distal root of the first molar; 2M, mesial root of the second molar; 2D, distal root of the second molar.
*p-values per Student’s t-test.
†
p-values per analysis of variance.
Table 3. Angulation, depth, and thickness of the mandibular buccal shelf according to sex and age
Characteristic Angulation (°) Depth (mm) Thickness (mm)
4 mm 6 mm 6 mm 11 mm
Sex
Male patients (n = 96) 24.7 ± 9.0 (22.9–26.5)
11. 9 ± 9.2 (10.1–13.8)
7.5 ± 8.2 (5.8–9.2)
2.6 ± 2.0 (2.2–3.0)
4.5 ± 2.6 (4.0–5.0) Female patients (n = 160) 25.1 ± 9.6
(23.6–26.6)
11.6 ± 7.9 (10.3–12.8)
6.5 ± 7.1 (5.4–7.6)
2.9 ± 2.3 (2.5–3.3)
4.9 ± 2.7 (4.5–5.3)
p-value* 0.760 0.754 0.305 0.235 0.241
Age range
16–24 (n = 96) 27.3 ± 10.5
‡(25.2–29.5)
12.4 ± 8.5 (10.7–14.2)
7.8 ± 7.8 (6.2–9.4)
3.3 ± 2.5
§(2.8–3.8)
5.2 ± 2.8 (4.7–5.8) 25–35 (n = 80) 23.6 ± 9.1
(21.6–25.7)
10.1 ± 8.5 (8.2–12.0)
5.3 ± 7.0 (3.7–6.8)
2.8 ± 2.1 (2.3–3.2)
4.6 ± 2.6 (4.0–5.1) > 35 (n = 80) 23.4 ± 7.4
(21.7–25.0)
12.4 ± 8.2 (10.6–14.2)
7.3 ± 7.4 (5.7–9.0)
2.1 ± 1.6 (1.7–2.5)
4.4 ± 2.6 (3.9–5.0)
p-value
†0.007 0.129 0.069 0.001 0.107
Values are presented as mean ± standard deviation (95% confidence interval).
n, total of measurements.
*p-values per Student’s t-test.
†
p-values per analysis of variance.
‡
Difference in the angulation between patients aged 16–24 years and older patients according to Tukey’s post-hoc test.
§
Difference in the thickness at 6 mm from the cementoenamel junction between patients aged 16–24 years and those aged > 35 years according to Tukey’s post-hoc test.
Table 4. Angulation, depth, and thickness of the mandibular buccal shelf according to the sagittal and vertical skeletal patterns
Characteristic Angulation (°) Depth (mm) Thickness (mm)
4 mm 6 mm 6 mm 11 mm
Sagittal skeletal pattern
Class I (n = 108) 24.1 ± 9.3 (22.3– 25.9)
11.2 ± 8.6 (9.6–12.9)
6.1 ± 7.1 (4.7–7.4)
2.7 ± 2.0 (2.3–3.1)
4.5 ± 2.6 (4.0–5.0) Class II (n = 96) 24.4 ± 9.0
(22.6–26.3)
11.0 ± 8.2 (9.3–12.7)
6.1 ± 7.2 (4.7–7.6)
2.6 ± 2.0 (2.2–3.0)
4.6 ± 2.7 (4.1–5.2) Class III (n = 52) 27.6 ± 9.8
(24.9–30.4)
14.1 ± 8.1 (11.8–16.3)
9.8 ± 8.2
†(7.5–12.1)
3.3 ± 2.7 (2.5–4.1)
5.5 ± 2.8 (4.8–6.3)
p-value* 0.065 0.079 0.007 0.131 0.064
Vertical skeletal pattern
Low angle (n = 32) 28.5 ± 9.8 (24.9–30.4)
12.7 ± 9.6 (11.8–16.3)
8.2 ± 8.7 (7.5–12.1)
3.4 ± 2.5 (2.5–4.1)
5.2 ± 2.7 (4.8–6.3) High angle (n = 52) 24.5 ± 9.4
(21.8–27.1)
12.3 ± 8.5 (9.9–14.7)
6.1 ± 7.8 (5.8–9.8)
2.7 ± 2.3 (2.1–3.3)
4.7 ± 2.8 (3.9–5.5) Neutral angle (n = 172) 24.4 ± 9.2
(23.0–25.8)
11.4 ± 8.2 (10.1–12.6)
6.3 ± 7.3 (5.2–7.4)
2.7 ± 2.1 (2.4–3.0)
4.7 ± 2.6 (4.3–5.1)
p-value* 0.071 0.614 0.265 0.248 0.559
Values are presented as mean ± standard deviation (95% confidence interval).
n, total of measurements.
*p-values per analysis of variance.
†