Three-dimensional analysis of dental decompensation for skeletal Class III malocclusion on the basis of vertical skeletal patterns obtained using cone-beam computed tomography
8
0
0
전체 글
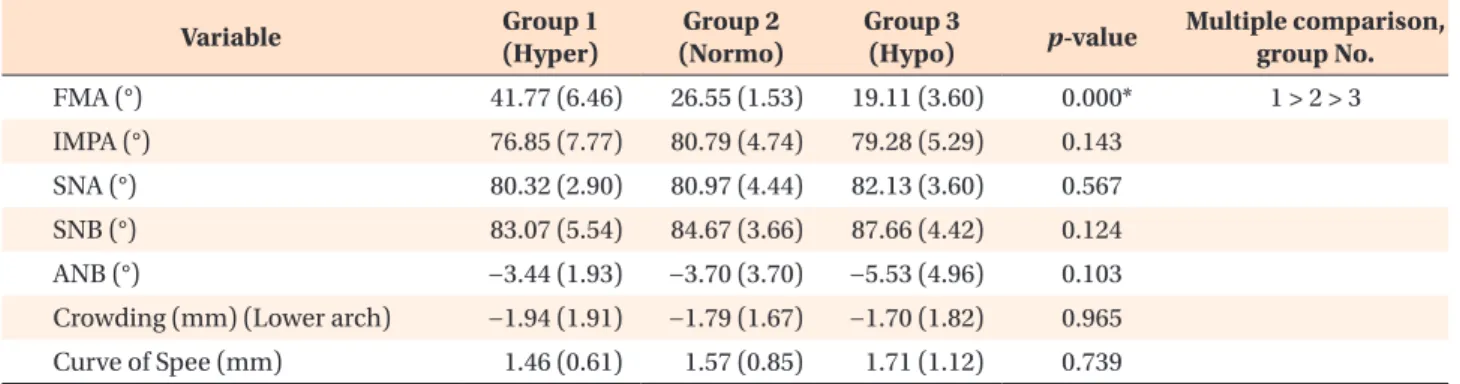
(2) Kim et al • 3D analysis of dental decompensation. INTRODUCTION Dental compensation manifests to varying degrees in the majority of patients undergoing orthognathic sur gery. In patients with skeletal Class III deformities, the natural compensatory mechanism compels the maxillary dentition to flare buccolabially, while lingual tipping of the incisors and posterior segments is generally observed in the mandibular dentition. Johnston et al.1 reported that if incisor decompensation during presurgical orthodontic treatment is inadequate, the surgical outcome can be unsatisfactory. Capelozza Filho et al.2 similarly reported a correlation between the extent of incisor decompensation, lower anterior facial height, mandibular setback surgery, and postoperative mandibular excess. Therefore, the extent of incisor decompensation obtained during presur gical orthodontic treatment dictates the magnitude of surgical change and is a major factor in determining the success or failure of treatment outcomes. Thus, achieve ment of dental decompensation during presurgical ortho dontic treatment is indispensible to maximizing surgical correction and ensuring dental stability.3 However, achieving adequate decompensation is some times difficult, due to neuromuscular function, bite force, periodontal health, and mandibular symphyseal thickness among other factors. In patients with strong masticatory muscles, it is difficult to achieve extrusion of the buccal segments during leveling of the curve of Spee. Even if the curve of Spee is left preoperatively, the space between the premolar teeth can easily be corrected postoperatively by extruding these teeth, as there are no occlusal contacts to oppose the tooth movement.4 For cases with a narrow symphysis, Wehrbein et al.5 have suggested that pronounced sagittal incisor movement and de-rotation are critical risk factors critical to progressive lingual and labial bone loss. In addition, Chung et al.6 found that the width of the symphyseal region and the alveolar height were significantly lower in patients with. open bite than in those with a negative overjet. There are limitations to tooth movement within the alveolar bone. Moreover, the range of tooth movement can differ depending on vertical facial skeletal patterns. Dentoalveolar compensation has been described relative to a variety of factors, including anteroposterior and vertical facial skeletal patterns. Therefore, clinicians need to understand the phenomenon of post-decompensation tooth movement in order to accurately predict orthog nathic surgery outcomes. In this regard, Ahn and Baek7 investigated dental decompensation in skeletal Class III patients using lateral cephalograms, but treated only the incisor position. Nam et al.8 studied the incisor and 1st molar positions using both lateral cephalograms and cast models. However, with the exception of the incisors, it was very difficult to assess post-decompensation tooth movement using lateral cephalograms. Furthermore, accur ate superimposition of their cast models was very difficult.8 Overall, there have been few successful orthognathic surgery studies measuring post-decom pensation tooth movement in skeletal Class III patients. The purpose of the present study was to evaluate, on the basis of vertical skeletal patterns, the presurgical orthodontic tooth movement of the incisors, canines, premolars, and 1st molars after dental decompensation in patients with skeletal Class III malocclusions. For the cases of skeletal Class III malocclusion examined, the null hypothesis was that there were no significant differences in presurgical orthodontic tooth movements after dental decompensation.. MATERIALS AND METHODS Subjects The cohort employed in this retrospective study com prised of 62 patients who had been diagnosed with skeletal Class III malocclusions and received presurgical orthodontic treatment at Pusan National University. Table 1. Demographic data and criteria by subgroup Group 1 (Hyper). Group 2 (Normo). Group 3 (Hypo). p-value. Multiple comparison, group No.. FMA (°). 41.77 (6.46). 26.55 (1.53). 19.11 (3.60). 0.000*. 1>2>3. IMPA (°). 76.85 (7.77). 80.79 (4.74). 79.28 (5.29). 0.143. SNA (°). 80.32 (2.90). 80.97 (4.44). 82.13 (3.60). 0.567. SNB (°). 83.07 (5.54). 84.67 (3.66). 87.66 (4.42). 0.124. ANB (°). −3.44 (1.93). −3.70 (3.70). −5.53 (4.96). 0.103. Crowding (mm) (Lower arch). −1.94 (1.91). −1.79 (1.67). −1.70 (1.82). 0.965. 1.46 (0.61). 1.57 (0.85). 1.71 (1.12). 0.739. Variable. Curve of Spee (mm). FMA, Frankfort mandibular-plane angle; IMPA, incisor mandibular plane angle; SNA, Sella-Nasion-A point angle; SNB, SellaNasion-B point angle; ANB, A point-Nasion-B point angle; Hyper, hyperdivergent group; Normo, normodivergent group; Hypo, hypodivergent group; *p < 0.05.. 228. http://dx.doi.org/10.4041/kjod.2012.42.5.227. www.e-kjo.org.
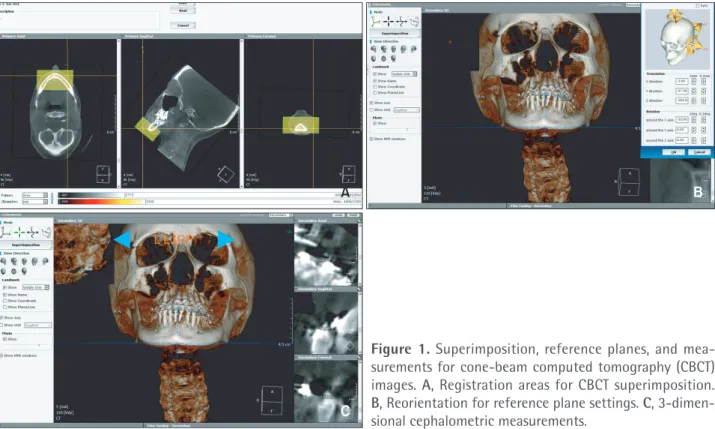
(3) Kim et al • 3D analysis of dental decompensation. Hospital. These subjects were divided into 3 groups according to their vertical skeletal patterns (Table 1): group I comprised 22 patients (age, 25.9 ± 5.8 years) with a hyperdivergent skeletal pattern (Frankfort mandibularplane angle [FMA] > 32°); group II, 20 patients (age, 24.3 ± 2.9 years) with a normodivergent skeletal pattern (22° < FMA ≤ 32°); and group III, 20 patients (age, 25.2 ± 6.1 years) with a hypodivergent skeletal pattern (FMA ≤ 21°). The exclusion criteria were as follows: metal restorations (crown, amalgam restoration), severe facial asymmetry (>3 mm difference in chin deviation), missing teeth, greater than 4 mm crowding/spacing, and cleft lip and/or palate. Roth prescription 0.022-inch straight-wire ceramic appliances were fully bonded. This study was reviewed and approved by the Institutional Review Board of Pusan National University Hospital (E-2011068). Image acquisition Images were obtained using a cone-beam computed tomography (CBCT) scanner (Pax-Zenith 3D; Vatech Co., Gyeonggi-Do, Korea) both before orthodontic treatment (T0) and surgery (T1). At the T1 stage, final archwires were 0.019 × 0.025˝ stainless-steel wires. The subjects were seated upright for maximum intercuspation and reposed lip without archwires. The scanner settings were as follows: field of view, 20 × 19 cm; tube voltage, 90 kVp; tube current, 4.0 mA; scan time, 24 seconds; isotropic voxel size, 0.30 mm. The CBCT raw data were. reformatted to three-dimensional (3D) images using 3D imaging software (Ondemand 3D; Cybermed Inc., Seoul, Korea). Image processing In order to analyze post-decompensation tooth move ment, CBCT data images of the symphyseal area and the lower part of the mandible below the root apex taken before orthodontic treatment (T0) and before surgery (T1) were superimposed according to maximization of the mutual information theory (Figure 1).9,10 Measurement of central incisor, canine, premolar, and 1st molar changes after presurgical orthodontic treatment The reference points and planes were defined as indi cated in Table 2. The following variables were used to evaluate tooth movement (Tables 2 and 3; Figure 1): anteroposterior changes of each tooth, I1-Me_per, C-Me_ per, P1-Me_per, P2-Me_per, M1-Me_per; vertical changes of each tooth, I1-MP, C-MP, P1-MP, P2-MP, M1-MP; and transverse changes of each tooth, I1-MSR, C-MSR, P1MSR, P2-MSR, M1-MSR. All variables were obtained from the right side, and 3D cephalometric measurements were performed by 2 investigators, both of whom had been trained in the use of the software and in the identification of pertinent landmarks. The differences between values for each. Figure 1. Superimposition, reference planes, and mea surements for cone-beam computed tomography (CBCT) images. A, Registration areas for CBCT superimposition. B, Reorientation for reference plane settings. C, 3-dimen sional cephalometric measurements.. www.e-kjo.org. http://dx.doi.org/10.4041/kjod.2012.42.5.227. 229.
(4) Kim et al • 3D analysis of dental decompensation. Table 2. Reference points and planes Landmark. Description. Point Go_inf. Most inferior point of the curvature along the angle of the mandible in the lateral view. Me. Most inferior point on the symphyseal outline in the anterior view. I1. Tip of mandibular right-central incisor. C. Tip of mandibular canine. P1. Buccal cusp tip of mandibular 1st premolar. P2. Buccal cusp tip of mandibular 2nd premolar. M1. Mesiobuccal cusp tip of mandibular 1st molar. Plane MP. Plane formed by Me and Go_inf on both sides. MSR. Perpendicular to the mandibular plane and passing through Me and between right and left Go_inf. Me-per. Perpendicular to the mandibular and MSR planes and passing through Me. Go_inf, Gonion_inf ; Me, menton; I1, incisor tip; C, canine tip; P1, 1st premolar; M1, 1st molar; MP, mandibular plane; MSR, midsagittal reference plane; Me-per, Menton-perpendicular plane.. Table 3. Measurement variables for tooth movement after presurgical orthodontic treatment Variable. Description. Anteroposterior change I1-Me_per Distance from I1 to Me_per C-Me_per. Distance from C to Me_per. P1-Me_per Distance from buccal cusp tip of P1 to Me_per P2-Me_per Distance from buccal cusp tip of P2 to Me_per M1-Me_per Distance from mesiobuccal cusp tip of M1 to Me_per Vertical change. Table 4. Average intraclass correlation coefficient for measurements Variable. Mean. 95% confidence interval range. I1-Me_per. 0.998. 0.996 - 0.999. C-Me_per. 0.996. 0.994 - 0.998. P1-Me_per. 0.777. 0.689 - 0.865. P2-Me_per. 0.871. 0.784 - 0.957. M1-Me_per. 0.834. 0.767 - 0.900. I1-MP. 0.997. 0.995 - 0.999. C-MP. 0.989. 0.984 - 0.994. I1-MP. Distance from I1 to MP. P1-MP. 0.879. 0.793 - 0.965. C- MP. Distance from C to MP. P2-MP. 0.829. 0.784 - 0.874. P1- MP. Distance from buccal cusp tip of P1 to MP. M1-MP. 0.786. 0.696 - 0.876. P2- MP. Distance from buccal cusp tip of P2 to MP. C-MSR. 0.994. 0.990 - 0.998. M1- MP. Distance from mesiobuccal cusp tip of M1 to MP. P1-MSR. 0.880. 0.784 - 0.976. P2-MSR. 0.808. 0.726 - 0.889. M1-MSR. 0.784. 0.667 - 0.901. Transverse change I1-MSR. Distance from I1 to MSR. C- MSR. Distance from C to MSR. P1- MSR. Distance from buccal cusp tip of P1 to MSR. P2- MSR. Distance from buccal cusp tip of P2 to MSR. M1- MSR. Distance from mesiobuccal cusp tip of M1 to MSR. I1, Incisor tip; Me, menton; Me-per, Me-perpendicular plane; C, canine tip; P1, 1st premolar; P2, 2nd premolar; M1, 1st molar; MP, mandibular plane; MSR, midsagittal reference plane.. 230. I1, Incisor tip; Me, menton; Me-per, Me-perpendicular plane; C, canine tip; P1, 1st premolar; P2, 2nd premolar; M1, 1st molar; MP, mandibular plane; MSR, midsagittal reference plane.. variable obtained at T0 and T1 stages were calculated. Statistical analysis The data were analyzed using a statistical software pack age program (SPSS ver. 12.0; SPSS Inc., Chicago, IL,. http://dx.doi.org/10.4041/kjod.2012.42.5.227. www.e-kjo.org.
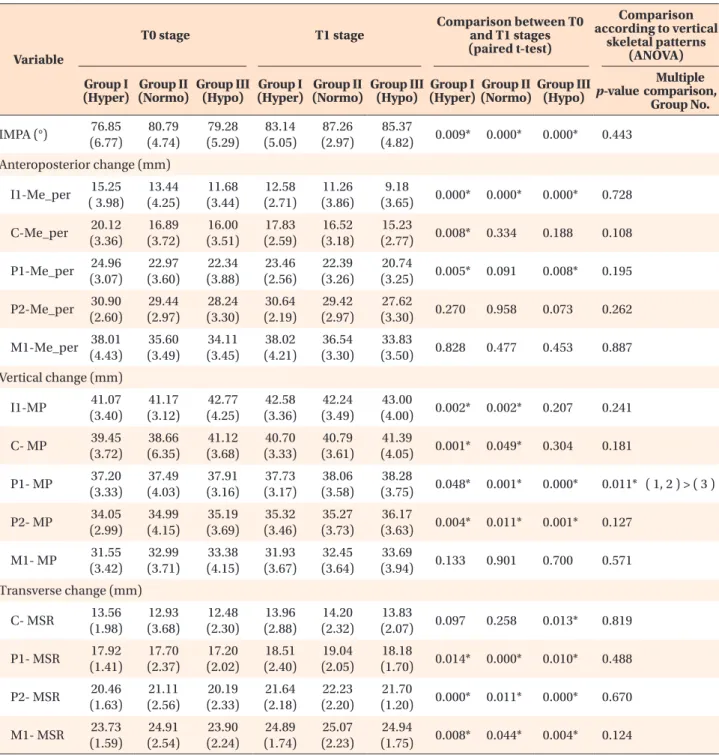
(5) Kim et al • 3D analysis of dental decompensation. USA). All variables were reassessed at 2-week intervals by the same investigator. The intraclass correlation coefficient (ICC) was the measure of the intra-investigator and interinvestigator errors determining reproducibility. A paired t-test was conducted to evaluate tooth movement changes. after presurgical orthodontic treatment. To determine the differences in changes in tooth movement according to vertical skeletal patterns, an analysis of variance (ANOVA) with Scheffe’s multiple comparison test was used (p < 0.05).. Table 5. Comparison of variables among groups according to skeletal patterns and changes between initial (T0) and presurgical (T1) stages T0 stage. Comparison Comparison between T0 according to vertical and T1 stages skeletal patterns (paired t-test) (ANOVA). T1 stage. Variable. Multiple Group I Group II Group III Group I Group II Group III Group I Group II Group III (Hyper) (Normo) (Hypo) (Hyper) (Normo) (Hypo) (Hyper) (Normo) (Hypo) p-value comparison, Group No. IMPA (°). 76.85 (6.77). 80.79 (4.74). 79.28 (5.29). 83.14 (5.05). 87.26 (2.97). 85.37 (4.82). 0.009*. 0.000*. 0.000*. 0.443. Anteroposterior change (mm) I1-Me_per. 15.25 ( 3.98). 13.44 (4.25). 11.68 (3.44). 12.58 (2.71). 11.26 (3.86). 9.18 (3.65). 0.000*. 0.000*. 0.000*. 0.728. C-Me_per. 20.12 (3.36). 16.89 (3.72). 16.00 (3.51). 17.83 (2.59). 16.52 (3.18). 15.23 (2.77). 0.008*. 0.334. 0.188. 0.108. P1-Me_per. 24.96 (3.07). 22.97 (3.60). 22.34 (3.88). 23.46 (2.56). 22.39 (3.26). 20.74 (3.25). 0.005*. 0.091. 0.008*. 0.195. P2-Me_per. 30.90 (2.60). 29.44 (2.97). 28.24 (3.30). 30.64 (2.19). 29.42 (2.97). 27.62 (3.30). 0.270. 0.958. 0.073. 0.262. M1-Me_per. 38.01 (4.43). 35.60 (3.49). 34.11 (3.45). 38.02 (4.21). 36.54 (3.30). 33.83 (3.50). 0.828. 0.477. 0.453. 0.887. Vertical change (mm) I1-MP. 41.07 (3.40). 41.17 (3.12). 42.77 (4.25). 42.58 (3.36). 42.24 (3.49). 43.00 (4.00). 0.002*. 0.002*. 0.207. 0.241. C- MP. 39.45 (3.72). 38.66 (6.35). 41.12 (3.68). 40.70 (3.33). 40.79 (3.61). 41.39 (4.05). 0.001*. 0.049*. 0.304. 0.181. P1- MP. 37.20 (3.33). 37.49 (4.03). 37.91 (3.16). 37.73 (3.17). 38.06 (3.58). 38.28 (3.75). 0.048*. 0.001*. 0.000*. 0.011* ( 1, 2 ) > ( 3 ). P2- MP. 34.05 (2.99). 34.99 (4.15). 35.19 (3.69). 35.32 (3.46). 35.27 (3.73). 36.17 (3.63). 0.004*. 0.011*. 0.001*. 0.127. M1- MP. 31.55 (3.42). 32.99 (3.71). 33.38 (4.15). 31.93 (3.67). 32.45 (3.64). 33.69 (3.94). 0.133. 0.901. 0.700. 0.571. Transverse change (mm) C- MSR. 13.56 (1.98). 12.93 (3.68). 12.48 (2.30). 13.96 (2.88). 14.20 (2.32). 13.83 (2.07). 0.097. 0.258. 0.013*. 0.819. P1- MSR. 17.92 (1.41). 17.70 (2.37). 17.20 (2.02). 18.51 (2.40). 19.04 (2.05). 18.18 (1.70). 0.014*. 0.000*. 0.010*. 0.488. P2- MSR. 20.46 (1.63). 21.11 (2.56). 20.19 (2.33). 21.64 (2.18). 22.23 (2.20). 21.70 (1.20). 0.000*. 0.011*. 0.000*. 0.670. M1- MSR. 23.73 (1.59). 24.91 (2.54). 23.90 (2.24). 24.89 (1.74). 25.07 (2.23). 24.94 (1.75). 0.008*. 0.044*. 0.004*. 0.124. Hyper, Hyperdivergent group; Normo, normodivergent group; Hypo, hypodivergent group; IMPA, incisior mandibular plane angle; I1, incisor tip; Me, menton; Me-per, Me-perpendicular plane; C, canine tip; P1, 1st premolar; P2, 2nd premolar; M1, 1st molar; MP, mandibular plane; MSR, midsagittal reference plane. *p < 0.05.. www.e-kjo.org. http://dx.doi.org/10.4041/kjod.2012.42.5.227. 231.
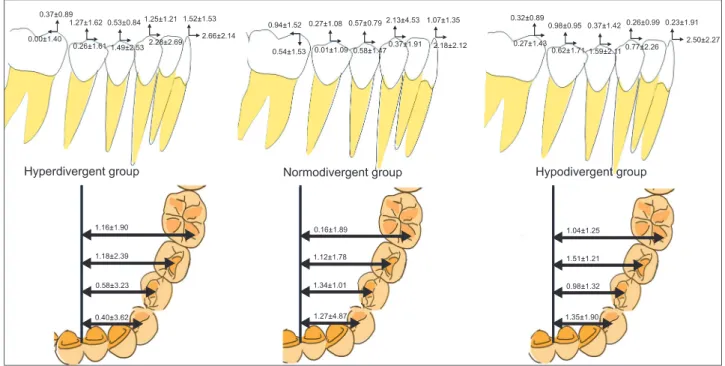
(6) Kim et al • 3D analysis of dental decompensation. RESULTS The average ICC was 0.887 (95% confidence interval [CI], lower = 0.803, upper = 0.999). The ICC of P1-Me_ per was the lowest, and that of I1-Me_per was the high est (Table 4). There were no significant differences in the anteroposterior skeletal pattern, IMPA, or crowding between groups at stage T0 (p > 0.05, Table 1). Anteroposterior changes The incisors moved forward after dental decompensation in groups I, II, and III (I1-Me_per) (p < 0.05). The ca nines also moved forward in group I (C-Me_per), along with the 1st premolars in groups I and III (P1-Me_per). However, there were no significant differences in the extent of anteroposterior change between groups I, II, and III (p > 0.05; Table 5, Figure 2). Vertical changes The incisors and canines were extruded after presurgical orthodontics in groups I and II (I1-MP). The 1st and 2nd premolars were also extruded in groups I, II, and III (C-MP) (p < 0.05). There were significant differences between the groups with respect to vertical changes in the 1st premolars. The 1st premolar showed less change in group III (P1-MP) than in groups I and II (p < 0.05; Table 5, Figure 2).. Transverse changes The canines moved laterally in group III (C-MSR), as did the 1st premolars, 2nd premolars, and 1st molars in groups I, II, and III (P1-MSR, P2-MSR, M1-MSR), respectively (p < 0.05; Table 5, Figure 2). However, there was no significant difference between the groups.. DISCUSSION For satisfactory treatment outcomes, orthognathic surgery patients clearly require presurgical orthodontic treatment. Capelozza Filho et al.2 reported a correlation between decompensation and the extent of mandibular reduction during surgery, as well as a strong correlation between cephalometric postsurgical mandibular excess and the lower anterior facial height. Precise treatment planning requires information on individual tooth movement and changes in arch dimensions; again, presur gical orthodontic treatment is a necessity.11 In the present study, the CBCT superimposition method was employed to provide a stable reference plane for assessment of mandibular tooth movement. Ahn and Baek7 reported that incisors moved labially as a result of presurgical orthodontic treatment according to skeletal anteroposterior discrepancy and vertical type in 4 subgroups. Specifically, they concluded that the skeletal anteroposterior discrepancy/vertical type of patients resulted in differences in the extent and pattern of initial compensation, preoperative decompensation,. Figure 2. Tooth movement (mm) after dental decompensation according to vertical skeletal pattern. Data are mean ± standard deviation.. 232. http://dx.doi.org/10.4041/kjod.2012.42.5.227. www.e-kjo.org.
(7) Kim et al • 3D analysis of dental decompensation. and postoperative compensation of the lower incisors in Class III patients.7 In the present study, the extent of incisor movement between T0 and T1 stages was also determined. In groups I, II, and III, the results for anteroposterior incisor movement were consistent with those of Ahn and Baek. 7 However, there were no significant differences between groups (p > 0.05). The vertical skeletal pattern did not affect the extent of labial incisor movement (Table 5, Figure 2). Regarding vertical incisor movement, groups I and II showed extrusion after dental decompensation. In group III (patients with hypodivergent patterns), the vertical position of the incisors was maintained at the T1 stage. However, there were no significant differences between the groups (p > 0.05); though the incisors were extruded in groups I and II, the extent of vertical movement was no more than 1.5 mm. During dental decompensation, the mandibular incisors tended to move labially in groups I, II, and III and maintained their vertical positioning in the mandibular plane in group III. We observed that the 1st and 2nd premolars and the 1st molars moved laterally in groups I, II, and III. In group III (patients with the hypodivergent pattern), the C-MSR increased only to the extent of the transverse change (Table 5, Figure 2; p < 0.05). Using cast model analysis, Nam et al.8 similarly reported that the inter-1st and 2nd premolar arch widths increased after surgery. However, they observed no significant differences in the intercanine or inter-1st molar widths. In contrast, the present study reports that the arch width changed during postoperative orthodontic treatment. Regarding canine movement, the hypodivergent skeletal pattern (group III) showed a distinct transverse change after dental decompensation, rather than anteroposterior or vertical changes (Table 5, Figure 2). The only anterior and vertical movements observed were in the hyperdivergent skeletal pattern (group I), and patients with normodivergent skeletal patterns (group II) showed only canine extrusion. In fact, distinct differences in canine movement patterns were apparent between the hyperdivergent and hypodivergent groups. These differences in movement might have been influenced by muscle forces, as patients in the hyperdivergent group typically have a much weaker occlusal force than those in the other groups.12 After dental decompensation, the 1st premolars moved in all 3 reference planes. This movement of the 1st premolars served to relieve crowding and level the mandi bular arch with incisors. In contrast, the 1st molars did not show any distinct change, with the exception of an intermolar width increase. The movement of the 2nd premolars was similar to that of the 1st premolars and 1st molars, which is consistent with observations made in previous studies.8,13 However, other studies have not provided information on vertical and anteroposterior. www.e-kjo.org. http://dx.doi.org/10.4041/kjod.2012.42.5.227. movements. The present study found that the skeletal facial pattern affected the vertical change of the 1st premolars. The hypodivergent group showed the least extrusion of the 1st premolars. Pandis et al.14 investigated the effects of leveling the curve of Spee on the inclination of the mandibular incisors and the width of the mandi bular arch, concluding that the curve of Spee was mainly “flattened” by proclining the mandibular incisors. For 1 mm of leveling, the mandibular incisors were proclined 4 degrees, without increasing the arch width. Using the continuous archwire technique, Bernstein et al.15 con cluded that leveling of the curve of Spee took place via a combination of premolar extrusion and (to a lesser extent) incisor intrusion. Our results also showed that the largest changes were in the incisors anteroposteriorly. However, the curve of Spee was also flattened by premolar extrusion. Furthermore, after dental decompensation, the incisors were not only proclined but also extruded. There have been several studies on incisor movement during leveling of the mandibular arch.16,17 In the present study, the incisors were mostly proclined and extruded or maintained and the premolars were extruded. The incisors and premolars reduced the curve of Spee. Our results further indicate that the 1st molars main tained their original position after presurgical orthodontic treatment, with the exception of buccoversion. This result did not differ between the groups (Table 5, Figure 2; p < 0.05). The 1st molar, therefore, could be a key tooth with regards to anteroposterior movement for initial surgical treatment objectives.. CONCLUSION There have been few successful cephalometric studies evaluating post-decompensation of the mandibular dentition, with the exception of the incisors and 1st molars. Rather, most have been limited to assessing the changes to the curve of Spee.15-17 In the present study, we evaluated post-decompensation mandibular tooth movement using the CBCT superimposition method. Our results indicate that changes to the mandibular arch during presurgical orthodontic treatment of skeletal Class III malocclusion are affected by the incisors, canines, 1st and 2nd premolars, and 1st molars. After dental decompensation, the mandibular arch indeed distinctly changed. Notably, movement of the mandibular incisors and premolars resolved the dental compensation. The skeletal facial pattern did not affect dental decom pensation except for the vertical change in the 1st pre molars. Statistically, the hypodivergent group showed the least 1st premolar extrusion. However, this difference in 1st premolar extrusion according to vertical skeletal pattern was clinically insignificant.. 233.
(8) Kim et al • 3D analysis of dental decompensation. REFERENCES 1. Johnston C, Burden D, Kennedy D, Harradine N, Stevenson M. Class III surgical-orthodontic treatment: a cephalometric study. Am J Orthod Dentofacial Orthop 2006;130:300-9. 2. Capelozza Filho L, Martins A, Mazzotini R, da Silva Filho OG. Effects of dental decompensation on the surgical treatment of mandibular prognathism. Int J Adult Orthodon Orthognath Surg 1996;11:165-80. 3. Jacobs JD, Sinclair PM. Principles of orthodontic me chanics in orthognathic surgery cases. Am J Orthod 1983;84:399-407. 4. Proffit WR, Fields HW Jr, Sarver DM. Contemporary orthodontics. 4th ed. St.Louis: Mosby; 2007. p. 705-10. 5. Wehrbein H, Bauer W, Diedrich P. Mandibular inci sors, alveolar bone, and symphysis after orthodontic treatment. A retrospective study. Am J Orthod Dento facial Orthop 1996;110:239-46. 6. Chung CJ, Jung S, Baik HS. Morphological charac teristics of the symphyseal region in adult skeletal Class III crossbite and openbite malocclusions. Angle Orthod 2008;78:38-43. 7. Ahn HW, Baek SH. Skeletal anteroposterior discre pancy and vertical type effects on lower incisor pre operative decompensation and postoperative com pensation in skeletal Class III patients. Angle Orthod 2011;81:64-74. 8. Nam HJ, Son WS, Park SB, Kim SS. Changes of mandibular dental arch during surgical-orthodontic treatment in skeletal class III malocclusion individuals. Korean J Orthod 2008;38:283-98. 9. Maes F, Collignon A, Vandermeulen D, Marchal G, Suetens P. Multimodality image registration by. 234. maximization of mutual information. IEEE Trans Med Imaging 1997;16:187-98. 10. Choi JH, Mah J. A new method for superimposition of CBCT volumes. J Clin Orthod 2010;44:303-12. 11. Cho MY, Choi JH, Lee SP, Baek SH. Three-dimen sional analysis of the tooth movement and arch di mens ion changes in Class I malocclusions treated with first premolar extractions: a guideline for virtual treatment planning. Am J Orthod Dentofacial Orthop 2010;138:747-57. 12. Proffit WR, Fields HW, Nixon WL. Occlusal forces in normal- and long-face adults. J Dent Res 1983;62:56670. 13. Lee HK, Son WS. A study on basal and dental arch width in skeletal Class III malocclusion. Korean J Orthod 2002;32:117-27. 14. Pandis N, Polychronopoulou A, Sifakakis I, Makou M, Eliades T. Effects of levelling of the curve of Spee on the proclination of mandibular incisors and expansion of dental arches: a prospective clinical trial. Aust Orthod J 2010;26:61-5. 15. Bernstein RL, Preston CB, Lampasso J. Leveling the curve of Spee with a continuous archwire technique: a long term cephalometric study. Am J Orthod Dento facial Orthop 2007;131:363-71. 16. Fleming PS, DiBiase AT, Sarri G, Lee RT. Comparison of mandibular arch changes during alignment and leveling with 2 preadjusted edgewise appliances. Am J Orthod Dentofacial Orthop 2009;136:340-7. 17. Preston CB, Maggard MB, Lampasso J, Chalabi O. Long-term effectiveness of the continuous and the sectional archwire techniques in leveling the curve of Spee. Am J Orthod Dentofacial Orthop 2008;133:5505.. http://dx.doi.org/10.4041/kjod.2012.42.5.227. www.e-kjo.org.
(9)
수치

+2
관련 문서
UABT Upper labial or lingual distance from the root surface to the cortical bone at each root level (0 to 10) LABT Lower labial or lingual distance from the root surface to the
Objective: The aim of this study is to quantitatively evaluate the stability of the skeletal and dental widths using cone-beam computed tomography CBCT after segmental Le Fort
