Cone-beam computed tomography for the
assessment of root–crown ratios of the maxillary
and mandibular incisors in a Korean population
Objective: This retrospective, cross-sectional study aimed to establish reference data for normal crown and root lengths and the root–crown ratios (R/C ratios) for the mature maxillary and mandibular incisors in a Korean population by using cone-beam computed tomography (CBCT). Methods: We included 672 Korean patients (141 men and 531 women; mean age, 27.2 ± 7.7 years) who underwent CBCT examinations during various dental treatments. Crown and root lengths and the R/C ratios of the maxillary and mandibular incisors were measured using CBCT data, which were analyzed to detect significant differences between demographic factors as well as sagittal and vertical skeletal or occlusal relationships. Results: Teeth of the same type in each half-arch were symmetrical. The mean R/C ratios varied from 1.1 to 1.2 for the maxillary incisors and from 1.3 to 1.4 for the mandibular incisors. Crown and root lengths were greater in men than in women, regardless of tooth type. Root lengths and R/C ratios for the mandibular incisors were significantly greater in patients with skeletal Class II malocclusion or an excessive overjet than in the other patients. The R/C ratios for the mandibular incisors were lower in patients with an open bite than in those with a normal or deep bite. Moreover, the R/C ratios for the mandibular incisors increased with age. Conclusions: The data obtained in our study can serve as reference values for crown and root lengths and the R/C ratios for the maxillary and mandibular incisors in the Korean population. [Korean J Orthod 2017;47(1):39-49]
Key words: Tooth crown, Tooth root, Incisor, Cone-beam computed tomography, Population Sung-Hwan Choia Jung-Suk Kimb Cheol-Soon Kimb Hyung-Seog Yua Chung-Ju Hwanga
aDepartment of Orthodontics, The
Institute of Craniofacial Deformity, College of Dentistry, Yonsei University, Seoul, Korea
bPrivate Practice, Seongnam, Korea
Received February 2, 2016; Revised April 18, 2016; Accepted June 10, 2016.
Corresponding author: Chung-Ju Hwang.
Professor, Department of Orthodontics, The Institute of Craniofacial Deformity, College of Dentistry, Yonsei University, 50-1 Yonsei-ro, Seodaemun-gu, Seoul 03722, Korea.
Tel +82-2-2228-3106 e-mail [email protected]
© 2017 The Korean Association of Orthodontists.
The authors report no commercial, proprietary, or financial interest in the products or companies described in this article.
This is an Open Access article distributed under the terms of the Creative Commons Attribution Non-Commercial License (http://creativecommons.org/licenses/by-nc/4.0) which permits unrestricted non-commercial use, distribution, and reproduction in any medium, provided the original work is properly cited.
pISSN 2234-7518 • eISSN 2005-372X https://doi.org/10.4041/kjod.2017.47.1.39
INTRODUCTION
Unfavorable root–crown ratios (R/C ratios) for the maxillary and mandibular incisors can affect the prognosis of various dental treatments. Previous studies have shown that the maxillary and mandibular incisors are the most susceptible to external apical root
resorp-tion during orthodontic treatment.1-3 Several factors are
known to contribute to root resorption in the anterior teeth, including ethnic differences, abnormal root shape (blunt or pipette), and an excessive overjet requiring
extraction treatment and a longer treatment duration.4,5
In a study on a Brazilian population, Marques et al.6
used periapical radiography to determine that root resorption before treatment was associated with a high risk of severe root resorption during orthodontic treatment.
To date, most data on normal R/C ratios have been obtained using periapical or panoramic radiographs. Hölttä
et al.7 evaluated a Finnish population by using panoramic
radiographs and reported that the mean R/C ratios for the maxillary central incisors in men and women were 1.86 ± 0.17 and 1.78 ± 0.16, respectively, according to
Lind’s method.8,9 By using the same method, Yun et al.9
evaluated 99 Korean young adults and reported that the mean R/C ratios for the maxillary and mandibular central incisors were 1.49 ± 0.20 and 1.53 ± 0.24, respectively. Panoramic radiographs can be easily acquired in dental clinics without significant errors, and exhibit an acceptable reproducibility under low
radiation exposure.7,9 However, some previous studies
have shown that measurements of the maxillary and mandibular central incisors on panoramic radiographs have the lowest reliability among assessments of
all tooth types.10,11 In addition, identification of the
cementoenamel junction (CEJ) on periapical radiographs acquired using the paralleling technique can be affected by angular differences between the concerned tooth and
the film.12
Although cone-beam computed tomography (CBCT) requires high radiation dosages and is relatively expen-sive, it has gained widespread acceptance in the field of dentistry, because distortion-free slice images of single roots are excellent for measuring the crown and
root lengths of anterior teeth.10,13 Kim et al.14 reported
that, although CBCT-based measurements showed a wider range of agreement limits for root lengths than for crown lengths, they could be used as references for evaluating incisor, canine, and premolar root lengths in 62 Korean patients with malocclusion. However, because of the small sample size of that study, the findings cannot be generalized to larger populations.
The aim of this retrospective, cross-sectional study was to establish reference data for normal crown and
root lengths and the R/C ratios for the maxillary and mandibular incisors with complete root formation in a Korean population by using CBCT. The specific aim was to detect significant differences in CBCT measurements between demographic factors (sex and age) as well as sagittal and vertical skeletal or occlusal relationships.
MATERIALS AND METHODS
SubjectsFrom 1999 to 2014, 1,217 patients visited a private clinic in Seongnam, Korea, to undergo a variety of dental treatments. In this retrospective, cross-sectional study, we evaluated existing CBCT data for 672 of these 1,217 adults, who met the following inclusion criteria: age ≥ 18 years; little residual skeletal growth and complete root formation in most teeth; no severe craniofacial deformities such as cleft lip and/or palate; no loss of one or more permanent anterior teeth; no history of orthodontic treatment and/or orthognathic surgery; no systemic diseases such as hypothyroidism, Down syndrome, and Turner syndrome; no periodontal diseases, as indicated by a community periodontal index score of 3 or more; no restorations that altered the incisal edges; and no history of trauma, severe attrition, and/or occlusal adjustment. The sex and age of each patient was recorded, and the sagittal relationship was classified as skeletal Class I, Class II, and Class III according to the ANB (point A, nasion, point B) angle:
skeletal Class I, 0o–4o; skeletal Class II, > 4o; and skeletal
Class III, < 0o. The overjet was classified as follows:
normal, 0–4 mm; excessive, > 4 mm; and cross bite, < 0 mm. The overbite was classified as follows: normal, 0–4 mm; deep bite, > 4 mm; and open bite, < 0 mm. The study protocol conformed to the guidelines of the Declaration of Helsinki and was approved by the Institutional Review Board of the Ministry of Health and Welfare, Korea (IRB No. P01-201601-21-001). Informed consent was obtained from all individual participants included in this study.
Methods
CBCT images were acquired with the subjects in a standard upright position (scanning time, 95 s; field of view, 10 × 8.5 cm; tube voltage, 50–99 kVP; tube current, 4–16.0 mA; and voxel size, 0.2–0.3, based on the patient’s size) on the scanning device (PaX-i3D Smart; Vatech Co., Hwaseong, Korea). The acquired data were exported in the Digital Imaging and Communications in Medicine (DICOM) multifile format into a three-dimen-sional image analysis software (Ez3D2009; Ewoosoft, Co., Ltd., Hwaseong, Korea).
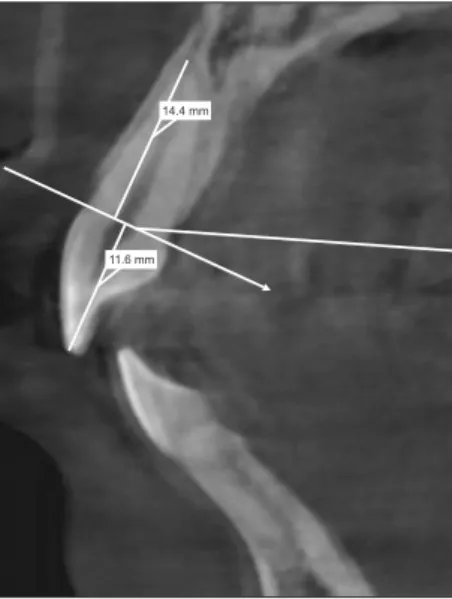
One trained examiner measured all crown and root lengths along the axes of the eight maxillary and
mandi bular incisors by using a reference line from the labial and palatal CEJ to the incisal tip and root apex on sagittal views (Figure 1). Reproducibility was determined by comparing measurements obtained through original examinations with those obtained through repeated examinations. Measurements for 110 randomly selected patients were repeated by the same examiner after 2 weeks. The method error was calculated using Dahlberg’s formula. Errors ranged from 0.09 to 0.13 mm for linear measurements; these were minor and not statistically significant.
Statistical analysis
All statistical analyses were performed using SPSS version 21.0 (IBM Korea Inc., Seoul, Korea). The Kolmo-gorov-Smirnov test was used to verify the normality of data distribution. Since the data were not normally distributed, nonparametric tests were used. Descriptive statistics, including means and standard deviations, were used to describe each variable analyzed in the study. For comparison of CBCT measurements between the right and left sides, intraclass correlation coefficients (ICCs) were determined and assessed.
The Mann-Whitney U-test was applied to detect statistically significant differences in the CBCT measure-ments according to sex, whereas the Kruskal-Wallis test was applied to detect significant differences in the measurements according to skeletal classification,
overjet, or overbite. Spearman rank correlation coeffi-cients were used to explore the correlations between the CBCT measurements for the maxillary and mandibular incisors and age. With regard to the strength of the
correlations, r > 0.40 was considered to represent
a moderate-to-strong correlation and r < 0.40 was considered to represent a weak correlation. A p-value of < 0.05 was considered statistically significant.
RESULTS
Complete data were recorded for 672 adults with a mean age of 27.2 ± 7.7 years. The sex distribution was not even (531 women, 79.0%; Table 1). The number of patients with skeletal Class I, Class II, and Class III malocclusions were 235 (35.0%), 393 (58.5%), and 44 (6.5%), respectively. The number of patients who exhibited an excessive overjet, a deep bite, and an open Table 1. Sample characteristics (n = 672)
Variable Data Sex Men 141 (21.0) Women 531 (79.0) Age (yr) 27.2 ± 7.7 Skeletal Classification Class I 235 (35.0) Class II 393 (58.5) Class III 44 (6.5) Overjet Normal overjet (0–4 mm) 399 (59.4) Excessive overjet (> 4 mm) 254 (37.8) Cross bite (< 0 mm) 19 (2.8) Overbite Normal overbite (0–4 mm) 511 (76.0) Deep bite (> 4 mm) 125 (18.6) Open bite (< 0 mm) 36 (5.4)
Values are presented as number (%) or mean ± standard deviation.
Table 2. Intraclass correlation coefficients for the same
type of teeth on the left and right sides (n = 672)
Variable Crown length lengthRoot
Maxillary right and left central 0.86 0.92
Maxillary right and left lateral 0.85 0.88
Mandibular right and left central 0.85 0.86
Mandibular right and left lateral 0.87 0.85
14.4 mm
11.6 mm
Figure 1. Measurements of crown and root lengths
on sagittal cone-beam computed tomography images acquired for a Korean population. Measurements for the eight maxillary and mandibular incisors are made along the tooth axes by using a reference line from the labial and palatal cementoenamel junction to the incisal tip and root apex.
bite were 254 (37.8%), 125 (18.6%), and 36 (5.4%), respectively. The ICC values were greater than 0.85 (range, 0.85 to 0.92) for all tooth pairs in the maxilla and mandible, indicating that the same type of teeth in each half-arch were symmetrical (Table 2).
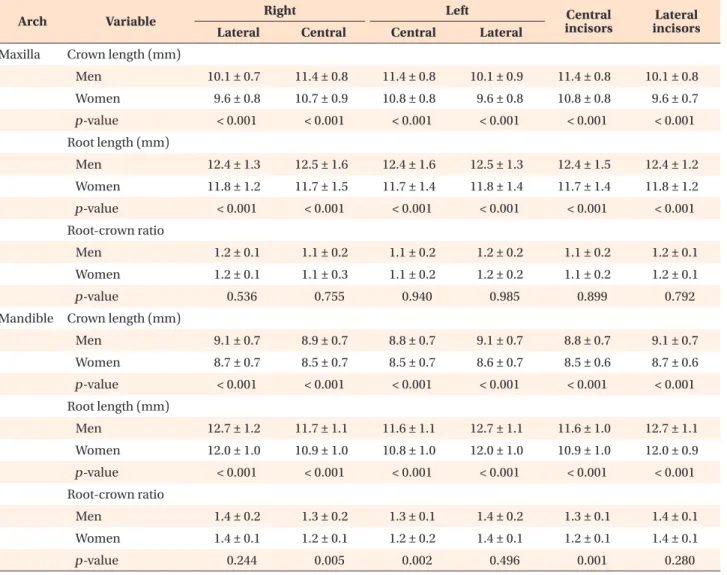
The mean crown and root lengths for the maxillary central incisors were 10.9 ± 0.8 mm (range, 8.6 to 13.8 mm) and 11.9 ± 1.5 mm (range, 6.7 to 16.5 mm), respectively (Table 3). The R/C ratios were lower for the maxillary central incisors (1.1 ± 0.2) than for the maxillary lateral incisors (1.2 ± 0.1). The mean crown and root lengths for the mandibular central incisors were 8.6 ± 0.7 mm (range, 6.3 to 10.5 mm) and 11.0 ± 1.0 mm (range, 6.5 to 15.3 mm), respectively. The R/C ratios were lower for the mandibular central incisors (1.3 ± 0.1) than for the mandibular lateral incisors (1.4 ± 0.1). When the mean crown and root lengths for the two tooth groups in both arches were compared between men and women, both measurements were higher for men than for women (p < 0.001; Table 4). The R/C ratios for the maxillary lateral incisors showed no significant difference between the sexes, whereas those for the mandibular central incisors were greater in men than in women (p = 0.001).
The mean root lengths for the two tooth groups in both arches were greater in patients with skeletal Class II malocclusion than in those with skeletal Class I or Class III malocclusion (Table 5). Moreover, the R/C ratios for the mandibular incisors were significantly greater in patients with skeletal Class II malocclusion than in patients with skeletal Class I or Class III malocclusion (p < 0.05). Similar to the results shown in Table 4, the mean root lengths and R/C ratios for the mandibular incisors were significantly greater in patients with an excessive overjet than in those with a normal overjet or a cross bite (Table 6).
The mean crown lengths for the maxillary incisors and the mean root lengths for the mandibular incisors were greater in patients with a deep bite than in those with a normal bite or an open bite (Table 7). In addition, the mean crown lengths for the mandibular incisors were greater in patients with an open bite than in those with a normal bite or a deep bite. Finally, the R/C ratios for the mandibular incisors were lower in patients with an open bite than in those with a normal bite or a deep bite. The crown lengths for the maxillary central incisors decreased with increasing age (r = −0.143, p < 0.001; Table 8). However, the R/C ratios for the maxillary incisors showed no correlation with age. For the mandibular incisors, the crown length decreased (central incisors: r = −0.162, p < 0.001; lateral incisors: r = −0.112, p < 0.01) and the R/C ratios increased (r = 0.118–0.136, p < 0.01) with increasing age, even though the correlations were very weak.
Table 3.
Cr
own length, r
oot length, and the r
oot–cr
own r
atio for each tooth individually and accor
ding to tooth type (n = 672)
Ar ch Vari able R ig ht Le ft Cen tr al in cis ors Lat er al in cis ors Lat er al Cen tr al Cen tr al Lat er al M ax ill a Cr ow n len gth (mm) 9.7 ± 0.8 (7.1–12.8) 10.8 ± 0.9 (8.6–14.2) 10.9 ± 0.8 (8.5–13.6) 9.7 ± 0.8 (7.0–13.3) 10.9 ± 0.8 (8.6–13.8) 9.7 ± 0.8 (7.2–13.1) R oot len gth (mm) 11.9 ± 1.3 (7.6–16.7) 11.9 ± 1.6 (6.5–16.7) 11.9 ± 1.5 (6.1–16.2) 11.9 ± 1.4 (6.2–16.3) 11.9 ± 1.5 (6.7–16.5) 11.9 ± 1.2 (6.9–16.4) R oot -cr ow n r atio 1.2 ± 0.1 (0.7–1.7) 1.1 ± 0.3 (0.6–1.7) 1.1 ± 0.2 (0.5–1.6) 1.2 ± 0.2 (0.6–1.9) 1.1 ± 0.2 (0.6–1.7) 1.2 ± 0.1 (0.7–1.8) M andible Cr ow n len gth (mm) 8.8 ± 0.7 (6.2–10.8) 8.6 ± 0.7 (6.4–10.8) 8.5 ± 0.7 (6.0–11.0) 8.7 ± 0.7 (6.4–11.1) 8.6 ± 0.7 (6.3–10.5) 8.8 ± 0.7 (6.6–10.8) R oot len gth (mm) 12.2 ± 1.1 (8.3–15.8) 11.1 ± 1.1 (6.5–16.4) 11.0 ± 1.1 (6.4–14.7) 12.1 ± 1.1 (7.5–15.6) 11.0 ± 1.0 (6.5–15.3) 12.1 ± 1.0 (7.9–15.6) R oot -cr ow n r atio 1.4 ± 0.1 (0.9–1.9) 1.3 ± 0.1 (0.7–2.0) 1.3 ± 0.2 (0.7–1.8) 1.4 ± 0.1 (0.8–2.1) 1.3 ± 0.1 (0.7–1.9) 1.4 ± 0.1 (0.9–1.9) V alues ar e pr es en te d as me an ± s tand ar d de vi ation (r an ge).
DISCUSSION
Baseline radiographs can be used as a reference and compared with radiographs obtained after treatment to predict the prognosis of the target tooth in patients with orthodontic disorders. Previous studies have shown that patients with existing root resorption at the start of treatment exhibit a greater possibility of severe root resorption during treatment than do patients without
existing root resorption.6,15,16 However, previous studies
have shown that the use of radiography for tooth
measurements has several limitations.10-12 Therefore, this
study aimed to use CBCT to establish reference data for normal crown and root lengths and the R/C ratios for the maxillary and mandibular incisors with complete root formation in a Korean population. The specific aim of the study was to evaluate the correlations of
the CBCT measurements with demographic factors (sex and age) and sagittal and vertical skeletal or occlusal relationships.
The R/C ratio may be classified as either anatomical or clinical. While the clinical R/C ratio is obtained using a reference line drawn from the labial to the palatal crestal bone level, the anatomical R/C ratio is obtained
using the CEJ as a reference point.9 Most previous
studies using panoramic radiographs have determined the clinical R/C ratio, because the CEJ could not be
precisely determined on these radiographs.9,17 Because
precise identification of the CEJ is essential for studies on root resorption during orthodontic treatment, previous studies using periapical radiographs have used this landmark as a reference to measure the amount of
external apical root resorption.18-20 However, Brezniak
et al.12 reported that angular differences between the
Table 4. Crown length, root length, and the root–crown ratio according to sex (n = 672)
Arch Variable Right Left incisorsCentral incisorsLateral
Lateral Central Central Lateral
Maxilla Crown length (mm)
Men 10.1 ± 0.7 11.4 ± 0.8 11.4 ± 0.8 10.1 ± 0.9 11.4 ± 0.8 10.1 ± 0.8 Women 9.6 ± 0.8 10.7 ± 0.9 10.8 ± 0.8 9.6 ± 0.8 10.8 ± 0.8 9.6 ± 0.7 p-value < 0.001 < 0.001 < 0.001 < 0.001 < 0.001 < 0.001 Root length (mm) Men 12.4 ± 1.3 12.5 ± 1.6 12.4 ± 1.6 12.5 ± 1.3 12.4 ± 1.5 12.4 ± 1.2 Women 11.8 ± 1.2 11.7 ± 1.5 11.7 ± 1.4 11.8 ± 1.4 11.7 ± 1.4 11.8 ± 1.2 p-value < 0.001 < 0.001 < 0.001 < 0.001 < 0.001 < 0.001 Root-crown ratio Men 1.2 ± 0.1 1.1 ± 0.2 1.1 ± 0.2 1.2 ± 0.2 1.1 ± 0.2 1.2 ± 0.1 Women 1.2 ± 0.1 1.1 ± 0.3 1.1 ± 0.2 1.2 ± 0.2 1.1 ± 0.2 1.2 ± 0.1 p-value 0.536 0.755 0.940 0.985 0.899 0.792
Mandible Crown length (mm)
Men 9.1 ± 0.7 8.9 ± 0.7 8.8 ± 0.7 9.1 ± 0.7 8.8 ± 0.7 9.1 ± 0.7 Women 8.7 ± 0.7 8.5 ± 0.7 8.5 ± 0.7 8.6 ± 0.7 8.5 ± 0.6 8.7 ± 0.6 p-value < 0.001 < 0.001 < 0.001 < 0.001 < 0.001 < 0.001 Root length (mm) Men 12.7 ± 1.2 11.7 ± 1.1 11.6 ± 1.1 12.7 ± 1.1 11.6 ± 1.0 12.7 ± 1.1 Women 12.0 ± 1.0 10.9 ± 1.0 10.8 ± 1.0 12.0 ± 1.0 10.9 ± 1.0 12.0 ± 0.9 p-value < 0.001 < 0.001 < 0.001 < 0.001 < 0.001 < 0.001 Root-crown ratio Men 1.4 ± 0.2 1.3 ± 0.2 1.3 ± 0.1 1.4 ± 0.2 1.3 ± 0.1 1.4 ± 0.1 Women 1.4 ± 0.1 1.2 ± 0.1 1.2 ± 0.2 1.4 ± 0.1 1.2 ± 0.1 1.4 ± 0.1 p-value 0.244 0.005 0.002 0.496 0.001 0.280
Values are presented as mean ± standard deviation. p-values were calculated using the Mann-Whitney U-test.
tooth and the film have statistically significant effects on the identification of the labial and palatal CEJ points on periapical radiographs. Therefore, in the present study, the anatomical R/C ratios for the incisors were measured using CBCT, which provides distortion-free slice images of single roots that facilitate the investigation of anterior
tooth crown and root lengths and the R/C ratios.10
In the present study, the R/C ratios for the maxillary and mandibular incisors ranged from 1.1 to 1.4 (Table 2). The lowest anatomical R/C ratios were determined for the
maxillary central incisors (1.1 ± 0.2). Hölttä et al.,7 who
used panoramic radiographs in their study of a Finnish population, reported that the R/C ratios for the maxillary central incisors were 1.86 ± 0.17 in men and 1.78 ± 0.16
in women. Yun et al.9 also used panoramic graphs in
their study of a Korean population and found that the R/C ratios for the maxillary central incisors were 1.49 ± 0.20 in both men and women. In the field of restorative dentistry, 1.5 is considered a clinically acceptable R/ C ratio for an abutment for a fixed prosthesis, whereas Table 5. Crown length, root length, and the root–crown ratio according to skeletal classification (n = 672)
Arch Variable Right Left incisorsCentral incisorsLateral
Lateral Central Central Lateral
Maxilla Crown length (mm)
Skeletal Class I 9.6 ± 0.8 10.9 ± 0.9 11.0 ± 0.8 9.6 ± 0.9 10.9 ± 0.8 9.6 ± 0.8
Skeletal Class II 9.7 ± 0.8 10.8 ± 0.8 10.9 ± 0.8 9.7 ± 0.8 10.9 ± 0.8 9.7 ± 0.7
Skeletal Class III 9.7 ± 0.8 10.7 ± 1.0 10.8 ± 1.0 9.6 ± 0.9 10.7 ± 1.2 9.7 ± 0.8
p-value 0.403 0.794 0.675 0.487 0.656 0.289
Root length (mm)
Skeletal Class I 11.7 ± 1.3 11.7 ± 1.6 11.7 ± 1.6 11.7 ± 1.4 11.7 ± 1.5 11.7 ± 1.3
Skeletal Class II 12.0 ± 1.2 12.1 ± 1.6 12.1 ± 1.4 12.0 ± 1.4 12.1 ± 1.4 12.0 ± 1.2
Skeletal Class III 11.6 ± 1.4 11.4 ± 1.7 11.3 ± 1.6 11.9 ± 1.3 11.4 ± 1.6 11.7 ± 1.3
p-value 0.002 0.001 0.003 0.008 0.001 0.002
Root-crown ratio
Skeletal Class I 1.2 ± 0.1 1.1 ± 0.2 1.1 ± 0.2 1.2 ± 0.2 1.1 ± 0.1 1.2 ± 0.1
Skeletal Class II 1.2 ± 0.1 1.1 ± 0.2 1.1 ± 0.1 1.2 ± 0.2 1.1 ± 0.1 1.2 ± 0.1
Skeletal Class III 1.2 ± 0.1 1.2 ± 0.2 1.1 ± 0.2 1.2 ± 0.2 1.1 ± 0.2 1.2 ± 0.1
p-value 0.047 0.003 0.005 0.079 0.001 0.038
Mandible Crown length (mm)
Skeletal Class I 8.8 ± 0.7 8.6 ± 0.7 8.5 ± 0.7 8.7 ± 0.7 8.7 ± 0.7 8.7 ± 0.7
Skeletal Class II 8.8 ± 0.7 8.6 ± 0.7 8.5 ± 0.7 8.7 ± 0.7 8.5 ± 0.6 8.7 ± 0.7
Skeletal Class III 8.9 ± 0.5 8.6 ± 0.8 8.7 ± 0.7 9.0 ± 0.8 8.6 ± 0.7 9.0 ± 0.6
p-value 0.697 0.644 0.970 0.941 0.754 0.849
Root length (mm)
Skeletal Class I 12.0 ± 1.0 11.0 ± 1.1 10.9 ± 1.2 12.1 ± 1.1 10.9 ± 1.1 12.0 ± 1.0
Skeletal Class II 12.3 ± 1.1 11.2 ± 1.1 11.1 ± 1.0 12.2 ± 1.1 11.1 ± 1.0 12.2 ± 1.0
Skeletal Class III 12.1 ± 1.2 10.7 ± 1.2 10.7 ± 1.1 12.0 ± 0.9 10.7 ± 1.1 12.0 ± 1.0
p-value 0.003 0.025 0.007 0.085 0.014 0.015
Root-crown ratio
Skeletal Class I 1.4 ± 0.1 1.3 ± 0.1 1.3 ± 0.2 1.4 ± 0.2 1.3 ± 0.1 1.4 ± 0.1
Skeletal Class II 1.4 ± 0.1 1.3 ± 0.1 1.3 ± 0.1 1.4 ± 0.1 1.3 ± 0.1 1.4 ± 0.1
Skeletal Class III 1.4 ± 0.1 1.2 ± 0.2 1.2 ± 0.2 1.3 ± 0.1 1.2 ± 0.1 1.3 ± 0.1
p-value 0.012 0.056 0.051 0.082 0.036 0.023
Values are presented as mean ± standard deviation. p-values were calculated using the Kruskal-Wallis test.
1:1 is the minimum ratio for abutments under normal
circumstances.8 However, the R/C ratios for all the
maxillary central incisors in the present study and the
study by Yun et al.9 were lower than 1.5. These results
indicate that the roots are relatively longer in Caucasian teeth than in Korean teeth. Therefore, ethnicity-related differences in measurements should be considered when establishing appropriate orthodontic reference values. Table 3 shows that crown and root lengths were greater in men than in women. In the present study,
root lengths for the maxillary central incisors were 12.4 ± 1.5 mm and 11.7 ± 1.4 mm in men and women,
respectively. Kim et al.14 also reported values of 12.3 ±
1.6 mm and 11.8 ± 1.5 mm for the maxillary central incisors in men and women, respectively, by using CBCT. These results are consistent with those of most previous studies, which reported that the maxillary and mandibular incisors in men are approximately 0.5 to 1.0 mm longer than those in women, even though the R/C ratios between men and women showed no significant Table 6. Crown length, root length, and the root–crown ratio according to overjet (OJ) (n = 672)
Arch Variable Right Left incisorsCentral incisorsLateral
Lateral Central Central Lateral
Maxilla Crown length (mm)
Normal OJ 9.6 ± 0.8 10.8 ± 1.0 10.9 ± 0.8 9.6 ± 0.8 10.8 ± 0.8 9.6 ± 0.8 Excessive OJ 9.8 ± 0.8 10.9 ± 0.8 11.0 ± 0.8 9.7 ± 0.8 11.0 ± 0.8 9.7 ± 0.8 Cross bite 9.7 ± 0.6 10.6 ± 1.1 10.7 ± 1.1 9.5 ± 1.0 10.7 ± 1.1 9.6 ± 0.8 p-value 0.309 0.203 0.512 0.855 0.345 0.571 Root length (mm) Normal OJ 11.9 ± 1.3 11.8 ± 1.6 11.7 ± 1.5 11.8 ± 1.4 11.8 ± 1.5 11.8 ± 1.3 Excessive OJ 12.0 ± 1.3 12.1 ± 1.5 12.1 ± 1.4 12.1 ± 1.3 12.1 ± 1.4 12.0 ± 1.2 Cross bite 11.8 ± 1.2 11.6 ± 1.9 11.4 ± 1.5 11.9 ± 1.1 11.5 ± 1.6 11.8 ± 1.1 p-value 0.260 0.038 0.010 0.118 0.013 0.137 Root-crown ratio Normal OJ 1.2 ± 0.1 1.1 ± 0.4 1.1 ± 0.2 1.2 ± 0.2 1.1 ± 0.2 1.2 ± 0.1 Excessive OJ 1.2 ± 0.1 1.1 ± 0.1 1.1 ± 0.1 1.2 ± 0.1 1.1 ± 0.1 1.2 ± 0.1 Cross bite 1.2 ± 0.1 1.1 ± 0.2 1.1 ± 0.2 1.3 ± 0.2 1.1 ± 0.2 1.2 ± 0.1 p-value 0.818 0.446 0.071 0.231 0.180 0.547
Mandible Crown length (mm)
Normal OJ 8.8 ± 0.7 8.6 ± 0.7 8.5 ± 0.7 8.8 ± 0.7 8.5 ± 0.7 8.8 ± 0.7 Excessive OJ 8.7 ± 0.7 8.6 ± 0.7 8.5 ± 0.7 8.7 ± 0.7 8.6 ± 0.7 8.7 ± 0.7 Cross bite 9.0 ± 0.6 8.6 ± 0.8 8.8 ± 0.7 8.9 ± 1.0 8.7 ± 0.7 9.0 ± 0.7 p-value 0.088 0.894 0.257 0.274 0.652 0.145 Root length (mm) Normal OJ 12.1 ± 1.1 11.0 ± 1.1 10.9 ± 1.1 12.1 ± 1.1 10.9 ± 1.0 12.1 ± 1.0 Excessive OJ 12.3 ± 1.1 11.2 ± 1.1 11.2 ± 1.1 12.2 ± 1.1 11.2 ± 1.0 12.3 ± 1.0 Cross bite 12.0 ± 1.1 10.7 ± 1.1 10.9 ± 1.2 12.0 ± 1.0 10.8 ± 1.1 12.0 ± 1.0 p-value 0.020 0.014 0.006 0.223 0.006 0.053 Root-crown ratio Normal OJ 1.4 ± 0.1 1.3 ± 0.1 1.3 ± 0.2 1.4 ± 0.2 1.3 ± 0.1 1.4 ± 0.1 Excessive OJ 1.4 ± 0.1 1.3 ± 0.1 1.3 ± 0.1 1.4 ± 0.1 1.3 ± 0.1 1.4 ± 0.1 Cross bite 1.3 ± 0.1 1.3 ± 0.1 1.2 ± 0.2 1.4 ± 0.2 1.2 ± 0.1 1.3 ± 0.1 p-value < 0.001 0.053 0.005 0.017 0.006 0.001
Values are presented as mean ± standard deviation. p-values were calculated using the Kruskal–Wallis test.
differences.14,21
In the present study, patients with skeletal Class II malocclusion or an excessive overjet showed greater incisor root lengths in both arches and greater R/C ratios for the mandibular incisors than did patients with other sagittal relationships. This finding is clinically interesting because several studies have reported that premolar extraction for Class II camouflage treatment and an excessive overjet may be considered risk factors for external apical root resorption after orthodontic
treatment.4,22-24 Sameshima and Sinclair4,5 reported that
extraction treatment for the correction of an excessive overjet and a skeletal Class II malocclusion can cause severe root resorption in the anterior teeth of adult patients because of a longer treatment duration.
In addition, the present study showed that patients with an open bite exhibited significantly lower R/C ratios for the mandibular incisors than did patients with a
normal bite or a deep bite. Uehara et al.25 reported that
patients with an open bite exhibit an unfavorable R/C Table 7. Crown length, root length, and the root–crown ratio according to overbite (OB) (n = 672)
Arch Variable Right Left incisorsCentral incisorsLateral
Lateral Central Central Lateral
Maxilla Crown length (mm)
Normal OB 9.6 ± 0.8 10.8 ± 0.8 10.9 ± 0.8 9.6 ± 0.8 10.8 ± 0.8 9.6 ± 0.8 Deep bite 9.9 ± 0.8 11.1 ± 1.2 11.2 ± 0.8 9.8 ± 0.9 11.1 ± 0.9 9.8 ± 0.8 Open bite 9.7 ± 0.7 10.8 ± 0.9 10.8 ± 0.9 9.8 ± 0.9 10.8 ± 0.9 9.7 ± 0.7 p-value 0.006 0.001 < 0.001 0.362 < 0.001 0.054 Root length (mm) Normal OB 11.9 ± 1.2 11.8 ± 1.6 11.8 ± 1.5 11.9 ± 1.4 11.8 ± 1.5 11.9 ± 1.2 Deep bite 12.2 ± 1.3 12.1 ± 1.6 12.0 ± 1.5 12.1 ± 1.4 12.1 ± 1.5 12.1 ± 1.3 Open bite 11.6 ± 1.3 11.8 ± 1.6 11.9 ± 1.4 11.5 ± 1.3 11.8 ± 1.4 11.6 ± 1.2 p-value 0.002 0.110 0.185 0.033 0.106 0.004 Root-crown ratio Normal OB 1.2 ± 0.1 1.1 ± 0.2 1.1 ± 0.2 1.2 ± 0.2 1.1 ± 0.1 1.2 ± 0.1 Deep bite 1.2 ± 0.1 1.1 ± 0.6 1.1 ± 0.1 1.2 ± 0.2 1.1 ± 0.2 1.2 ± 0.1 Open bite 1.2 ± 0.1 1.1 ± 0.2 1.1 ± 0.1 1.2 ± 0.1 1.1 ± 0.3 1.2 ± 0.1 p-value 0.289 0.939 0.443 0.057 0.915 0.071
Mandible Crown length (mm)
Normal OB 8.8 ± 0.7 8.6 ± 0.7 8.5 ± 0.7 8.7 ± 0.7 8.5 ± 0.7 8.7 ± 0.7 Deep bite 8.8 ± 0.6 8.6 ± 0.7 8.6 ± 0.7 8.8 ± 0.7 8.6 ± 0.7 8.8 ± 0.6 Open bite 9.0 ± 0.7 8.8 ± 0.7 8.9 ± 0.7 9.0 ± 0.7 8.9 ± 0.7 9.0 ± 0.6 p-value 0.107 0.115 0.006 0.047 0.019 0.043 Root length (mm) Normal OB 12.1 ± 1.1 11.0 ± 1.1 10.9 ± 1.0 12.1 ± 1.1 11.0 ± 1.0 12.1 ± 1.0 Deep bite 12.5 ± 1.2 11.3 ± 1.2 11.3 ± 1.2 12.4 ± 1.1 11.3 ± 1.1 12.4 ± 1.1 Open bite 11.9 ± 1.1 11.0 ± 1.0 10.9 ± 1.0 11.8 ± 1.0 10.9 ± 1.0 11.9 ± 1.0 p-value 0.001 0.002 0.001 0.001 < 0.001 < 0.001 Root-crown ratio Normal OB 1.4 ± 0.1 1.3 ± 0.1 1.3 ± 0.2 1.4 ± 0.1 1.3 ± 0.1 1.4 ± 0.1 Deep bite 1.4 ± 0.2 1.3 ± 0.2 1.3 ± 0.2 1.4 ± 0.2 1.3 ± 0.1 1.4 ± 0.1 Open bite 1.3 ± 0.1 1.2 ± 0.1 1.2 ± 0.1 1.3 ± 0.1 1.2 ± 0.1 1.3 ± 0.1 p-value 0.002 0.003 0.003 < 0.001 0.001 < 0.001
Values are presented as mean ± standard deviation. p-values were calculated using the Kruskal-Wallis test.
ratio and short roots, which may be associated with the loss of occlusal contacts. Occlusal hypofunction due to an open bite may decrease the possibility of incisal edge attrition and lead to atrophic changes in the periodontal ligament and root resorption. In contrast, patients with a deep bite exhibited significantly higher R/C ratios for the mandibular incisors than did patients with a normal bite or an open bite. Several previous studies agree that a deep bite is not associated with severe root
resorption.6,26 However, the intrusion force required for
deep bite correction and the amount of correction can
be correlated with root resorption during treatment.27,28
The crown lengths for the maxillary and mandibular central incisors decreased with an increase in the age of the patients in the present study; however, these correlations were very weak (Table 4). Because patients with severe attrition and those treated with occlusal adjustments were excluded from our study, this correlation could be attributed to physiological incisal attrition associated with aging. For the mandibular incisors in particular, the crown length decreased and the R/C ratios significantly increased with increasing age. This study has several limitations that should be considered during data interpretation. First, the sex ratio was skewed; there were more women (79.0%) than men (21.0%). Although there were no significant differences in the R/C ratios for most teeth between men and
women, the skewed sex distribution may have resulted in relatively lower R/C ratios in the present study than
in previous studies on Korean populations.9,14 Second,
although our CBCT data were validated by previous studies, the values could have been significantly lower than those obtained by direct measurements of extracted teeth, depending on the Hounsfield unit (HU)
range.14 Kim et al.14 reported that CBCT measurements
of root lengths may have been significantly shorter than direct measurements under a higher HU range. Lund et
al.10 reported that the in vitro mean difference between
anatomical and CBCT measurements was 0.05 ± 0.75 mm for the root length. Because the voxel size used in the present study (0.2–0.3 mm) was greater than that used in the study by Lund et al.9 (0.125 mm), the difference between anatomical and CBCT measurements may have been greater than 0.05 mm in the present study. Future studies using CBCT-based measurements with improved accuracy and precision are necessary to clarify our findings.
CONCLUSION
Although the assessment of R/C ratios using CBCT data has inherent limitations with regard to accuracy, we obtained the mean R/C ratios for the maxillary and mandibular incisors in a Korean population. The mean Table 8. Correlations between crown length, root length, the root–crown ratio, and age (n = 672)
Variable Dimension Right Left incisorsCentral incisorsLateral
Lateral Central Central Lateral
Age Maxilla Crown length (mm)
r −0.092 −0.146 −0.131 −0.059 −0.143 −0.078 p-value 0.018 < 0.001 0.001 0.125 < 0.001 0.043 Root length (mm) r −0.070 −0.043 −0.038 −0.031 −0.045 −0.052 p-value 0.068 0.269 0.320 0.416 0.245 0.177 Root-crown ratio r 0.011 0.039 0.033 0.013 0.033 0.014 p-value 0.774 0.310 0.392 0.740 0.396 0.727
Mandible Crown length (mm)
r −0.092 −0.150 −0.157 −0.113 −0.162 −0.112 p-value 0.017 < 0.001 < 0.001 0.003 < 0.001 0.004 Root length (mm) r 0.000 −0.012 0.001 0.026 −0.007 0.013 p-value 0.995 0.749 0.978 0.504 0.847 0.742 Root-crown ratio r 0.076 0.111 0.128 0.137 0.136 0.118 p-value 0.049 0.004 0.001 < 0.001 0.001 0.002
R/C ratios varied from 1.1 to 1.2 for the maxillary incisors and from 1.3 to 1.4 for the mandibular incisors. R/C ratios for the mandibular central incisors were greater in men than in women. Root lengths and R/ C ratios for the mandibular incisors were significantly greater in patients with skeletal Class II malocclusion or an excessive overjet than in patients with other sagittal relationships. However, root lengths and R/C ratios were lower in patients with an open bite than in patients with a normal overbite. Finally, crown lengths for the maxillary central incisors and all mandibular incisors decreased with increasing age, whereas R/C ratios for the mandibular incisors increased with increasing age. We believe that the data obtained in the present study can serve as a reference for maxillary and mandibular incisor crown and root lengths and R/C ratios in the Korean population.
REFERENCES
1. Janson GR, De Luca Canto G, Martins DR, Henriques JF, De Freitas MR. A radiographic comparison of apical root resorption after orthodontic treatment with 3 different fixed appliance techniques. Am J Orthod Dentofacial Orthop 2000;118:262-73. 2. Sameshima GT, Asgarifar KO. Assessment of root
resorption and root shape: periapical vs panoramic films. Angle Orthod 2001;71:185-9.
3. Hikida T, Yamaguchi M, Shimizu M, Kikuta J, Yoshino T, Kasai K. Comparisons of orthodontic root resorption under heavy and jiggling reciprocating forces during experimental tooth movement in a rat model. Korean J Orthod 2016;46:228-41.
4. Sameshima GT, Sinclair PM. Predicting and preventing root resorption: Part I. Diagnostic factors. Am J Orthod Dentofacial Orthop 2001;119:505-10. 5. Sameshima GT, Sinclair PM. Predicting and
preventing root resorption: Part II. Treatment factors. Am J Orthod Dentofacial Orthop 2001;119:511-5. 6. Marques LS, Ramos-Jorge ML, Rey AC, Armond MC,
Ruellas AC. Severe root resorption in orthodontic patients treated with the edgewise method: prevalence and predictive factors. Am J Orthod Dentofacial Orthop 2010;137:384-8.
7. Hölttä P, Nyström M, Evälahti M, Alaluusua S. Root-crown ratios of permanent teeth in a healthy Finnish population assessed from panoramic radiographs. Eur J Orthod 2004;26:491-7.
8. Lind V. Short root anomaly. Scand J Dent Res 1972;80:85-93.
9. Yun HJ, Jeong JS, Pang NS, Kwon IK, Jung BY. Radiographic assessment of clinical root-crown ratios of permanent teeth in a healthy Korean population. J Adv Prosthodont 2014;6:171-6.
10. Lund H, Gröndahl K, Gröndahl HG. Cone beam computed tomography for assessment of root length and marginal bone level during orthodontic treatment. Angle Orthod 2010;80:466-73.
11. Leach HA, Ireland AJ, Whaites EJ. Radiographic diagnosis of root resorption in relation to orthodontics. Br Dent J 2001;190:16-22.
12. Brezniak N, Goren S, Zoizner R, Shochat T, Dinbar A, Wasserstein A, et al. The accuracy of the cementoenamel junction identification on periapical films. Angle Orthod 2004;74:496-500.
13. Tian Y, Liu F, Sun H, Lv P, Cao Y, Yu M, et al. Alveolar bone thickness around maxillary central incisors of different inclination assessed with cone-beam computed tomography. Korean J Orthod 2015;45:245-52.
14. Kim SY, Lim SH, Gang SN, Kim HJ. Crown and root lengths of incisors, canines, and premolars measured by cone-beam computed tomography in patients with malocclusions. Korean J Orthod 2013;43:271-8.
15. Stenvik A, Mjör IA. Pulp and dentine reactions to experimental tooth intrusion. A histologic study of the initial changes. Am J Orthod 1970;57:370-85. 16. Linge BO, Linge L. Apical root resorption in upper
anterior teeth. Eur J Orthod 1983;5:173-83.
17. Penny RE, Kraal JH. Crown-to-root ratio: its significance in restorative dentistry. J Prosthet Dent 1979;42:34-8.
18. Mirabella AD, Artun J. Prevalence and severity of apical root resorption of maxillary anterior teeth in adult orthodontic patients. Eur J Orthod 1995;17:93-9.
19. Baumrind S, Korn EL, Boyd RL. Apical root resorption in orthodontically treated adults. Am J Orthod Dentofacial Orthop 1996;110:311-20.
20. Lupi JE, Handelman CS, Sadowsky C. Prevalence and severity of apical root resorption and alveolar bone loss in orthodontically treated adults. Am J Orthod Dentofacial Orthop 1996;109:28-37.
21. Orozco-Varo A, Arroyo-Cruz G, Martínez-de-Fuentes R, Jiménez-Castellanos E. Biometric analysis of the clinical crown and the width/length ratio in the maxillary anterior region. J Prosthet Dent 2015;113:565-70.e2.
22. Mohandesan H, Ravanmehr H, Valaei N. A radiographic analysis of external apical root resorption of maxillary incisors during active orthodontic treatment. Eur J Orthod 2007;29:134-9.
23. Brin I, Tulloch JF, Koroluk L, Philips C. External apical root resorption in Class II malocclusion: a retrospective review of 1- versus 2-phase treatment. Am J Orthod Dentofacial Orthop 2003;124:151-6.
24. Nanekrungsan K, Patanaporn V, Janhom A, Korwanich N. External apical root resorption in maxillary incisors in orthodontic patients: associated factors and radiographic evaluation. Imaging Sci Dent 2012;42:147-54.
25. Uehara S, Maeda A, Tomonari H, Miyawaki S. Relationships between the root-crown ratio and the loss of occlusal contact and high mandibular plane angle in patients with open bite. Angle Orthod 2013;83:36-42.
26. Mavragani M, Vergari A, Selliseth NJ, Bøe OE,
Wisth PL. A radiographic comparison of apical root resorption after orthodontic treatment with a standard edgewise and a straight-wire edgewise technique. Eur J Orthod 2000;22:665-74.
27. Costopoulos G, Nanda R. An evaluation of root resorption incident to orthodontic intrusion. Am J Orthod Dentofacial Orthop 1996;109:543-8.
28. Martins DR, Tibola D, Janson G, Maria FR. Effects of intrusion combined with anterior retraction on apical root resorption. Eur J Orthod 2012;34:170-5.