Quantitative evaluation of alveolar cortical bone density in adults with different vertical facial types using cone-beam computed tomography
Objective: The purpose of this study was to quantitatively evaluate the cortical bone densities of the maxillary and mandibular alveolar processes in adults with different vertical facial types using cone-beam computed tomography (CBCT) images. Methods: CBCT images (n = 142) of adult patients (20–45 years) were classified into hypodivergent, normodivergent, and hyperdivergent groups on the basis of linear and angular S-N/Go-Me measurements. The cortical bone densities (in Hounsfield units) at maxillary and mandibular interdental sites from the distal aspect of the canine to the mesial aspect of the second molar were measured on the images. Results: On the maxillary buccal side, female subjects in the hyperdivergent group showed significantly decreased bone density, while in the posterior region, male subjects in the hyperdivergent group displayed significantly decreased bone density when compared with corresponding subjects in the other groups (p<0.001). Furthermore, the subjects in the hyperdivergent group had significantly lower bone densities on the mandibular buccal side than hypodivergent subjects. The maxillary palatal bone density did not differ significantly among groups, but female subjects showed significantly denser palatal cortical bone. No significant difference in bone density was found between the palatal and buccal sides in the maxillary premolar region. Overall, the palatal cortical bone was denser anteriorly and buccal cortical bone was denser posteriorly. Conclusion: Adults with the hyperdivergent facial type tend to have less-dense buccal cortical bone in the maxillary and mandibular alveolar processes. Clinicians should be aware of the variability of cortical bone densities at mini-implant placement sites.
[Korean J Orthod 2014;44(1):36-43]
Key words: Computed tomography, Orthodontic mini-implant, Bone-implant contact, Facial type
Fulya Ozdemir Murat Tozlu
Derya Germec Cakan
Department of Orthodontics, Faculty of Dentistry, Yeditepe University, Istanbul, Turkey
Received April 21, 2013; Revised June 17, 2013; Accepted June 28, 2013.
Corresponding author: Derya Germec Cakan.
Associate Professor, Department of Orthodontics, Faculty of Dentistry, Yeditepe University, Bağdat cad. No 238, Göztepe 34728, Istanbul, Turkey.
Tel +90-216-3636044 e-mail [email protected]
© 2013 The Korean Association of Orthodontists.
The authors report no commercial, proprietary, or financial interest in the products or companies described in this article.
This is an Open Access article distributed under the terms of the Creative Commons Attribution Non-Commercial License (http://creativecommons.org/licenses/by-nc/3.0) which permits unrestricted non-commercial use, distribution, and reproduction in any medium, provided the original work is properly cited.
pISSN 2234-7518 • eISSN 2005-372X
http://dx.doi.org/10.4041/kjod.2014.44.1.36
INTRODUCTION
Orthodontic mini-implant anchorage is a valuable al- ter native to extraoral anchorage and has eliminated most patient-compliance issues encountered during treatment.
1Mini-implants are simple, easy to use, cost- effective, and convenient for achieving absolute skeletal anchorage with an estimated success rate of 80–90%, which means that the mini-implant is lost in 10–20% of absolute anchorage cases.
2The success of orthodontic mini-implants is affected by the quality and density of the alveolar cortical bone.
If the bone is not sufficiently thick or dense, the mini- im plant may be lost because of lack of initial stability;
on the other hand, if the bone is too thick or dense, the mini-implant placement method may cause overheating of the bone structure or breakage of the device.
3,4There- fore, at-risk anatomic areas and patients should be clearly identified for appropriate treatment planning.
5A recent investigation using cone-beam computed tomo graphy (CBCT) revealed that vertical facial type may be related to cortical bone thickness of the alve- olar process and, therefore, to initial mini-implant sta- bility.
6Cortical bone density is reportedly a predictor for the initial stability of mini-implants.
7,8Although the thickness of the alveolar cortical bone has already been mapped, the variability in cortical bone density ac- cording to vertical facial type has not been studied yet.
The purpose of this study was to quantitatively eva- luate the cortical bone densities of the maxillary and mandibular alveolar processes in adults with different
ver tical facial types using CBCT images.
MATERIALS AND METHODS
The study sample was selected by a retrospective scree- ning of CBCT images archived at the Department of Oral Radiology, Yeditepe University Dental School (Istanbul, Turkey). The inclusion criteria were as follows: no peri- odontal disease with alveolar bone loss, age between 20 and 45 years, no excessive facial asymmetries, no cleft lip and/or palate, no missing teeth in the measurement areas, no diagnosed systemic diseases, and no severe craniofacial dysmorphology. Patient data were handled according to the requirements and recommendations of the Declaration of Helsinki. The institutional review board of Yeditepe University approved this study (appro- val number 207).
The CBCT images were obtained using ILUMA
TM(IMTEC Imaging, Ardmore, OK, USA) unit with an amorphous silicon flat-panel image detector and were saved as ILUMA
TMVision viewer files. The imaging parameters were as follows: 120 kVp, 3.8 mA, scan time of 40 s, focal spot of 3.3 mm, and voxel size of 0.093 mm.
Angular and linear measurements of S-N/Go-Me made on the images were used to group the patients accor- ding to the following different vertical facial types:
hy po divergent, normodivergent, and hyperdivergent groups. With regards to the linear measurement of S-Go/
N-Me, ratios of < 61%, 61% to 69%, and > 69% indicated increased, normal, and decreased facial heights, respec- tively. S-N/Go-Me angles of < 27
o, 27
oand 37
o, and > 37
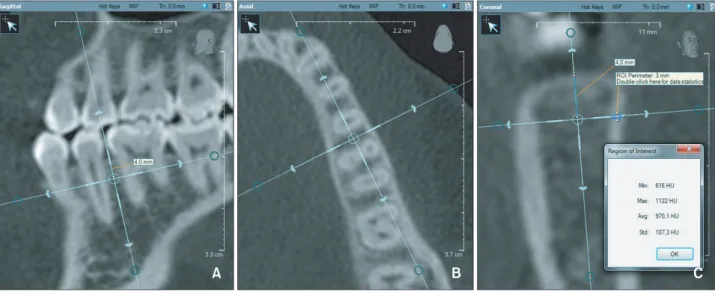
oFigure 1. Cortical bone density measurement. A, The vertical reference line bisects the interdental area and is parallel to
the long axes of the roots in the sagittal slice. B, The vertical reference line bisects the interdental area in the axial slice. C,
The cortical bone density is measured in Hounsfield units (HU) between points (one at the outer surface and the other at
the border of the cortical and cancellous bone) on a line perpendicular to the bone surface 4 mm apical to the alveolar
crest in the coronal slice.
indicated decreased, normal, and increased facial heights, respectively. If the two measurements did not indicate the same group, the corresponding images were excluded. Finally, 142 CBCT images were analyzed in this study.
The densities of the maxillary and mandibular buccal cortical plates and maxillary palatal cortical plate were measured at 4 interdental sites: between the canine and the first premolar (3–4), between the first and second premolars (4–5), between the second premolar and the first molar (5–6), and between the first and second molars (6–7). The lingual cortical plate in the mandible was not measured because of its limited use for mini- implant placement.
The positions of the measurement sites were located on the sagittal slices. The slices were oriented so that the vertical reference line bisected the interdental space and was parallel to the long axes of the roots. The axial slices were used to ensure that the vertical reference line bisected the interdental areas. Then, points 4 mm apical to the alveolar crest were determined on the coronal slices; this distance generally represents the mucogingival junction (Figure 1). Finally, cortical bone density was measured in Hounsfield units (HU) between points, one at the outer surface and the other at the border of the cortical and cancellous bone, on a line perpendicular to the bone surface in the coronal slices.
One orthodontist performed all the measurements and recorded the data in a Microsoft Excel file (Microsoft, Redmond, WA, USA). Thirty images (10 randomly selec- ted images from each group) were remeasured to check intra-observer reliability and the intraclass correlation coefficients were calculated.
Statistical calculations were carried out with NCSS 2007 software (NCSS LLC, Kaysville, UT, USA) for Win- dows. Besides descriptive statistics (mean and standard deviation) in the groups showing normal distribution, one-way ANOVA and Tukey multiple comparison tests were used for intergroup and subgroup comparisons, respectively. For comparison of the independent data, paired t-test was used; for analyzing the qualitative data, the chi-square test was used. The results were evaluated at the significance level of p < 0.05, with a 95% confidence interval.
RESULTS
The repeated measurements were consistent and indicated very good intra-observer reliability, as the in- traclass correlation coefficients were above 0.85.
The mean ages of the hypodivergent, normodivergent, and hyperdivergent groups were 33.23 ± 7.26, 32.50 ± 7.92, and 34.62 ± 6.63 years, respectively. The hypo- divergent group included 41 male (51.3%) and 39 female
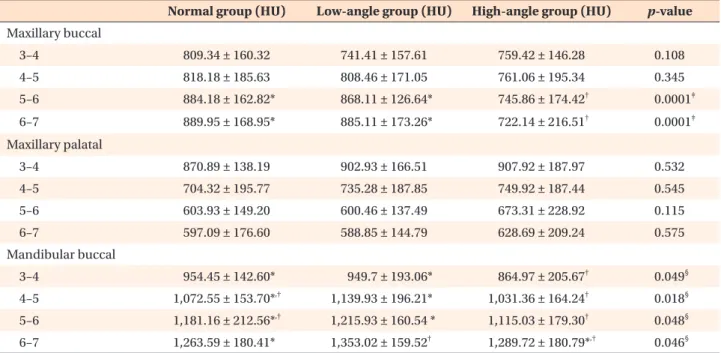
Table 1. Comparison of the cortical bone densities among the male subjects
Normal group (HU) Low-angle group (HU) High-angle group (HU) p-value Maxillary buccal
3–4 809.34 ± 160.32 741.41 ± 157.61 759.42 ± 146.28 0.108
4–5 818.18 ± 185.63 808.46 ± 171.05 761.06 ± 195.34 0.345
5–6 884.18 ± 162.82* 868.11 ± 126.64* 745.86 ± 174.42
†0.0001
‡6–7 889.95 ± 168.95* 885.11 ± 173.26* 722.14 ± 216.51
†0.0001
‡Maxillary palatal
3–4 870.89 ± 138.19 902.93 ± 166.51 907.92 ± 187.97 0.532
4–5 704.32 ± 195.77 735.28 ± 187.85 749.92 ± 187.44 0.545
5–6 603.93 ± 149.20 600.46 ± 137.49 673.31 ± 228.92 0.115
6–7 597.09 ± 176.60 588.85 ± 144.79 628.69 ± 209.24 0.575
Mandibular buccal
3–4 954.45 ± 142.60* 949.7 ± 193.06* 864.97 ± 205.67
†0.049
§4–5 1,072.55 ± 153.70*
,†1,139.93 ± 196.21* 1,031.36 ± 164.24
†0.018
§5–6 1,181.16 ± 212.56*
,†1,215.93 ± 160.54 * 1,115.03 ± 179.30
†0.048
§6–7 1,263.59 ± 180.41* 1,353.02 ± 159.52
†1,289.72 ± 180.79*
,†0.046
§Values are presented as mean ± standard deviation.
*
,†Same superscript letters indicate no significant difference.
‡
p < 0.05,
§p < 0.001.
HU, Hounsfield unit; 3, canine; 4, first premolar; 5, second premolar; 6, first molar; 7, second molar.
(48.8%) subjects, the normodivergent group included 44 male (44.0%) and 56 female (56.0%) subjects, and the hyperdivergent group included 36 male (34.6%) and 68 female (65.4%) subjects. No significant differences in mean age ( p = 0.111) and gender (p = 0.073) were noted among the groups.
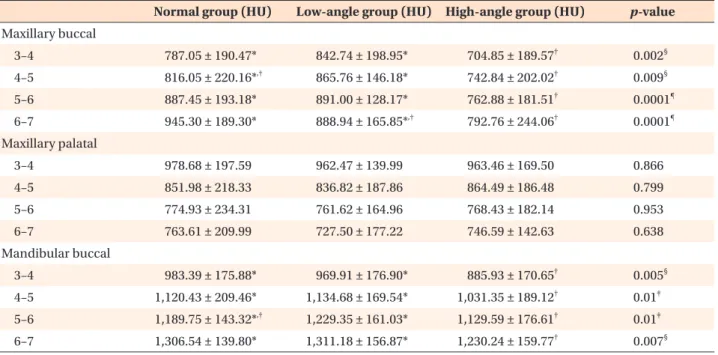
The cortical bone density was not significantly dif- ferent between the right and left sides at any of the mea surement sites (p > 0.05). In the hyperdivergent group, the female subjects had decreased cortical bone density at all of the maxillary buccal measurement sites, whereas the male subjects had decreased bone density only in the maxillary buccal 5–6 and 6–7 regions, when compared with the corresponding subjects of the other groups (Tables 1 and 2). In the mandible, this group had lower buccal cortical bone density at all of the measurements sites when compared to the hypodivergent group. No significant differences in the palatal cortical bone density were observed among the groups (Tables 1 and 2). However, the female subjects generally had denser palatal cortical bone than the male subjects (Table 3).
Mostly, all of the groups showed no significant dif- ferences in cortical bone density between the palatal and buccal sides of the maxillary premolar region (Table 4). Nevertheless, the palatal cortical bone was denser anteriorly, whereas the buccal cortical bone was denser posteriorly. In the normodivergent group, the
Table 2. Comparison of the cortical bone densities among the female subjects
Normal group (HU) Low-angle group (HU) High-angle group (HU) p-value Maxillary buccal
3–4 787.05 ± 190.47* 842.74 ± 198.95* 704.85 ± 189.57
†0.002
§4–5 816.05 ± 220.16*
,†865.76 ± 146.18* 742.84 ± 202.02
†0.009
§5–6 887.45 ± 193.18* 891.00 ± 128.17* 762.88 ± 181.51
†0.0001
¶6–7 945.30 ± 189.30* 888.94 ± 165.85*
,†792.76 ± 244.06
†0.0001
¶Maxillary palatal
3–4 978.68 ± 197.59 962.47 ± 139.99 963.46 ± 169.50 0.866
4–5 851.98 ± 218.33 836.82 ± 187.86 864.49 ± 186.48 0.799
5–6 774.93 ± 234.31 761.62 ± 164.96 768.43 ± 182.14 0.953
6–7 763.61 ± 209.99 727.50 ± 177.22 746.59 ± 142.63 0.638
Mandibular buccal
3–4 983.39 ± 175.88* 969.91 ± 176.90* 885.93 ± 170.65
†0.005
§4–5 1,120.43 ± 209.46* 1,134.68 ± 169.54* 1,031.35 ± 189.12
†0.01
‡5–6 1,189.75 ± 143.32*
,†1,229.35 ± 161.03* 1,129.59 ± 176.61
†0.01
‡6–7 1,306.54 ± 139.80* 1,311.18 ± 156.87* 1,230.24 ± 159.77
†0.007
§Values are presented as mean ± standard deviation.
*
,†Same superscript letters indicate no significant difference.
‡