Cone-beam computed tomography based evaluation of rotational patterns of dentofacial structures in skeletal Class III deformity with mandibular asymmetry
11
0
0
전체 글
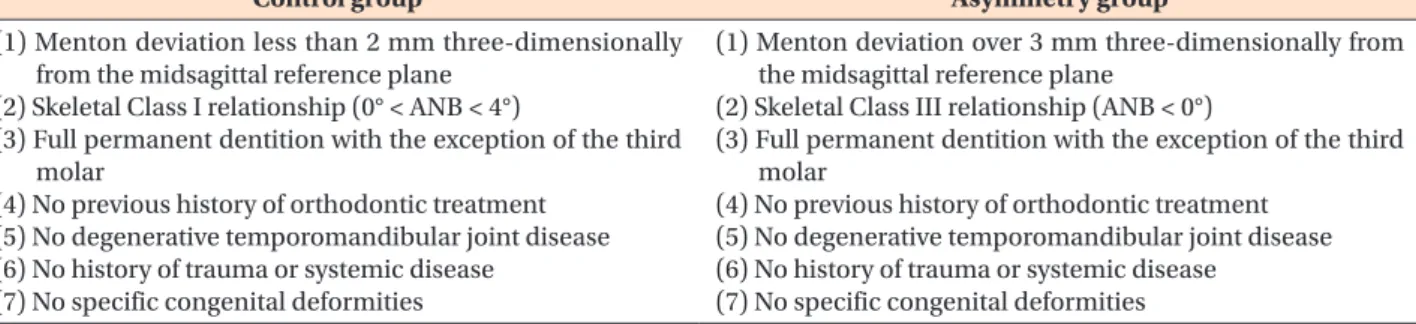
(2) Ryu et al • 3D evaluation on rotation patterns. INTRODUCTION. clination of the ramus and vertical maxillary excess on the contralateral side. Further, by 3D maxillofacial image analysis, Hwang et al.14 suggested that six factors in fluence chin deviation: maxillary height, ramal length, frontal ramal inclination, lateral ramal inclination, mandibular body length, and mandibular body height. However, only a few studies of the relationship between rotation of dentofacial structures and mandibular asymmetry have been conducted, especially according to different vertical skeletal patterns. The purpose of this study was to assess rotational patterns of dentofacial structures according to different vertical skeletal patterns by CBCT and analyze their influence on menton devi ation in skeletal Class III deformity with mandibular asymmetry.. Facial asymmetry is an imbalanced state between one side of the face and the other.1,2 It is one of the essen tial factors affecting facial esthetics. Since pursuing facial beauty is a major trend in contemporary society, more patients who complain about facial asymmetry visit orthodontic clinics for treatment. In addition, some want to improve their facial appearance without knowing exactly which part is asymmetric and seek advice from the orthodontist. Therefore, orthodontists should be more discreet in diagnosing facial asymmetry. Heretofore, posteroanterior (PA) cephalometry was the key to diagnosis of facial asymmetry. However, its reliability is limited because of overlapped anatomical structures, magnification errors, and image distortion.3-5 Therefore, some posterior asymmetries may not be detectable.6 Computed tomography (CT) greatly reduces such problems and enables more detailed understanding of dentofacial structures.7-9 In addition, CT software are good tools for three-dimensional (3D) reconstruction and measurement. Several studies have used cone-beam CT (CBCT) to examine craniomaxillofacial relationships and facial asymmetry. Given the 3D nature of the maxillofacial complex, facial asymmetry should be evaluated spatially. Ackerman et al.10 proposed the use of not only translation in three planes (forward/backward, up/down, and right/left) but also rotation about three perpendicular axes (yaw, pitch, and roll) to describe the orientation of the head, jaws, and dentition for comprehensive evaluation of dentofacial traits. Accordingly, Kim 11 measured yaw and roll of the dental arches and mandible in Class III malocclusion with facial asymmetry. Severt and Proffit12 studied the relationship of clinically apparent asymmetry with dentofacial deformities and found different prevalences of facial asymmetry according to the vertical skeletal pattern. Baek et al.13 reported that facial asymmetry in skeletal Class III deformity occurs due to greater growth and mesial in. MATERIALS AND METHODS Subjects Eighty-five Korean subjects participated in this study. The control group included 30 young adults (15 men and 15 women; mean age, 24.30 ± 4.14 years) with skeletal Class I features who were screened from 480 dental students of Wonkwang University (Iksan, Korea). The asymmetry group comprised 55 adults showing skeletal Class III deformity with mandibular asymmetry. They were sampled from 1,000 patients who underwent CBCT for routine diagnostic preparation in the orthodontic department of Wonkwang University Dental Hospital from March 2010 to February 2014. The inclusion criteria of the groups are described in Table 1. Fifty-five subjects of the asymmetry group were classi fied into two subgroups depending on the mandibular plane angle (SN-GoMe).15 Mandibular plane angles were measured on lateral cephalometric images extracted from CBCT images and digitized with OnDemand3D software (Cybermed, Inc., Seoul, Korea). Subjects with mandibular plane angles larger than 35o were classified into the hyperdivergent subgroup (13 men and 15 women; mean age, 26.34 ± 3.14 years; mean SN-GoMe,. Table 1. Inclusion criteria Control group. Asymmetry group. (1) Menton deviation less than 2 mm three-dimensionally from the midsagittal reference plane (2) Skeletal Class I relationship (0° < ANB < 4°) (3) Full permanent dentition with the exception of the third molar (4) No previous history of orthodontic treatment (5) No degenerative temporomandibular joint disease (6) No history of trauma or systemic disease (7) No specific congenital deformities. (1) Menton deviation over 3 mm three-dimensionally from the midsagittal reference plane (2) Skeletal Class III relationship (ANB < 0°) (3) Full permanent dentition with the exception of the third molar (4) No previous history of orthodontic treatment (5) No degenerative temporomandibular joint disease (6) No history of trauma or systemic disease (7) No specific congenital deformities. 154. http://dx.doi.org/10.4041/kjod.2015.45.4.153. www.e-kjo.org.
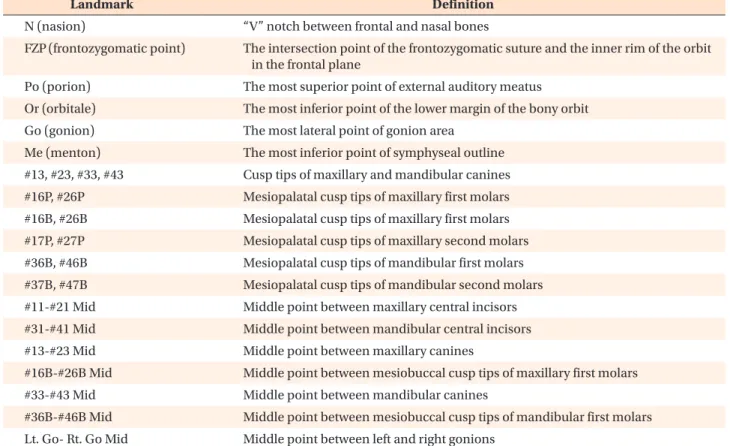
(3) Ryu et al • 3D evaluation on rotation patterns. Table 2. Definitions of landmarks Landmark. Definition. N (nasion). “V” notch between frontal and nasal bones. FZP (frontozygomatic point). The intersection point of the frontozygomatic suture and the inner rim of the orbit in the frontal plane. Po (porion). The most superior point of external auditory meatus. Or (orbitale). The most inferior point of the lower margin of the bony orbit. Go (gonion). The most lateral point of gonion area. Me (menton). The most inferior point of symphyseal outline. #13, #23, #33, #43. Cusp tips of maxillary and mandibular canines. #16P, #26P. Mesiopalatal cusp tips of maxillary first molars. #16B, #26B. Mesiopalatal cusp tips of maxillary first molars. #17P, #27P. Mesiopalatal cusp tips of maxillary second molars. #36B, #46B. Mesiopalatal cusp tips of mandibular first molars. #37B, #47B. Mesiopalatal cusp tips of mandibular second molars. #11-#21 Mid. Middle point between maxillary central incisors. #31-#41 Mid. Middle point between mandibular central incisors. #13-#23 Mid. Middle point between maxillary canines. #16B-#26B Mid. Middle point between mesiobuccal cusp tips of maxillary first molars. #33-#43 Mid. Middle point between mandibular canines. #36B-#46B Mid. Middle point between mesiobuccal cusp tips of mandibular first molars. Lt. Go- Rt. Go Mid. Middle point between left and right gonions. A. B. #11-#21 Mid. #13. #23. #16B #26B N Rt. FZP. #16P. #26P. Lt. FZP #17P #27P Lt. Or. Rt. Or. C #47B. #37B. #46B Rt. Go. #36B. Lt. Go. Me. #43. #33 #31-#41 Mid. www.e-kjo.org. http://dx.doi.org/10.4041/kjod.2015.45.4.153. Figure 1. Landmarks used in this study. A, Facial skeleton. B, Maxillary dental arch. C, Mandibular dental arch. FZP, Or, and Go are bilateral landmarks. See Table 2 for definitions. 155.
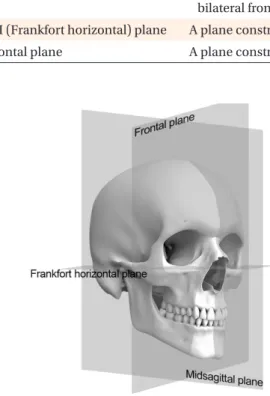
(4) Ryu et al • 3D evaluation on rotation patterns. 39.78o ± 2.90o) and those with mandibular plane angles smaller than 35o were included in the hypodivergent sub group (15 men and 12 women; mean age, 28.96 ± 5.27 years; mean SN-GoMe, 31.24o ± 2.78o). The institutional. review board of Wonkwang University approved this study (WKDIRB201402-01).. Table 3. Definitions of reference planes Reference plane. Definition. Midsagittal plane. A plane constructed with N which is perpendicular to the line connecting bilateral frontozygomatic point. FH (Frankfort horizontal) plane. A plane constructed with right FH line which is perpendicular to midsagittal plane. Frontal plane. A plane constructed with N which is perpendicular to the FH plane and midsagittal plane. Midsagittal plane. (+). Figure 2. Reference planes used in this study. See Table 3 for definitions.. Figure 4. Positive sign of lower anterior yaw relative to the direction of menton deviation.. Frankfort horizontal plane. Parallel to Frankfort horizontal plane. (+). (+). Mid sagittal plane. Figure 3. Positive upper canine roll relative to the direc tion of menton deviation. 156. Midsagittal plane. Figure 5. Positive upper anterior shift relative to the direction of menton deviation.. http://dx.doi.org/10.4041/kjod.2015.45.4.153. www.e-kjo.org.
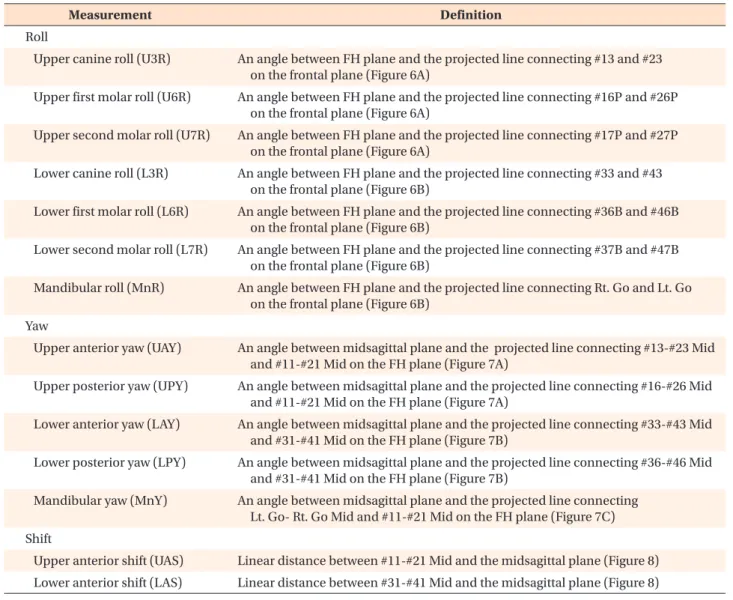
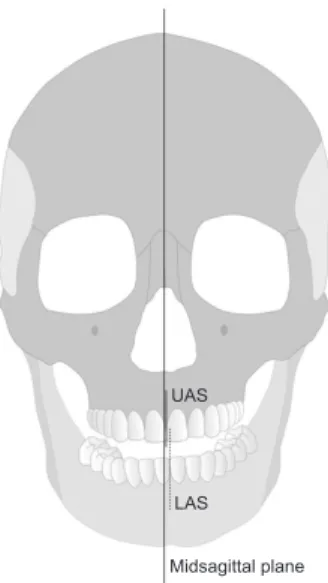
(5) Ryu et al • 3D evaluation on rotation patterns. CBCT imaging and 3D reconstruction CBCT images were acquired with an Alphard VEGA scanner (Asahi Roentgen Ind. Co., Ltd., Kyoto, Japan). The following settings were used: field of view, 200 × 179 mm; 80 kV; 5.00 mA; exposure time, 17 s; voxel size, 0.39 mm; and slice thickness, 1.00 mm. The voxels were exported in digital imaging and communications in medicine (DICOM) format. The DICOM files were reconstructed to 3D images using OnDemand3D 1.0 software (Cybermed, Inc.) after the threshold was adjusted for visible pixels. To mini mize measurement errors due to nonstandard head posture, the 3D images were reorientated according to two reference planes: nasofrontozygomatic and Frankfort horizontal planes. The nasofrontozygomatic plane was constructed with three points: nasion and bilateral frontozygomatic points. The origin (0, 0, 0) of the coordinate system was registered at nasion and. three axes (x , y , and z ) were constructed. The transverse axis (x -axis) was parallel to the frontozygomatic line. The anteroposterior axis (z -axis) was perpendicular to the frontozygomatic line and parallel to the right Frankfort horizontal line. The vertical axis (y -axis) was perpendicular to both the frontozygomatic and the right Frankfort horizontal lines. Measurements The amount of menton deviation and shift, roll, and yaw of the dental arches and mandible were measured according to a previous study 11 using the 3D Ceph module of OnDemand3D software. Landmarks for the measurements are described in Table 2 and Figure 1. The three reference planes are described in Table 3 and Figure 2. A positive or negative sign was added to each measurement depending on the direction of rotation relative to the direction of menton deviation (Figures. Table 4. Definitions of rotational variables Measurement. Definition. Roll Upper canine roll (U3R). An angle between FH plane and the projected line connecting #13 and #23 on the frontal plane (Figure 6A). Upper first molar roll (U6R). An angle between FH plane and the projected line connecting #16P and #26P on the frontal plane (Figure 6A). Upper second molar roll (U7R). An angle between FH plane and the projected line connecting #17P and #27P on the frontal plane (Figure 6A). Lower canine roll (L3R). An angle between FH plane and the projected line connecting #33 and #43 on the frontal plane (Figure 6B). Lower first molar roll (L6R). An angle between FH plane and the projected line connecting #36B and #46B on the frontal plane (Figure 6B). Lower second molar roll (L7R). An angle between FH plane and the projected line connecting #37B and #47B on the frontal plane (Figure 6B). Mandibular roll (MnR). An angle between FH plane and the projected line connecting Rt. Go and Lt. Go on the frontal plane (Figure 6B). Yaw Upper anterior yaw (UAY). An angle between midsagittal plane and the projected line connecting #13-#23 Mid and #11-#21 Mid on the FH plane (Figure 7A). Upper posterior yaw (UPY). An angle between midsagittal plane and the projected line connecting #16-#26 Mid and #11-#21 Mid on the FH plane (Figure 7A). Lower anterior yaw (LAY). An angle between midsagittal plane and the projected line connecting #33-#43 Mid and #31-#41 Mid on the FH plane (Figure 7B). Lower posterior yaw (LPY). An angle between midsagittal plane and the projected line connecting #36-#46 Mid and #31-#41 Mid on the FH plane (Figure 7B). Mandibular yaw (MnY). An angle between midsagittal plane and the projected line connecting Lt. Go- Rt. Go Mid and #11-#21 Mid on the FH plane (Figure 7C). Shift Upper anterior shift (UAS). Linear distance between #11-#21 Mid and the midsagittal plane (Figure 8). Lower anterior shift (LAS). Linear distance between #31-#41 Mid and the midsagittal plane (Figure 8). www.e-kjo.org. http://dx.doi.org/10.4041/kjod.2015.45.4.153. 157.
(6) Ryu et al • 3D evaluation on rotation patterns. 3−5).. incisors to the midsagittal plane (Table 4 and Figure 8).. Angular measurements To measure roll (rotation around the z-axis), functional occlusal lines connecting canine cusp tips, mesiopalatal cusps of the maxillary molars, and mesiobuccal cusps of the mandibular molars were used (Table 4 and Figure 6). Yaw (rotation around the y-axis) was measured at canine cusp tips and mesiobuccal cusps of the molars (Table 4 and Figure 7).. Statistical analysis All reorientations and measurements were repeated after a 2-week interval by the same investigator. As a paired t -test showed no significant difference bet ween the assessments (p > 0.05) and the intra-exa miner agreement was excellent (intraclass correlation coefficients = 0.828 −0.930), the second assessment was used in this study. The measurements showed no significant gender difference in any group. As some variables were not normally distributed, according to the Shapiro-Wilk test, the Kruskal-Wallis test was used to compare differences among the groups. Then, the Mann-Whitney U -test was performed for post-. Linear measurements Menton deviation was measured as the distance bet ween menton and the midsagittal plane. Shift was mea sured as the distance from the midpoint of the central. A. B. Frankfort horizontal plane. U3R U6R U7R. L3R L6R L7R MnR. Parallel to Frankfort horizontal plane. Parallel to Frankfort horizontal plane. Figure 6. Measurements of roll in this study. A, Maxillary dental arch. B, Mandibular dental arch. See Table 4 for definitions.. A. B. Midsagittal plane. C Midsagittal plane. UAY UPY. LAY LPY. Rt. Go. Lt. Go. . Midsagittal plane. Figure 7. Measurements of yaw in this study. A, Maxillary dental arch. B, Mandibular dental arch. C, Mandible. LAY, Lower anterior yaw; LPY, Lower posterior yaw. 158. http://dx.doi.org/10.4041/kjod.2015.45.4.153. www.e-kjo.org.
(7) Ryu et al • 3D evaluation on rotation patterns. hoc multiple comparison with Bonferroni correction. Spearman rank correlation and multiple regression an alyses were performed to determine the relationships between the rotational variables and menton deviation. All statistical tests were set at 95% confidence level (p < 0.05) and performed using SPSS Statistics software, version 17.0 (SPSS Inc., Chicago, IL, USA).. RESULTS UAS. LAS. Midsagittal plane. Figure 8. Measurements of shift in this study. See Table 4 for definitions.. Comparison of the control and asymmetry groups Table 5 shows the results of the intergroup com parisons. Lower anterior shift (p < 0.01), lower first molar roll (p < 0.01), lower second molar roll (p < 0.01), upper posterior yaw (p < 0.05), lower posterior yaw (p < 0.01), and mandibular yaw (p < 0.01) were significantly larger in the hyperdivergent subgroup than in the control group. Further, upper anterior shift (p < 0.01), lower anterior shift (p < 0.01), upper second molar roll (p < 0.01), lower canine roll (p < 0.01), lower first molar roll (p < 0.01), lower second molar roll (p < 0.01), lower. Table 5. Differences among control group and asymmetry groups Variable. Control group (n=30). Hyperdivergent subgroup (n=28). Hypodivergent subgroup (n=27). p -value. Multiple comparision. Mandibular plane angle (o). 32.86 ± 4.25. 39.78 ± 2.90. 31.24 ± 2.78. 0.000†. G1 < G2, G3 < G2. †. Menton deviation (mm). 1.09 ± 0.99. 5.94 ± 2.23. 5.72 ± 2.05. 0.000. G1 < G2, G1 < G3. U3R. 0.37 ± 1.09. −0.07 ± 2.26. 1.20 ± 3.00. 0.83. NS. U6R. 0.60 ± 1.56. 0.34 ± 1.61. 1.28 ± 2.50. 0.21. NS. U7R. 0.70 ± 1.85. 1.44 ± 1.95. 2.04 ± 1.51. 0.024*. G1 < G3. L3R. 0.58 ± 1.76. 1.63 ± 2.83. 2.68 ± 3.08. 0.012*. G1 < G3. 2.32 ± 2.33. †. G1 < G2, G1 < G3. †. o. Roll ( ). L6R. 0.70 ± 1.37. 2.07 ± 2.00. 0.001. L7R. 0.38 ± 1.55. 2.01 ± 1.87. 2.10 ± 1.95. 0.001. G1 < G2, G1 < G3. MnR. 0.14 ± 1.60. 1.12 ± 1.70. 1.04 ± 2.67. 0.13. NS. UAY. −0.81 ± 3.10. −2.92 ± 9.16. −1.88 ± 6.29. 0.90. UPY. −0.33 ± 1.41. −1.32 ± 2.95. 0.28 ± 2.25. 0.009†. LAY. 0.80 ± 5.36. 3.08 ± 14.09. 0.17. o. Yaw ( ). 4.89 ± 10.54. NS G1 < G2, G2 < G3 NS †. −0.17 ± 1.48. 3.70 ± 3.06. 3.78 ± 3.86. 0.000. G1 < G2, G1 < G3. 0.03 ± 1.38. 3.41 ± 2.06. 2.35 ± 2.14. 0.000†. G1 < G2, G1 < G3. UAS. 0.41 ± 1.26. 0.98 ± 1.64. 1.82 ± 1.31. 0.001†. G1 < G3. LAS. 0.69 ± 1.08. 4.45 ± 2.24. 3.93 ± 2.60. 0.001†. G1 < G2, G1 < G3. LPY MnY Shift (mm). Group 1, Control group; group 2, hyperdivergent asymmetry group; group 3, hypodivergent asymmetry group; SD, standard deviation; NS, not significant. See Table 4 for definition of each landmark or measurement. Kruskal-Wallis test and Mann-Whitney U -test as a post-hoc multiple comparion (Bonferroni correction) were used for statistical anlaysis.*p < 0.05; †p < 0.01.. www.e-kjo.org. http://dx.doi.org/10.4041/kjod.2015.45.4.153. 159.
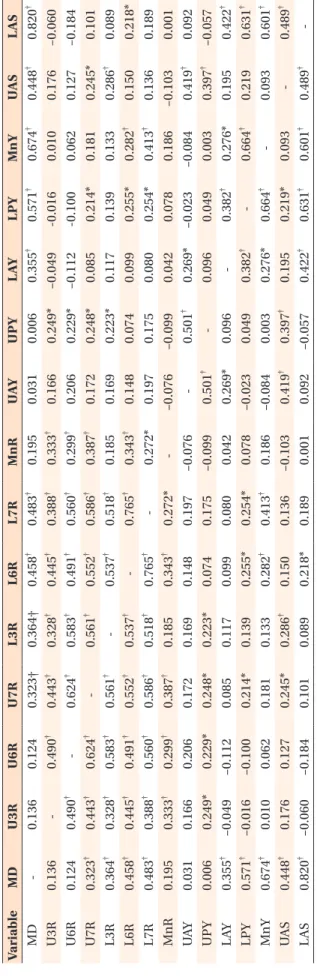
(8) Ryu et al • 3D evaluation on rotation patterns. B. β. UAS 0.448† 0.176 0.127 0.245* 0.286† 0.150 0.136 –0.103 0.419† 0.397† 0.195 0.219 0.093 0.489†. LAS. 0.826. 0.752. 0.000‡. L7R. 0.309. 0.206. 0.001†. MnY. 0.361. 0.291. 0.000‡. MnY 0.674† 0.010 0.062 0.181 0.133 0.282† 0.413† 0.186 –0.084 0.003 0.276* 0.664† 0.093 0.601†. LAS 0.820† –0.060 –0.184 0.101 0.089 0.218* 0.189 0.001 0.092 –0.057 0.422† 0.631† 0.601† 0.489† -. Table 7. Multiple regression analysis to assess the relative contributions of variables to menton deviation. L3R. 0.226. 0.211. 0.000‡. LPY. −0.206. −0.245. 0.001‡. Variable. LAY 0.355† –0.049 –0.112 0.085 0.117 0.099 0.080 0.042 0.269* 0.096 0.382† 0.276* 0.195 0.422†. LPY 0.571† -0.016 -0.100 0.214* 0.139 0.255* 0.254* 0.078 –0.023 0.049 0.382† 0.664† 0.219* 0.631†. Adjusted R2, 0.825. B, Non-standardized regression coefficient; b, stan dardized regression coefficient. See Table 4 for definition of each landmark or mea surement. † p < 0.01; ‡p < 0.001.. UPY 0.006 0.249* 0.229* 0.248* 0.223* 0.074 0.175 –0.099 0.501† 0.096 0.049 0.003 0.397† –0.057. posterior yaw (p < 0.01), and mandibular yaw (p < 0.01) were significantly larger in the hypodivergent subgroup than in the control group. Only upper posterior yaw (p < 0.01) was significantly larger in the hypodivergent subgroup than in the hyperdivergent subgroup.. See Table 4 for definition of each landmark or measurement. Spearman’s rank correlation analysis was used for statistical anlaysis. *p < 0.05, †p < 0.01.. UAY 0.031 0.166 0.206 0.172 0.169 0.148 0.197 –0.076 0.501† 0.269* –0.023 –0.084 0.419† 0.092 MnR 0.195 0.333† 0.299† 0.387† 0.185 0.343† 0.272* –0.076 –0.099 0.042 0.078 0.186 –0.103 0.001 L7R 0.483† 0.388† 0.560† 0.586† 0.518† 0.765† 0.272* 0.197 0.175 0.080 0.254* 0.413† 0.136 0.189 L6R 0.458† 0.445† 0.491† 0.552† 0.537† 0.765† 0.343† 0.148 0.074 0.099 0.255* 0.282† 0.150 0.218* L3R 0.364† 0.328† 0.583† 0.561† 0.537† 0.518† 0.185 0.169 0.223* 0.117 0.139 0.133 0.286† 0.089 U7R 0.323† 0.443† 0.624† 0.561† 0.552† 0.586† 0.387† 0.172 0.248* 0.085 0.214* 0.181 0.245* 0.101 U6R 0.124 0.490† 0.624† 0.583† 0.491† 0.560† 0.299† 0.206 0.229* –0.112 –0.100 0.062 0.127 –0.184 U3R 0.136 0.490† 0.443† 0.328† 0.445† 0.388† 0.333† 0.166 0.249* –0.049 –0.016 0.010 0.176 –0.060 MD 0.136 0.124 0.323† 0.364† 0.458† 0.483† 0.195 0.031 0.006 0.355† 0.571† 0.674† 0.448† 0.820† Variable MD U3R U6R U7R L3R L6R L7R MnR UAY UPY LAY LPY MnY UAS LAS. Table 6. Inter-variables correlationship coefficients. 160. p -value. Relationships between rotational variables The results of Spearman rank correlation analysis are listed in Table 6. Lower anterior shift (r = 0.820; p < 0.01), mandibular yaw (r = 0.674; p < 0.01), lower posterior yaw (r = 0.571; p < 0.01), lower second molar roll (r = 0.483; p < 0.01), lower first molar roll (r = 0.458; p < 0.01), upper anterior shift (r = 0.448; p < 0.01), lower canine roll (r = 0.364; p < 0.01), lower anterior yaw (r = 0.355; p < 0.01), and upper second molar roll (r = 0.323; p < 0.01) showed positive correlations with menton deviation. The measurements of roll except lower canine roll and mandibular roll were significantly (p < 0.01) and positively correlated with one another (Table 6). Upper anterior yaw showed significant positive correlations with upper posterior yaw (r = 0.501; p < 0.01) and lower anterior yaw (r = 0.269; p < 0.05). Lower anterior yaw showed significant positive correlations with lower posterior yaw (r = 0.382; p < 0.01) and mandibular yaw (r = 0.276; p < 0.05). Further, lower posterior yaw showed a significant positive correlation with mandibular yaw (r = 0.664; p < 0.01). Upper anterior shift was positively correlated with lower anterior shift (r = 0.489; p < 0.01). Upper and lower anterior yaw showed no significant correlation with any measurement of roll. However, upper posterior yaw was positively correlated with upper canine roll (r = 0.249; p< 0.05), upper first molar roll (r = 0.229; p < 0.05), upper second molar roll (r = 0.248; p < 0.05), and lower canine roll (r = 0.223; p <. http://dx.doi.org/10.4041/kjod.2015.45.4.153. www.e-kjo.org.
(9) Ryu et al • 3D evaluation on rotation patterns. 0.05). Lower posterior yaw was significantly correlated with upper second molar roll (r = 0.214; p < 0.05), lower first molar roll (r = 0.255; p < 0.05), and lower second molar roll (r = 0.254; p < 0.05) (Table 6). Multiple regression analysis showed that menton de viation was influenced by lower anterior shift, lower second molar roll, mandibular yaw, lower canine roll, and lower posterior yaw (Table 7).. DISCUSSION Greater patient awareness of facial asymmetry, es pecially chin deformity, warrants greater attention in diagnosis of mandibular asymmetry.16 Mandibular asy mmetry can be evaluated by the amount of menton deviation from the midsagittal plane. However, in some cases, deviation or rotation of the maxilla can cause man dibular asymmetry as the temporomandibular joints adapt by remodeling or growth. Maeda et al.17 detected solely mandibular asymmetry in 80% of their patients, while both the maxilla and the mandible were involved in 20% of the cases. Another report described similar results: 74% of the cases involved mandibular asymmetry and 36% had both maxillary and mandibular asymmetry.12 In this study, rotation of mandibular structures affected menton deviation more than that of maxillary structures. Midline discrepancy of the dental arches also influ ences the patient's cognition of facial asymmetry. It reflects not only mandibular asymmetric growth but also deformation of the upper and middle thirds of the face. Furthermore, dental features such as space deficiency, spacing, missing teeth, supernumerary teeth, and premature contact sometimes increase the tendency for facial asymmetry by altering arch form and direction of skeletal growth. Therefore, this study examined the effect of rotation of the dental arches on facial asym metry. According to Haraguchi et al.,18 any landmark de viating by more than 2 mm from the facial midline is asymmetric. Severt and Proffit 12 found an increased percentage of chin deviation of at least 2 mm from the midline in Class III deformity. Further, Chebib and Chamma19 suggested that deviation of more than 3 mm is abnormal. In this study, mandibular asymmetry was considered present when menton deviation was more than 3 mm from the midsagittal plane: the asymmetry group showed a greater amount of menton deviation than the control group. Radiographic techniques such as PA cephalometry and panoramic radiography can be used to assess facial asymmetry but produce only two-dimensional images and are prone to errors.20,21 Although CBCT is relatively reliable with regard to head orientation,22 natural head position is not always ensured because head tilting is. www.e-kjo.org. http://dx.doi.org/10.4041/kjod.2015.45.4.153. common in patients with facial asymmetry.23 Therefore, reorientation based on the midsagittal plane is necessary to assess facial asymmetry. Various landmarks have been proposed to develop the midsagittal plane. As the position of the anterior nasal spine changes if there is facial asymmetry including the maxilla, mandibular asymmetry can be overestimated or underestimated in relation to the maxilla.23 Thus, the anterior nasal spine was not used as a landmark in this study. The fron tozygomatic suture shows good potential as a reference for assessing facial asymmetry,5,24,25 so the nasion and bilateral frontozygomatic points were used to construct the midsagittal plane in this study.26 Importantly, Kim et al.27 found that cranial base volume is correlated with mandibular asymmetry in patients with facial asy mmetry and mandibular prognathism, influencing the construction of reference planes with landmarks at the cranial base. A few studies have focused on canting of anatomical structures (eye, lip, occlusal plane, otobasion, gonion), similar to roll in this study. Using frontal cephalograms, frontal photos, 3D CT images, Hwang et al.28 found that preoperative lip-line cant shows positive correlations with menton deviation and mandibular anterior occlusal plane cant. Lee et al.29 demonstrated that lip cant and chin deviation affect the assessment of facial asymmetry. These results are consistent with those of the present study, in which most measurements of roll were strongly correlated with menton deviation. Kim 11 examined rotational patterns of the dental arches and mandible in Class III deformity with facial asymmetry. In this study, roll and yaw of dentofacial structures in skeletal Class III deformity with mandibular asymmetry were measured according to different vertical skeletal patterns, as modified in establishing reference planes. Upper posterior yaw varied slightly between the vertical skeletal patterns. Interestingly, differences in the mandibular plane angle did not explain menton deviation. Only roll and yaw of the posterior parts of the man dible showed significant differences between the control and the asymmetry groups and positive correlations with menton deviation. The result implies that rotation of mandibular posterior dentofacial structures affects menton deviation, and therefore, mandibular asymmetry. Further study with a larger sample size would enable more detailed evaluation of rotational patterns of den tofacial structures. Moreover, the relationship between the anteroposterior skeletal pattern and rotation of dentofacial structures should be assessed for in-depth study of facial asymmetry.. 161.
(10) Ryu et al • 3D evaluation on rotation patterns. CONCLUSION Menton deviation in skeletal Class III deformity with mandibular asymmetry is associated with rotation of mandibular posterior dentofacial structures. The rota tional patterns vary slightly according to the vertical skeletal pattern.. REFERENCES 1. Enlow DH. Facial growth. 3rd ed. Philadelphia: Saunders; 1990. 2. Shah SM, Joshi MR. An assessment of asymmetry in the normal craniofacial complex. Angle Orthod 1978;48:141-8. 3. Pirttiniemi P, Miettinen J, Kantomaa T. Combined effects of errors in frontal-view asymmetry diagnosis. Eur J Orthod 1996;18:629-36. 4. Padwa BL, Kaiser MO, Kaban LB. Occlusal cant in the frontal plane as a reflection of facial asymmetry. J Oral Maxillofac Surg 1997;55:811-6. 5. Trpkova B, Prasad NG, Lam EW, Raboud D, Glover KE, Major PW. Assessment of facial asymmetries from posteroanterior cephalograms: validity of reference lines. Am J Orthod Dentofacial Orthop 2003;123:512-20. 6. Va n n i e r M W, M a rsh J L , W a r re n J O. T h re e d i m e ns i o n a l C T re c o ns t r u c t i o n i m a g e s f o r craniofacial surgical planning and evaluation. Radiology 1984;150:179-84. 7. Fuhrmann RA, Schnappauf A, Diedrich PR. Threedimensional imaging of craniomaxillofacial structures with a standard personal computer. Dentomaxillofac Radiol 1995;24:260-3. 8. Vannier MW, Hildebolt CF, Conover G, Knapp RH, Yokoyama-Crothers N, Wang G. Three-dimensional dental imaging by spiral CT. A progress report. Oral Surg Oral Med Oral Pathol Oral Radiol Endod 1997;84:561-70. 9. Kim MG, Lee JW, Cha KS, Chung DH, Lee SM. Three-dimensional symmetry and parallelism of the skeletal and soft-tissue poria in patients with facial asymmetry. Korean J Orthod 2014;44:62-8. 10. Ackerman JL, Proffit WR, Sarver DM, Ackerman MB, Kean MR. Pitch, roll, and yaw: describing the spatial orientation of dentofacial traits. Am J Orthod Dentofacial Orthop 2007;131:305-10. 11. Kim JM. 3D rotational pattern of the dental arch and mandible in class III patients with facial asymmetry [PhD. dissertation]. Seoul: Dankook Uni versity; 2009. 12. Severt TR, Proffit WR. The prevalence of facial asymmetry in the dentofacial deformities population at the University of North Carolina. Int J Adult. 162. Orthodon Orthognath Surg 1997;12:171-6. 13. Baek SH, Cho IS, Chang YI, Kim MJ. Skeletodental factors affecting chin point deviation in female patients with class III malocclusion and facial asymmetry: a three-dimensional analysis using computed tomography. Oral Surg Oral Med Oral Pathol Oral Radiol Endod 2007;104:628-39. 14. H w a n g H S , H w a n g C H , L e e K H , Ka n g B C . Maxillofacial 3-dimensional image analysis for the diagnosis of facial asymmetry. Am J Orthod Dentofacial Orthop 2006;130:779-85. 15. Baek SH, Yang WS. A soft tissue analysis on facial esthetics of Korean young adults. Korean J Orthod 1991;21:131-70. 16. Baek C, Paeng JY, Lee JS, Hong J. Morphologic evaluation and classification of facial asymmetry using 3-dimensional computed tomography. J Oral Maxillofac Surg 2012;70:1161-9. 17. Maeda M, Katsumata A, Ariji Y, Muramatsu A, Yoshida K, Goto S, et al. 3D-CT evaluation of facial asymmetry in patients with maxillofacial deformities. Oral Surg Oral Med Oral Pathol Oral Radiol Endod 2006;102:382-90. 18. Haraguchi S, Takada K, Yasuda Y. Facial asymmetry in subjects with skeletal Class III deformity. Angle Orthod 2002;72:28-35. 19. Chebib FS, Chamma AM. Indices of craniofacial asymmetry. Angle Orthod 1981;51:214-26. 20. Adams GL, Gansky SA, Miller AJ, Harrell WE Jr, Hatcher DC. Comparison between traditional 2-dimensional cephalometry and a 3-dimensional approach on human dry skulls. Am J Orthod Dentofacial Orthop 2004;126:397-409. 21. Türp JC, Alt KW, Vach W, Harbich K. Mandibular condyles and rami are asymmetric structures. Cranio 1998;16:51-6. 22. El-Beialy AR, Fayed MS, El-Bialy AM, Mostafa YA. Accuracy and reliability of cone-beam computed tomography measurements: Influence of head orientation. Am J Orthod Dentofacial Orthop 2011;140:157-65. 23. Jacobson A. Radiographic cephalometry from basics to videoimaging. Carol Stream, IL: Quintessence Publishing; 1995. 24. Lascala CA, Panella J, Marques MM. Analysis of the accuracy of linear measurements obtained by cone beam computed tomography (CBCT-NewTom). Dentomaxillofac Radiol 2004;33:291-4. 25. Park JU, Kook YA, Kim Y. Assessment of asymmetry in a normal occlusion sample and asymmetric patients with three-dimensional cone beam computed tomography: a study for a transverse reference plane. Angle Orthod 2012;82:860-7. 26. Cho HJ. A three-dimensional cephalometric analysis.. http://dx.doi.org/10.4041/kjod.2015.45.4.153. www.e-kjo.org.
(11) Ryu et al • 3D evaluation on rotation patterns. J Clin Orthod 2009;43:235-52. 27. Kim SJ, Lee KJ, Lee SH, Baik HS. Morphologic relationship between the cranial base and the mandible in patients with facial asymmetry and mandibular prognathism. Am J Orthod Dentofacial Orthop 2013;144:330-40. 28. Hwang HS, Min YS, Lee SC, Sun MK, Lim HS.. www.e-kjo.org. http://dx.doi.org/10.4041/kjod.2015.45.4.153. Change of lip-line cant after 1-jaw orthognathic surgery in patients with mandibular asymmetry. Am J Orthod Dentofacial Orthop 2009;136:564-9. 29. Lee MS, Chung DH, Lee JW, Cha KS. Assessing soft-tissue characteristics of facial asymmetry with photographs. Am J Orthod Dentofacial Orthop 2010;138:23-31.. 163.
(12)
수치
+4

관련 문서
Occlusal contact patterns of digitalized casts articulated with six interocclusal records were compared to the occlusal contact of accurately articulated
The purpose of this study is to analyze the influence of dance leaders' inst ructional behavior patterns on participants' desire to participate and
Therefore, the aim of this study was to investigate the morphologic characteristics of the interalveolar foramen and to analyze according to sex and age using cone
The purpose of this study was to compare the microleakage of different adhesive systems (three 2-step adhesives and two 1-step adhesives) in class V
The purpose of this study is to examine the influence of PAPS essential evaluation factors by applying soccer programs to middle school students participating
The purpose of this study was to investigate evaluation questions in chemistry I of textbooks and college scholastic aptitude test(CSAT) by Bloom’s new
– It helps urban designers to be aware of local patterns of development and..
The purpose of this descriptive correlational study was to identify the factors affecting sleeping patterns among hospitalized elderly patients.. The findings
