pISSN 1976-1457 eISSN 2005-6168
Associations between dietary patterns and hypertension among Korean adults: the Korean National Health and Nutrition Examination Survey (2008-2010)
Ji-Ye Shin 1 , Ji-Myung Kim 2 and Yuri Kim 1§
1
Department of Nutritional Science and Food Management, Ewha Womans University, Daehyeon-dong, Seodaemun-gu, Seoul 120-750, Korea
2
Department of Food and Nutritional Sciences, Hanbuk University, Dongducheon 483-777, Korea
Abstract
The objective of this study is to identify the dietary patterns associated with the risk of hypertensions among Korean adults using data from the Korean National Health and Nutrition Examination Survey (KNHANES, 2008-2010). This study analyzes data from 11,883 subjects who participated in the health and nutrition survey, aging from 20 to 64 years. We performed factor analysis based on the weekly mean intake frequencies of 36 food groups to identify major dietary patterns. We identified three major dietary patterns in both sexes, namely “traditional”, “western” and “dairy and carbohydrate” patterns. Participants in the highest quartile of western pattern scores had significantly higher blood pressure, serum total cholesterol, and triglyceride levels than those in the lowest quartile. Although not statistically significant, a trend (P for trend = 0.0732) toward a positive association between the western dietary pattern and hypertension risk was observed after adjustments for age, sex, education, income, body mass index (BMI), smoking, physical activity, and energy intake. The dairy and carbohydrate pattern was inversely related with BMI and blood pressures and positively associated with serum high-density lipoprotein (HDL)-cholesterol. After adjusting the age, sex, education, income, BMI, smoking, physical activity and energy intake, the dairy and carbohydrate pattern showed inverse associations with hypertension prevalence (OR = 0.64, 95% CI = 0.55-0.75;
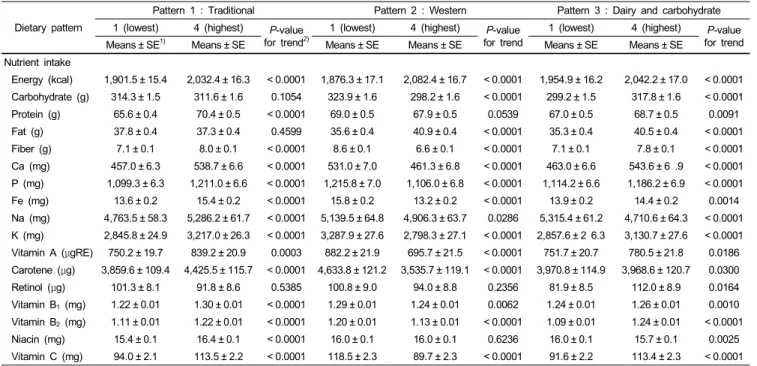
P for trend < 0.0001). Intakes of fiber, sodium, and antioxidant vitamins were significantly higher in the top quartile for the traditional pattern than in the lowest quartile for the traditional pattern (P for trend < 0.0001). Intakes of fiber (P for trend < 0.0001), calcium (P for trend < 0.0001), retinol (P for trend = 0.0164), vitamin B
1(P for trend = 0.001), vitamin B
2(P for trend < 0.0001), niacin (P for trend = 0.0025), and vitamin C (P for trend < 0.0001) were significantly increased across quartiles for the dairy and carbohydrate pattern whereas sodium (P for trend < 0.0001) intake was decreased for this pattern. In conclusion, the dairy and carbohydrate pattern may be associated with a reduced risk of hypertension whereas the western pattern may be associated with an increased risk of hypertension among Korean adults.
Key Words: Dietary pattern, Korean adults, hypertension, nutrient intake, odd ratio
Introduction 11)
Hypertension plays a major etiologic role in the development of ischemic heart disease, cerebrovascular disease, and cardiac and renal failure, and it is a significant risk factor for mortality and disability rates throughout the world [1-3]. The hypertension prevalence rate of Korean adults was 28.9% in the 2010 Korean National Health and Nutrition Examination Survey (KNHANES) [4]. Physical inactivity, obesity, smoking, a family history of hypertension, and an unhealthy diet may be contributing factors for the higher prevalence of hypertension [5,6]. Data on the association of dietary factors with the risk of hypertension have been accumulating [7,8].
A variety of studies have been implemented to explain the correlations between dietary patterns and cardiovascular diseases and hypertension [9-11]. High intakes of fruits, vegetables,
cereals, fishes, nuts, low-fat dairy products and poultry in addition to relatively low intakes of fat and sugars appeared to be effective in lowering blood pressures and hypertensions [12,13]. Furthermore, a dietary pattern with frequent intakes of fruits and dairy products significantly decreased blood pressure among Chinese [14]. On the other hand, it has been reported that the increased “western” dietary pattern is typically associated with the increased prevalence of chronic diseases such as coronary heart diseases [15], type 2 diabetes [16], cancer [17], and obesity [18] worldwide. The Dietary Approaches to Stop Hypertension (DASH) dietary pattern, which is rich in fruit, vegetables, and low-fat dairy products and limits saturated fat, red meat, and sweets is a success in hypertension control [19].
Since hypertension is a cardiovascular disease risk factor, several prospective cohort studies have shown associations between dietary patterns and CVD. A cohort study in Japan also demons-
This study was supported by the Ewha Global Top 5 Grant 2012 of Ewha Womans University.
§
Corresponding Author: Yuri Kim, Tel. 82-2-3277-4485, Fax. 82-2-3277-2862, Email. [email protected] Received: September 26, 2012, Revised: April 24, 2013, Accepted: April 25, 2013
ⓒ2013 The Korean Nutrition Society and the Korean Society of Community Nutrition
This is an Open Access article distributed under the terms of the Creative Commons Attribution Non-Commercial License (http://creativecommons.org/licenses/by-nc/3.0/)
which permits unrestricted non-commercial use, distribution, and reproduction in any medium, provided the original work is properly cited.
trates that a dietary pattern with high meat intakes was closely related to an increased risk of cardiovascular diseases [20].
Hypertension and dyslipidemia were the risk factors implicated in various cardiovascular events [21,22] and the association of hypertension and dyslipidaemia has been reported [21]. In several dietary pattern studies, dyslipidemia had been found to be associated with unhealthy dietary patterns [23,24]. To date, numerous studies have reported associations of dietary patterns with blood lipid profiles and/or blood pressures in various patient populations, including groups with cardiovascular disease, meta- bolic syndrome, and hypertension in Korea [23,25,26].
It has been reported that the typical consumptions of sodium is 3 times greater than the adequate amount of 1.5 g per day and the total fat intakes in Korea increased significantly from 7.2% of total calories in 1969 to 18.5% of total calories in 2007 with an increase in animal fat consumption [27]. Generally, a Korean dietary pattern rich in vegetables, particularly salted vegetables instead of fresh vegetables, may result in high prevalence of hypertension. However, none of the dietary patterns showed any statistical associations of these patterns with hypertension.
The aim of this study is to examine the associations between major dietary patterns and hypertension as well as related blood lipid profiles among the represented Korean adult population that participated in the 2008-2010 KNHANES.
Subjects and Methods
Study population and data sets
This study is based on data from the Korean National Health and Nutrition Examination Survey (KNHANES; 2008-2010) which was conducted by the Korea Ministry of Health and Welfare. The KNHANES was a nationwide representative study that consisted of three sections: a health and behavior interview, a health examination, and a dietary survey. A total of 29,235 individuals were selected for the health interview. A stratified, multi-staged probability sampling design was used in this survey, which has been described in detail previously [4]. Among the population, 12,234 subjects aged 20 to 64 years participated in the health examination survey and the dietary survey. We excluded those who had missing values in the food-frequency questionnaire (FFQ) and dietary intakes of more than 5,000 kcal or less than 500 kcal per day. Therefore, a total of 11,883 subjects were analyzed in the present study.
Assessment of general and anthropometric measurements Socio-demographic factors such as age, gender, education, income, and residence were collected using a self-reported general questionnaire. Body mass index (BMI) was calculated as weight (kg) divided by height (m) squared (kg/m
2). The smoking status and physical activity data were collected using health-related
questionnaires. The alcohol consumption data were collected using the FFQ. Blood pressure was measured three times with a phygmomanometer. Three measurements were made on subjects at 5-minutes intervals, and the average of the second and third blood pressure readings was used in the analysis. Investigators were trained to measure blood pressure and administer the questionnaire before conducting the survey. Blood samples were collected after fasting for at least 8 hours. Serum total cholesterol (TC), high-density lipoprotein (HDL)-cholesterol, low-density lipoprotein (LDL)-cholesterol, and triglycerides (TG) were analyzed by a certified laboratory.
Definition of hypertension
The information on hypertension was collected with the self-reported questionnaire only. We counted subjects as having hypertension only if they answered “yes” to the question “if a physician had diagnosed their blood pressure as being ≥140/90 mmHg (either systolic or diastolic)” or “if they reported using an antihypertensive medicine”.
Assessment of dietary patterns
The FFQ was used in the present study, and factor analysis was conducted to derive dietary patterns from the food consump- tion frequencies. According to the similarities in food nutrient profiles and culinary usage, the 63 food items in the FFQ were categorized into 36 food groups to reduce the complexity of the data (Table 1). This regrouping of food items was based on the previous study with modification, including a combination of beer and soju into “alcohol” and cake and bread into “bread”
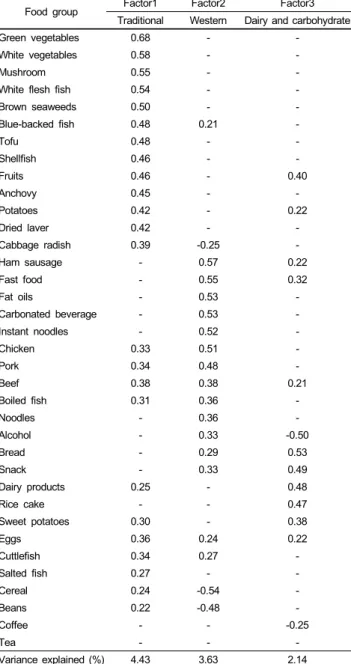
[11]. Principal component factor analysis was used to identify dietary patterns, with the factors rotated by orthogonal trans- formation. To determine the retained number of factors, we considered components with eigenvalue greater than 1.6 and scree plot results. Factor names reflecting the food groups have more than 0.20 loadings. Factor scores were categorized into quartiles according to the distribution of the study subjects.
Because the FFQ included only frequency of consumption and did not include portion sizes; nutrient intakes were analyzed using a 24-hour recall, which is the most appropriate method for estimating the mean intakes for groups.
Statistical methods
All statistical analyses were conducted using SAS (version 9.2;
SAS Institute, Cary, NC, USA). Dietary patterns based on the
36 food groups from the FFQ were identified with a principal
components analysis (eigenvalue > 1.6, varimax rotation) using
factor analysis. Mean levels of continuous variables were
estimated using the generalized linear model. The chi-square test
was used to compare proportions across the groups of categorical
variables. Logistic regression analysis was used to determine the
Food group Food items
Cereal Rice, barley
Rice cake Rice cake
Instant noodles Ramyun
Noodles Noodles
Bread Bread
Snack Snack
Tofu Tofu
Beans Beans, soy milk
Potatoes Potatoes
Sweet potatoes Sweet potatoes
Beef Beef
Chicken Chicken
Pork Pork
Ham sausage Ham sausage
Eggs Eggs
Blue-backed fish Mackerel, tuna White flesh fish Yellow fish, pollack
Anchovy Anchovy
Boiled fish Fish paste
Cuttlefish Squid
Shellfish Clam
Salted fish Salted fish
Cabbage radish Cabbage, radish
Green vegetables Spinach, cucumber, red pepper, carrot, pumpkin, dried radish greens
White vegetable Bean sprouts, cabbage
Mushroom Mushroom
Brown seaweeds Brown seaweeds
Dried laver Dried laver
Fruits Tomato, persimmon, pear, watermelon, strawberry, melon, citrus, peach, banana, grapes, apple Dairy products Milk, yoghourt, ice cream
Carbonated beverage Carbonated beverage
Coffee Coffee
Tea Tea
Alcohol Beer, soju, red wine
Fast food Hamburger, pizza
Fat oils Fat oils
Table 1. Food groups and food items used in dietary pattern analysis
Food group Factor1 Factor2 Factor3
Traditional Western Dairy and carbohydrate
Green vegetables 0.68 - -
White vegetables 0.58 - -
Mushroom 0.55 - -
White flesh fish 0.54 - -
Brown seaweeds 0.50 - -
Blue-backed fish 0.48 0.21 -
Tofu 0.48 - -
Shellfish 0.46 - -
Fruits 0.46 - 0.40
Anchovy 0.45 - -
Potatoes 0.42 - 0.22
Dried laver 0.42 - -
Cabbage radish 0.39 -0.25 -
Ham sausage - 0.57 0.22
Fast food - 0.55 0.32
Fat oils - 0.53 -
Carbonated beverage - 0.53 -
Instant noodles - 0.52 -
Chicken 0.33 0.51 -
Pork 0.34 0.48 -
Beef 0.38 0.38 0.21
Boiled fish 0.31 0.36 -
Noodles - 0.36 -
Alcohol - 0.33 -0.50
Bread - 0.29 0.53
Snack - 0.33 0.49
Dairy products 0.25 - 0.48
Rice cake - - 0.47
Sweet potatoes 0.30 - 0.38
Eggs 0.36 0.24 0.22
Cuttlefish 0.34 0.27 -
Salted fish 0.27 - -
Cereal 0.24 -0.54 -
Beans 0.22 -0.48 -
Coffee - - -0.25
Tea - - -
Variance explained (%) 4.43 3.63 2.14
Values are factor loading: absolute values < 0.20 are not shown for simplicity.
Table 2. Factor-loading matrix for 3 major dietary patterns identified by principal component analysis
association of dietary patterns with the risk of hypertension. The odds ratios (OR) were estimated for each quartile compared with the lowest quartile of each dietary pattern as the reference. Model 1 was adjusted according to age and sex. Model 2 was adjusted for education and income status in addition to the adjustments made in Model 1. Model 3 was adjusted for BMI, smoking status, physical activity, and energy intake in addition to the adjustments made in Model 2. All analyses were performed with P < 0.05 considered statistically significant.
Results
Dietary patterns
Using factor analysis, we first classified three major dietary
patterns among Korean adults. The factor-loading matrix for the dietary patterns identified in the study subjects is shown in Table 2. The first factor was characterized by tofu, beans, fruit, vegetables, and fishes, and was named the “traditional pattern”.
The “western pattern” (Factor 2) was characterized by high intakes of hams, sausages, fast foods, fats and oils, carbonated beverages, meats (pork, chicken, and beef), noodles, and alcohols and then negatively loaded with cereals and beans. Factor 3 was characterized by a high consumption of rice cakes, breads, snacks, sweet potatoes, and dairy products and a low consump- tion of alcohol, and it was named the “dairy and carbohydrate”
pattern.
Pattern 1 : Traditional Pattern 2 : Western Pattern 3 : Dairy and carbohydrate
Q1 Q4 P-value
oftrend
1)Q1 Q4 P-value
oftrend Q1 Q4 P-value
oftrend
N 2,970 2,971 2,970 2,971 2,970 2,971
Sex (%)
Male 35.4 38.6 0.0587 21.9 53.3 < 0.0001 67.5 18.1 < 0.0001
Female 64.7 61.4 78.1 46.7 32.5 81.9
Age (yrs)
2)Age 42.7 ± 12.9 43.0 ± 11.1 0.0055 51.5 ± 9.5 34.7 ± 9.4 < 0.0001 46.2 ± 10.6 38.4 ± 11.6 < 0.0001 Education (%)
Middle school or less 34.9 20.4 < 0.0001 50.7 8.5 < 0.0001 36.3 12.6 < 0.0001
High school graduation 35.9 43.9 31.3 46.7 39.2 40.8
College or more 29.2 35.7 18.1 44.9 24.6 46.7
Income (%)
Low 18.9 6.9 < 0.0001 15.7 8.0 < 0.0001 13.6 7.4 < 0.0001
Mid-low 28.9 21.7 27.7 24.0 27.3 23.1
Mid-high 28.9 32.1 27.2 33.9 30.5 31.6
High 23.4 39.4 29.4 34.0 28.6 37.9
BMI (%)
< 18.5 6.2 4.7 0.0003 2.4 6.5 < 0.0001 3.4 7.2 < 0.0001
18.5-25 63.3 64.9 65.2 65.3 60.0 71.3
25 ≤ 30.5 30.4 32.5 28.2 36.7 21.5
Smoking status (%)
Never 65.5 63.5 0.1361 81.1 48.3 < 0.0001 35.5 81.3 < 0.0001
Former 12.1 13.4 10.5 14.0 18.7 9.3
Current 22.5 23.1 8.5 37.7 45.8 9.4
Physical activity (%)
Yes 85.5 91.7 < 0.0001 82.9 94.4 < 0.0001 90.1 91.0 < 0.0001
No 14.5 8.3 17.1 5.7 9.9 9.0
Residence (%)
Urban 62.8 71.3 < 0.0001 63.4 71.9 < 0.0001 60.6 75.4 < 0.0001
Rural 37.2 28.7 36.6 28.1 39.4 24.6
1)
By chi-square test.
2)
Means ± SD, P from general linear regression for continuous variable.
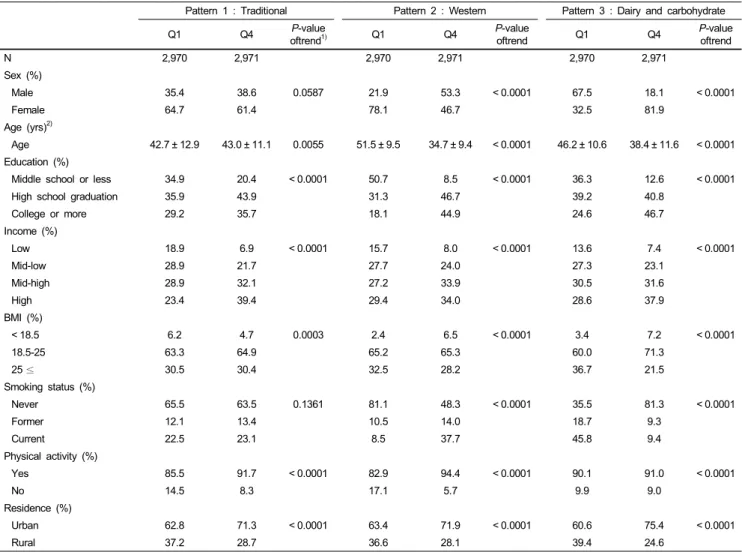
Table 3. General characteristics of the subjects by dietary patterns
General characteristics of the subjects by dietary patterns Table 3 shows the general characteristics of all the subjects according to the three dietary patterns. Subjects with higher traditional pattern scores were older and had higher education, higher income, and higher physical activity levels than those with a lower traditional pattern scores. Subjects with higher western pattern scores were more likely to be males, younger, current smokers, and more physically-active than the group with the lower western pattern score. Participants with higher dairy and carbohydrate pattern scores were more likely females with a higher education. Subjects with higher western pattern scores in all three groups tended to live in urban areas rather than in rural areas.
Mean blood pressure and blood profiles across quartiles of dietary patterns
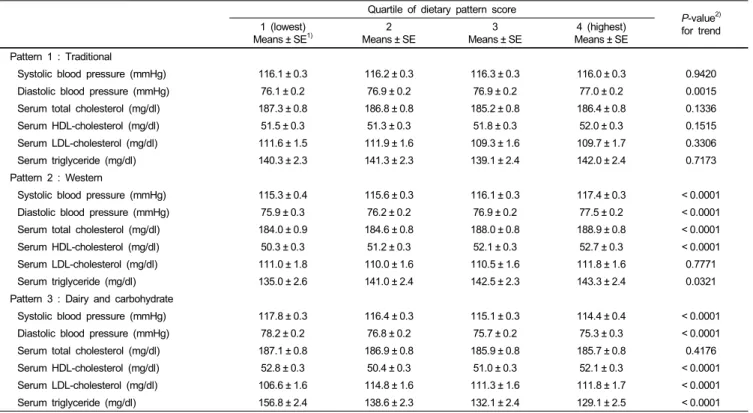
Table 4 shows mean blood pressure and blood profiles
according to the quartile for each dietary pattern. The adjusted mean diastolic blood pressure (DBP) increased accordingly to the quartile in the traditional pattern. Compared with subjects in the lowest quartile, subjects in the highest quartile of the traditional pattern showed higher DBP (P for trend = 0.0015).
The adjusted mean systolic blood pressure (SBP), DBP, TC, HDL-cholesterol, and TG levels were increased according to the quartile in the western pattern. Subjects in the highest quartile of the western dietary pattern had higher SBP (P for trend <
0.0001), higher DBP (P for trend < 0.0001), higher TC (P for
trend < 0.0001), higher HDL (P for trend < 0.0001), and higher
TG (P for trend = 0.0321) compared with participants in the
lowest quartile. For the dairy and carbohydrate pattern, the
adjusted mean SBP, DBP, HDL, and TG value were decreased
with the quartile, but the adjusted mean serum LDL-cholesterol
value increased with the quartile. Compared with participants in
the lowest quartile of the diary and carbohydrate pattern, those
in the highest quartile had lower SBP (P for trend < 0.0001),
Quartile of dietary pattern score
P-value
2)for trend 1 (lowest)
Means ± SE
1)2
Means ± SE 3
Means ± SE 4 (highest)
Means ± SE Pattern 1 : Traditional
Systolic blood pressure (mmHg) 116.1 ± 0.3 116.2 ± 0.3 116.3 ± 0.3 116.0 ± 0.3 0.9420
Diastolic blood pressure (mmHg) 76.1 ± 0.2 76.9 ± 0.2 76.9 ± 0.2 77.0 ± 0.2 0.0015
Serum total cholesterol (mg/dl) 187.3 ± 0.8 186.8 ± 0.8 185.2 ± 0.8 186.4 ± 0.8 0.1336
Serum HDL-cholesterol (mg/dl) 51.5 ± 0.3 51.3 ± 0.3 51.8 ± 0.3 52.0 ± 0.3 0.1515
Serum LDL-cholesterol (mg/dl) 111.6 ± 1.5 111.9 ± 1.6 109.3 ± 1.6 109.7 ± 1.7 0.3306
Serum triglyceride (mg/dl) 140.3 ± 2.3 141.3 ± 2.3 139.1 ± 2.4 142.0 ± 2.4 0.7173
Pattern 2 : Western
Systolic blood pressure (mmHg) 115.3 ± 0.4 115.6 ± 0.3 116.1 ± 0.3 117.4 ± 0.3 < 0.0001
Diastolic blood pressure (mmHg) 75.9 ± 0.3 76.2 ± 0.2 76.9 ± 0.2 77.5 ± 0.2 < 0.0001
Serum total cholesterol (mg/dl) 184.0 ± 0.9 184.6 ± 0.8 188.0 ± 0.8 188.9 ± 0.8 < 0.0001
Serum HDL-cholesterol (mg/dl) 50.3 ± 0.3 51.2 ± 0.3 52.1 ± 0.3 52.7 ± 0.3 < 0.0001
Serum LDL-cholesterol (mg/dl) 111.0 ± 1.8 110.0 ± 1.6 110.5 ± 1.6 111.8 ± 1.6 0.7771
Serum triglyceride (mg/dl) 135.0 ± 2.6 141.0 ± 2.4 142.5 ± 2.3 143.3 ± 2.4 0.0321
Pattern 3 : Dairy and carbohydrate
Systolic blood pressure (mmHg) 117.8 ± 0.3 116.4 ± 0.3 115.1 ± 0.3 114.4 ± 0.4 < 0.0001
Diastolic blood pressure (mmHg) 78.2 ± 0.2 76.8 ± 0.2 75.7 ± 0.2 75.3 ± 0.3 < 0.0001
Serum total cholesterol (mg/dl) 187.1 ± 0.8 186.9 ± 0.8 185.9 ± 0.8 185.7 ± 0.8 0.4176
Serum HDL-cholesterol (mg/dl) 52.8 ± 0.3 50.4 ± 0.3 51.0 ± 0.3 52.1 ± 0.3 < 0.0001
Serum LDL-cholesterol (mg/dl) 106.6 ± 1.6 114.8 ± 1.6 111.3 ± 1.6 111.8 ± 1.7 < 0.0001
Serum triglyceride (mg/dl) 156.8 ± 2.4 138.6 ± 2.3 132.1 ± 2.4 129.1 ± 2.5 < 0.0001
1)
Adjusted means for age sex, education, income, smoking, physical activity, energy intake.
2)
By general linear regression.
Table 4. Blood pressure and blood profiles according to the quartiles of factor score for each dietary pattern
Dietary pattern
Quartile of dietary pattern scores
P-value for trend
1 (lowest) 2 3 4 (highest)
OR (95% CI)
1)OR (95% CI) OR (95% CI)
Pattern 1 : Traditional
NO. of case 692 715 701 648
Model 1
2)1.0 (ref.) 1.00 (0.87-1.14) 0.99 (0.87-1.13) 0.92 (0.81-1.05) 0.6079
Model 2
3)1.0 (ref.) 1.03 (0.90-1.18) 1.04 (0.91-1.19) 0.99 (0.86-1.13) 0.8436
Model 3
4)1.0 (ref.) 1.04 (0.90-1.19) 1.05 (0.92-1.21) 0.99 (0.86-1.14) 0.8117
Pattern 2 : Western
NO. of case 949 765 585 457
Model 1 1.0 (ref.) 1.01 (0.89-1.15) 1.03 (0.89-1.18) 1.18 (1.01-1.39) 0.1634
Model 2 1.0 (ref.) 1.02 (0.90-1.15) 1.05 (0.91-1.21) 1.20 (1.02-1.41) 0.1416
Model 3 1.0 (ref.) 1.01 (0.89-1.15) 1.07 (0.92-1.23) 1.24 (1.04-1.46) 0.0732
Pattern 3 : Dairy and carbohydrate
NO. of case 984 791 608 373
Model 1 1.0 (ref.) 0.89 (0.79-1.01) 0.76 (0.67-0.87) 0.60 (0.52-0.70) < 0.0001
Model 2 1.0 (ref.) 0.91 (0.80-1.03) 0.78 (0.69-0.90) 0.64 (0.55-0.75) < 0.0001
Model 3 1.0 (ref.) 0.85 (0.74-0.96) 0.76 (0.66-0.88) 0.64 (0.55-0.75) < 0.0001
1)
By logistic regression.
2)
Model 1: Adjusted for age, sex.
3)
Model 2: Adjusted for age, sex, education, income.
4)
Model 3: Adjusted for age, sex, education, income, BMI, smoking, physical activity, energy intake.
Table 5. Odds ratios for hypertension based on scores for dietary patterns
lower DBP (P for trend < 0.0001), lower HDL (P for trend <
0.0001), lower TG (P for trend < 0.0001), and higher LDL (P for trend < 0.0001).
Association of each dietary pattern with hypertension
Table 5 presents the association of each dietary pattern with
hypertension. A significant relationship between hypertension
Dietary pattern
Pattern 1 : Traditional Pattern 2 : Western Pattern 3 : Dairy and carbohydrate
1 (lowest) 4 (highest) P-value for trend
2)1 (lowest) 4 (highest) P-value for trend
1 (lowest) 4 (highest) P-value for trend
Means ± SE
1)Means ± SE Means ± SE Means ± SE Means ± SE Means ± SE
Nutrient intake
Energy (kcal) 1,901.5 ± 15.4 2,032.4 ± 16.3 < 0.0001 1,876.3 ± 17.1 2,082.4 ± 16.7 < 0.0001 1,954.9 ± 16.2 2,042.2 ± 17.0 < 0.0001 Carbohydrate (g) 314.3 ± 1.5 311.6 ± 1.6 0.1054 323.9 ± 1.6 298.2 ± 1.6 < 0.0001 299.2 ± 1.5 317.8 ± 1.6 < 0.0001 Protein (g) 65.6 ± 0.4 70.4 ± 0.5 < 0.0001 69.0 ± 0.5 67.9 ± 0.5 0.0539 67.0 ± 0.5 68.7 ± 0.5 0.0091 Fat (g) 37.8 ± 0.4 37.3 ± 0.4 0.4599 35.6 ± 0.4 40.9 ± 0.4 < 0.0001 35.3 ± 0.4 40.5 ± 0.4 < 0.0001 Fiber (g) 7.1 ± 0.1 8.0 ± 0.1 < 0.0001 8.6 ± 0.1 6.6 ± 0.1 < 0.0001 7.1 ± 0.1 7.8 ± 0.1 < 0.0001 Ca (mg) 457.0 ± 6.3 538.7 ± 6.6 < 0.0001 531.0 ± 7.0 461.3 ± 6.8 < 0.0001 463.0 ± 6.6 543.6 ± 6 .9 < 0.0001 P (mg) 1,099.3 ± 6.3 1,211.0 ± 6.6 < 0.0001 1,215.8 ± 7.0 1,106.0 ± 6.8 < 0.0001 1,114.2 ± 6.6 1,186.2 ± 6.9 < 0.0001 Fe (mg) 13.6 ± 0.2 15.4 ± 0.2 < 0.0001 15.8 ± 0.2 13.2 ± 0.2 < 0.0001 13.9 ± 0.2 14.4 ± 0.2 0.0014 Na (mg) 4,763.5 ± 58.3 5,286.2 ± 61.7 < 0.0001 5,139.5 ± 64.8 4,906.3 ± 63.7 0.0286 5,315.4 ± 61.2 4,710.6 ± 64.3 < 0.0001 K (mg) 2,845.8 ± 24.9 3,217.0 ± 26.3 < 0.0001 3,287.9 ± 27.6 2,798.3 ± 27.1 < 0.0001 2,857.6 ± 2 6.3 3,130.7 ± 27.6 < 0.0001 Vitamin A (μgRE) 750.2 ± 19.7 839.2 ± 20.9 0.0003 882.2 ± 21.9 695.7 ± 21.5 < 0.0001 751.7 ± 20.7 780.5 ± 21.8 0.0186 Carotene (μg) 3,859.6 ± 109.4 4,425.5 ± 115.7 < 0.0001 4,633.8 ± 121.2 3,535.7 ± 119.1 < 0.0001 3,970.8 ± 114.9 3,968.6 ± 120.7 0.0300
Retinol (μg) 101.3 ± 8.1 91.8 ± 8.6 0.5385 100.8 ± 9.0 94.0 ± 8.8 0.2356 81.9 ± 8.5 112.0 ± 8.9 0.0164
Vitamin B
1(mg) 1.22 ± 0.01 1.30 ± 0.01 < 0.0001 1.29 ± 0.01 1.24 ± 0.01 0.0062 1.24 ± 0.01 1.26 ± 0.01 0.0010 Vitamin B
2(mg) 1.11 ± 0.01 1.22 ± 0.01 < 0.0001 1.20 ± 0.01 1.13 ± 0.01 < 0.0001 1.09 ± 0.01 1.24 ± 0.01 < 0.0001 Niacin (mg) 15.4 ± 0.1 16.4 ± 0.1 < 0.0001 16.0 ± 0.1 16.0 ± 0.1 0.6236 16.0 ± 0.1 15.7 ± 0.1 0.0025 Vitamin C (mg) 94.0 ± 2.1 113.5 ± 2.2 < 0.0001 118.5 ± 2.3 89.7 ± 2.3 < 0.0001 91.6 ± 2.2 113.4 ± 2.3 < 0.0001
1)
Adjusted means for age, sex, education, income, smoking, physical activity, and energy intake.
2)