Dietary patterns of children and adolescents analyzed from 2001 Korea National Health and Nutrition Survey
Joung-Won Lee 1§ , Jiyoung Hwang 1 and Han-Sok Cho 2
1
Department of Consumers’ Life Science, Chungnam National University, Daejeon, Korea
2
Legal and Statistics Affairs, The Province of Chungcheongnam-do, Daejeon, Korea
Received May 2, 2007; Revised May 31, 2007; Accepted June 19, 2007
Abstract
The purpose of this study was to identify dietary patterns among children and adolescents in Korea and to examine their associations with obesity and some blood profiles. One day food consumption data measured by 24-hour recalls on 2704 subjects aged 1 to 19 were used from 2001 Korea National Health and Nutrition Survey. The data of blood profiles available in the ages of 10 or older was also used. After categorizing each food consumed into 29 food or food groups, five dietary patterns were derived through a factor analysis and subjects were classified into three major dietary patterns via a cluster analysis using the factor scores. Three dietary patterns were identified as ‘traditional diet’ (25.6%), ‘westernized-fast food’ (6.2%), and ‘mixed diet’ (68.2%). The ‘traditional diet’ pattern had a higher percentage in boys. Both the ‘traditional diet’ and the ‘westernized-fast food’ had higher proportions of adolescents (12-19 y) than younger children, while the ‘mixed diet’ had a higher percentage of preschool children (1-5 y). Obesity rate analyzed within each age group showed no differences among 3 dietary pattern clusters. Blood pressure and all plasma profiles were not different among dietary patterns when adjusted with age and gender. Conclusively, children and adolescents in Korea had three distinct dietary patterns, which were associated with gender and age. These patterns could be useful to plan nutrition interventions for teenager health promotion.
Key Words: Dietary pattern, factorial and cluster analysis, 2001 Korea National Health and Nutrition Survey, blood profiles
Introduction 2)
There has been increasing interest in analyzing dietary factors associated with obesity and chronic degenerative diseases in view of dietary patterns, rather than a single nutrient, food, or a group of foods (Hu, 2002; Kant, 2004; Randall et al., 1990; Randall et al., 1992). People consume foods as meals which are the combination of various foods and nutrients, not as an independent nutrient or food. Moreover, roles of non-nutrients, such as phytochemicals contained in plant foods have emerged to be relevant to chronic disease risk (Craig, 1997). Thus assessment of the food intakes as a whole through identifying dietary patterns may allow us to have inclusive and practical information for research on diet and health, and for developing dietary guidelines to prevent diseases. There were many studies that identified major dietary patterns and determined their relationships with nutritional adequacy or with obesity and disease risks (Beaudry et al., 1998; Fung et al., 2001; Hu et al., 1999; Hu et al., 2000;
Randall et al., 1992). Dietary pattern analyses were also reported in Korea for middle school students, adults, and college women by a few studies (Song et al., 2005; Song et al., 2006; Yoo et al., 2004).
Korean children and adolescents were reported to have various
dietary and nutritional problems threatening health such as imbalance of foods and nutrients intake, obesity, high blood pressure and hyperlipidemia (Kim et al., 2001; Lee & La, 1996;
Ministry of Health and Welfare, 2002; Park et al., 2000).
Comprehensive studies on dietary patterns of children and adolescents may provide useful information to improve these problems. Accordingly, this study aims at identifying dietary patterns of children and adolescents and to examine their associations with obesity and disease risk through the use of 2001 Korea National Health and Nutrition Survey data.
Subjects and Methods
Subjects and data used
This study targeted 2,704 children and adolescents aged 1 to 19 who participated in the 2001 Korea National Health and Nutrition Survey (KNHNS). Among 2,982 children and adoles- cents 278 whose anthropometric data were not available were excluded.
From 2001 KNHNS conducted between November and December 2001, anthropometric and biochemical data, and food
§
Corresponding Author: Joung-Won Lee, Tel. 82-42-821-6844, Fax. 82-42-821-8887, Email. [email protected]
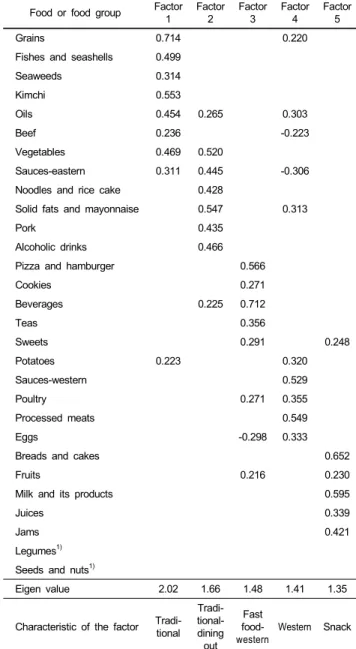
Table 1. Factor-loading matrix for the 5 major factors Food or food group Factor
1
Factor 2
Factor 3
Factor 4
Factor 5
Grains 0.714 0.220
Fishes and seashells 0.499
Seaweeds 0.314
Kimchi 0.553
Oils 0.454 0.265 0.303
Beef 0.236 -0.223
Vegetables 0.469 0.520
Sauces-eastern 0.311 0.445 -0.306
Noodles and rice cake 0.428
Solid fats and mayonnaise 0.547 0.313
Pork 0.435
Alcoholic drinks 0.466
Pizza and hamburger 0.566
Cookies 0.271
Beverages 0.225 0.712
Teas 0.356
Sweets 0.291 0.248
Potatoes 0.223 0.320
Sauces-western 0.529
Poultry 0.271 0.355
Processed meats 0.549
Eggs -0.298 0.333
Breads and cakes 0.652
Fruits 0.216 0.230
Milk and its products 0.595
Juices 0.339
Jams 0.421
Legumes
1)Seeds and nuts
1)Eigen value 2.02 1.66 1.48 1.41 1.35
Characteristic of the factor Tradi- tional
Tradi- tional- dining out
Fast food-
western Western Snack
1)
Absolute values less than 0.20 were not listed in the table.
consumption data were used. One weekday food intake was surveyed using 24-hour recalls. Trained dietitians visited each household and interviewed family members individually to determine food intake amounts. Supplementary tools such as food models and two-dimensional sizes of food volumes and containers were used to help recall. Food portions were converted into weight according to the standard estimators.
Dietary pattern analysis
For a factor analysis to generate dietary patterns, foods from the data of 2001 KNHNS were classified into 29 food or food groups on the basis of 18 food groups used in Korean food composition table (Office of Rural Development, 2001) and in reflection of food habit characteristics of children and ado- lescents. Cereals were divided into three categories, that is, grains including wheat flour, noodles and rice cakes, and breads and cakes. Meats were divided into four categories - beef, pork, poultry, and processed meat. Foods whose classifications were not clear or that were the distinctive food behaviors to children and adolescents were independently dealt with. They were kimchi, pizza, hamburger, beverages, tea, jams, and juice.
Western sauces category included salad dressings, curry sauce, tomato ketchup, hot sauce, spaghetti sauce, worcester sauce, etc.
A factor analysis (principal components) was carried out using the intake frequencies of 29 food or food groups, and factor scores were rotated by using Varimax rotation. The factors were extracted on the basis of 1 or higher Eigen value, Scree test, and interpretation possibility. To identify the characteristics of the factors, the collection of food groups with at least 0.2 of absolute value of factor loading was used (Hu et al., 2001; Yoo et al., 2004). A cluster analysis was performed with five factor scores of the subjects calculated at the factor analysis, and through the Ward method subjects were grouped into three clusters of dietary patterns.
Obese and plasma lipid indices
Obese index was calculated from relative body weight, that is, the percentage against standard body weight. As standard body weight, the 50
thpercentile of body weight for height in the 1998 Korean children's growth standards was used (The Korean Pediatric Society, 1998). Relative body weight less than 80 was classified as underweight, from 80 to 119.9 as normal, and 120 or more as obesity (Back & Yeo, 2006; Ministry of Health &
Welfare, 2002).
From plasma lipid concentrations determined in the subjects aged 10 or older in the 2001 KNHNS, LDL-cholesterol, VLDL- cholesterol, ratio of LDL-cholesterol/HDL-cholesterol and athe- rogenic index (AI) were computed as follows: VLDL-choles- terol= TG/5; LDL-cholesterol= (Total cholesterol-HDL-chole- sterol-VLDL-cholesterol); AI= (Total cholesterol-HDL-chole- sterol)/HDL-cholesterol.
Statistical analysis
All the data was analyzed through the SAS program. Frequency (%), mean, and standard deviation were computed and cross- tabulation and chi-square test, general linear model and Duncan's multiple range test, factor and cluster analysis were performed.
Results
Dietary patterns
The five major factors were extracted through factor analyses
using 29 food or food groups as presented in Table 1. Factor
Table 2. Classification of subjects by cluster analysis using factor score
Factor Cluster 1
(n=691: 25.6%)
1)Cluster 2 (n=168: 6.2%)
Cluster 3 (n=1,845: 68.2%) Factor 1*** 1.22 ± 0.85
2)c-0.30 ± 1.27
b-0.43 ± 0.55
aFactor 2*** 0.31 ± 1.08
b0.96 ± 2.38
c-0.20 ± 0.59
aFactor 3*** -0.18 ± 0.66
a2.74 ± 1.98
b-0.18 ± 0.47
aFactor 4*** -0.09 ± 1.22
a1.17 ± 1.92
b-0.07 ± 0.67
aFactor 5*** 0.14 ± 1.13
b0.07 ± 1.45
a-0.06 ± 0.89
aDiet pattern of
cluster Traditional diet Westernized-
fast food Mixed diet
1)
Subject number and percent of total subject number, 2704.
2)
Mean ± SD.
*** p<0.001 by Generalized linear model.
abc
Values with different superscripts in the same row were significantly different by Duncan's multiple range test at p<0.05.
Table 3. Gender and age distribution by dietary pattern groups Total
(n=2704) Traditional (n=691)
Westernized- fast food
(n=168)
Mixed (n=1845) p
2)Gender Male 1429 (52.8)
1)427 (61.8) 69 (53.0) 913 (49.5) p<0.001 Female 1275 (47.2) 264 (38.2) 79 (47.0) 932 (50.5) Age (year) 1-5 707 (26.1) 50 (7.2) 15 (8.9) 642 (34.8) p<0.001
6-11 1054 (39.0) 266 (38.5) 61 (36.3) 727 (39.4) 12-19 943 (34.9) 375 (54.3) 92 (54.8) 476 (25.8)
1)
n(%).
2)
p value by chi-square test.
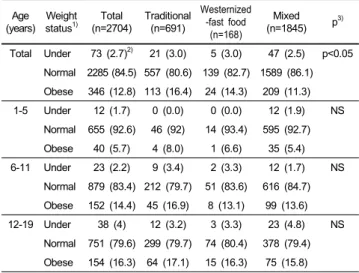
Table 4. Body weight status distribution by dietary pattern groups Age
(years) Weight status
1)Total
(n=2704) Traditional (n=691)
Westernized -fast food
(n=168)
Mixed (n=1845) p
3)Total Under 73 (2.7)
2)21 (3.0) 5 (3.0) 47 (2.5) p<0.05 Normal 2285 (84.5) 557 (80.6) 139 (82.7) 1589 (86.1) Obese 346 (12.8) 113 (16.4) 24 (14.3) 209 (11.3)
1-5 Under 12 (1.7) 0 (0.0) 0 (0.0) 12 (1.9) NS
Normal 655 (92.6) 46 (92) 14 (93.4) 595 (92.7) Obese 40 (5.7) 4 (8.0) 1 (6.6) 35 (5.4) 6-11 Under 23 (2.2) 9 (3.4) 2 (3.3) 12 (1.7) NS
Normal 879 (83.4) 212 (79.7) 51 (83.6) 616 (84.7) Obese 152 (14.4) 45 (16.9) 8 (13.1) 99 (13.6)
12-19 Under 38 (4) 12 (3.2) 3 (3.3) 23 (4.8) NS
Normal 751 (79.6) 299 (79.7) 74 (80.4) 378 (79.4) Obese 154 (16.3) 64 (17.1) 15 (16.3) 75 (15.8)
1)
Under: relative body weight<80.
Normal: 80≤relative body weight<120.
Obese: relative body weight≥120.
2)
n(%).
3)
p value by chi-square test.
1 which had the highest eigen value was characterized as a
‘traditional diet’ since it showed higher factor loading values in grains which include rice, kimchi, fish and shellfish, beef, vegetables, seaweeds, oils and oriental sauces. Factor 2 was characterized as a ‘traditional-dining out’ pattern with intake of
pork, vegetables, noodles, eastern sauce, oils and alcoholic drinks. Factor 3 was the pattern with intake of pizza and hamburger, poultry, beverages, cookies, sweets and teas, and was distinctive to be a ‘fast food-western’. Factor 4 had characteristics of a ‘western diet’ with higher factor loading values of eggs, poultry, potatoes, processed meat, western sauce, solid fats and mayonnaise. Factor 5 showed higher factor loadings in milk and dairy products, breads and cakes, juices, jams, and fruits, and was characterized as ‘snack’ pattern.
A cluster analysis based on the five factors derived three clusters that formed 25.6% (n=691), 6.2% (n=168), and 68.2%
(n=1845) of total subjects, respectively. Factor scores of 3 clusters were presented in Table 2. Cluster 1 had characteristics of Korean traditional pattern of food use with the highest score for factor 1 (traditional) and was identified as the ‘traditional diet’ pattern. The second largest number (25.6%) of children and adolescents belonged to this cluster. Cluster 2 was labeled as the ‘westernized-fast food’ pattern with remarkably high scores for the factor 3 (fast food-western) and factor 4 (western). Only 6.8% of the subjects belonged to the ‘westernized-fast food’
group. Meanwhile, the largest number of the subjects (68.2%) belonged to cluster 3, but there were no higher scores for any factors so that no noticeable features were found. Accordingly cluster 3 was named as a ‘mixed diet’ pattern.
Age and gender distribution of dietary patterns
Gender and age distributions of 3 dietary pattern groups were presented in Table 3. The ‘traditional diet’ pattern had a very higher percentage in boys (61.8%) than in girls (p<0.001), while the ‘westernized-fast food’ group showed a little bit higher percent in boys (53.0%) than in girls (47.0%). The ‘mixed diet’
group showed similar ratios between boys and girls.
Both the ‘traditional diet’ and the ‘westernized-fast food’
patterns had higher proportions of adolescents aged 12 to 19 (54.3% and 54.8%, respectively) than preschool (1-5 y) and school (6-11 y) children, while the ‘mixed diet’ pattern had a higher percentage of preschool children, compared with other two patterns (p<0.001).
Dietary patterns and obesity rate and plasma profiles
As shown in Table 4, there were differences as to obesity rate
within each dietary pattern group (p<0.05). The ‘traditional diet'
group had the highest obesity rate of 16.4%, while the ‘mixed
diet’ pattern had the lowest at 11.3%. In the ‘westernized-fast
food’ pattern, obesity rate was 14.3%, which was higher than
total obesity rate of 12.8%. Percents of underweight were similar
among three dietary patterns. However when the association was
analyzed within each age group, significant differences had not
appeared in all 3 age groups though the ‘traditional diet’ tended
to have higher obesity rates than other two patterns, particularly
in school children.
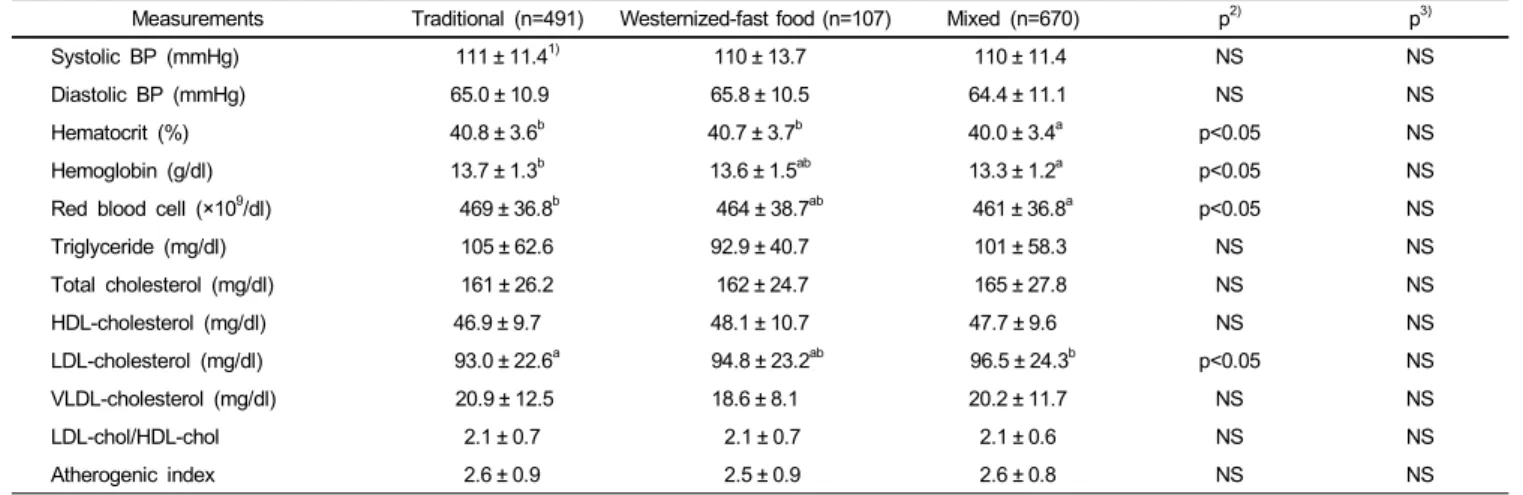
Table 5. Blood pressure and plasma profiles by dietary patterns
Measurements Traditional (n=491) Westernized-fast food (n=107) Mixed (n=670) p
2)p
3)Systolic BP (mmHg) 111 ± 11.4
1)110 ± 13.7 110 ± 11.4 NS NS
Diastolic BP (mmHg) 65.0 ± 10.9 65.8 ± 10.5 64.4 ± 11.1 NS NS
Hematocrit (%) 40.8 ± 3.6
b40.7 ± 3.7
b40.0 ± 3.4
ap<0.05 NS
Hemoglobin (g/dl) 13.7 ± 1.3
b13.6 ± 1.5
ab13.3 ± 1.2
ap<0.05 NS
Red blood cell (×10
9/dl) 469 ± 36.8
b464 ± 38.7
ab461 ± 36.8
ap<0.05 NS
Triglyceride (mg/dl) 105 ± 62.6 92.9 ± 40.7 101 ± 58.3 NS NS
Total cholesterol (mg/dl) 161 ± 26.2 162 ± 24.7 165 ± 27.8 NS NS
HDL-cholesterol (mg/dl) 46.9 ± 9.7 48.1 ± 10.7 47.7 ± 9.6 NS NS
LDL-cholesterol (mg/dl) 93.0 ± 22.6
a94.8 ± 23.2
ab96.5 ± 24.3
bp<0.05 NS
VLDL-cholesterol (mg/dl) 20.9 ± 12.5 18.6 ± 8.1 20.2 ± 11.7 NS NS
LDL-chol/HDL-chol 2.1 ± 0.7 2.1 ± 0.7 2.1 ± 0.6 NS NS
Atherogenic index 2.6 ± 0.9 2.5 ± 0.9 2.6 ± 0.8 NS NS
BP: blood pressure.
1)
Mean ± SD.
2)
p value by Generalized linear model.
3)
p value by ANCOVA with covariates of age and gender.
abc