Copyright © 2019 The Korean Society for Bone and Mineral Research
This is an Open Access article distributed under the terms of the Creative Commons Attribution Non-Commercial Li- cense (http://creativecommons.org/licenses/by-nc/4.0/) which permits unrestricted non-commercial use, distribu- tion, and reproduction in any medium, provided the original work is properly cited.
Associations between Dietary Fiber Intake and Bone Mineral Density in Adult Korean Population:
Analysis of National Health and Nutrition Examination Survey in 2011
Taehoon Lee, Heuy Sun Suh
Department of Family Medicine, Gachon University Gil Medical Center, Gachon University School of Medicine, Incheon, Korea
Background: The correlations between the amount of daily fiber intake and bone min- eral densities (BMDs) in Korean adult population were investigated in our study. Meth- ods: Utilizing the Korean National Health and Nutrition Examination Survey in 2011, multivariable linear regression was performed to explore the association between fiber consumption and BMD of lumbar vertebrae 1 to 4 (L1-4 total), L1, L2, L3, and L4 verte- brae, femur neck, femur total, and trochanter. All models were adjusted for age, body mass index, vitamin D level, smoking, physical activity, alcohol use, contraceptive use, hormonal replacement therapy, consumption of carbohydrate, protein, fat, calcium, phosphate, iron, thiamine, riboflavin, niacin, and vitamin C. Results: In males aged be- tween 18 and 45, fiber intake significantly increased BMDs of L1 (coefficient β=0.004, P=0.040) and L2 (β=0.004, P=0.038) while daily protein consumption significantly low- ered BMDs of femur neck (β=-0.001, P=0.009), femur total (β=-0.001, P=0.008), and trochanter (β=-0.001, P=0.008). In males aged 65 and older, nutrient intake shows no significant correlations with BMDs except fat consumption was inversely associated with BMD of trochanter (β=-0.001, P=0.017). In females aged between 18 and 45, fiber in- take shows no significant relationship with BMDs while daily fat consumption signifi- cantly increased BMDs of L1 (β=0.001, P=0.028), L2 (β=0.001, P=0.024), L3 (β=0.001, P=0.033), and L1-4 total (β=0.001, P=0.017). Conclusions: Fiber intake was a protec- tive factor of lumbar spine (L1 and L2) BMD in male aged between 18 and 45 but not in female participants of any age groups.
Key Words: Bone density · Dietary fiber · Nutrition surveys · Osteoporosis
INTRODUCTION
Osteoporosis is a common yet debilitating disease that can increase the risk of bone fracture and mortality rate and may result in significant epidemiologic and economic burden in South Korea, as the aging population in South Korea is on the rise.[1,2] While vitamin D and calcium were considered to be the main nutri- ents for prevention of osteoporosis, the role of fiber consumption with respect to bone health has been controversial.[3] Moreover, population-based epidemiolog- ical or experimental studies exploring the association between dietary fiber con- Corresponding author
Heuy Sun Suh
Department of Family Medicine, Gachon University Gil Medical Center, 21 Namdong- daero 774 beon-gil, Namdong-gu, Incheon 21656, Korea
Tel: +82-32-460-2735 Fax: +82-32-460-3354 E-mail: [email protected] Received: May 9, 2019 Revised: July 5, 2019 Accepted: July 21, 2019
Original Article
pISSN 2287-6375 eISSN 2287-7029
sumption and bone mineral density (BMD), particularly studies using data from human participants, were ex- tremely rare and study results of fiber intake and its clinical impact in bone health are conflicting.[4-7] Furthermore, no long-term quality observational or experimental trial examining the effect of fiber content in the typical Korean diet on bone mineralization has ever been conducted, nor any causal association between fiber intake and BMD in the South Korean population ever been found thus far. The correlations between the amount of daily fiber intake and BMDs in Korean adult population were investigated in our study.
METHODS
1. Study population
The Korean National Health and Nutrition Examination Survey (KNHANES) is a national nutrition survey performed to evaluate the health and nutritional status of the Korean people since 1998 by Korea Centers for Disease Control &
Prevention with the supervision of Ministry of Health and Welfare, South Korea. The participants in KNHANES were selected by using a multi-stage clustered probability de- sign to ensure representation of Korean citizens residing in Korea. In this cross-sectional study, the data from KNHANES
conducted in 2011 were used. Each sampling unit (SU), which is geographically defined across the country, con- sists of 60 households. A total of 192 SU out of approximate- ly 200,000 were randomly selected from the 2011 survey.
A face-to-face interview was conducted for the dietary survey using the 24 hr recall method. Because the data for daily dietary intake of nutrients were reported separately from that for BMDs of each participant in the 2011 survey, we manually merged 2 data sheets through matching the participant’s identification number reported in KNHANES.
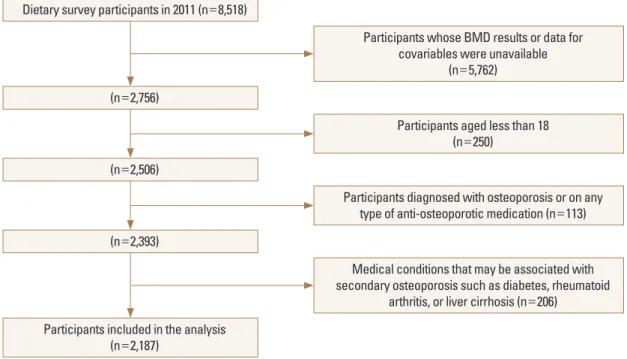
Among 8,518 individuals participating in the dietary survey in 2011, the BMD results and nutritional covariates were available only for 2,756 individuals. We excluded data of participants aged less than 18 years (n=250). Partici- pants diagnosed with osteoporosis or on any type of anti- osteoporotic medication (n=113) were excluded from the study. Individuals who reported that they were diagnosed with medical conditions that may be associated with sec- ondary osteoporosis such as diabetes, rheumatoid arthri- tis, or liver cirrhosis (n=206) were also excluded from our study. After the exclusion criteria were applied, a total of 2,187 participants were included in the analyses. Figure 1 shows the inclusion and exclusion criteria for participants in this study.
Fig. 1. The inclusion and exclusion criteria for participants.
Dietary survey participants in 2011 (n=8,518)
(n=2,756)
(n=2,506)
(n=2,393)
Participants included in the analysis (n=2,187)
Participants whose BMD results or data for covariables were unavailable
(n=5,762)
Participants aged less than 18 (n=250)
Participants diagnosed with osteoporosis or on any type of anti-osteoporotic medication (n=113)
Medical conditions that may be associated with secondary osteoporosis such as diabetes, rheumatoid
arthritis, or liver cirrhosis (n=206)
2. Quantification of daily nutritional intake and measurement of BMD
Nutrients that were selected for inclusion in the analysis were dietary fiber, carbohydrate, protein, fat, calcium, phos- phorus, iron, thiamine, riboflavin, niacin and vitamin C. The daily amount of each nutrient that participants consumed was calculated using the nutrition facts label on foods pro- vided by Korea Food Research Institute (https://www.kfri.
re.kr/?c=6/47/118). Both the survey methodology and quan- tification of daily nutritional intake reported in greater de- tail can be found at the following web address: https://
knhanes.cdc.go.kr/knhanes/sub04/sub04_02_02.do?class- Type=4. BMD of lumbar vertebrae 1-4 (L1-4 total), L1, L2, L3, and L4 vertebrae, femur neck, femur total, and trochan- ter were measured using dual energy X-ray absorptiome- try (DISCOVERY-W; Hologic, Bedford, MA, USA).
3. Statistical analyses
Descriptive statistics of survey participants’ daily con- sumption of each nutrition and mineral were performed as follows: Student t-test was utilized for continuous variables and χ2 test were applied for dichotomous variables. One- way analysis of variance test was used to determine statis- tically significant differences between subgroups. Data are reported as mean±standard deviation unless otherwise indicated in the table legends. Multivariable linear regres- sion was performed to explore the association between fi- ber consumption and BMD of L1, L2, L3, and L4 vertebrae, L1-4 total, femur neck, femur total, and trochanter. All mod- els were adjusted for age, body mass index (BMI),[8] serum vitamin D level,[9] cigarette smoking (current smoker vs.
never smoker or quit smoking more than 1 year),[8] physi- cal activity,[10,11] alcohol use,[12] daily consumption of carbohydrate,[6] protein,[13-16] fat,[17] calcium,[17,18]
phosphate, iron, thiamine, riboflavin, niacin, and vitamin C [17,19] except for contraceptive use (current user vs. never or formerly used), hormonal replacement therapy (current user vs. never or formerly used), which were included sole- ly in the regression model for female. Given that sex hor- mones may modify the effect of dietary fiber on bone loss, the regression analyses for men and women were conduct- ed separately.[20] As osteoporosis screening starts at the age of 65 and risk assessment for osteoporosis starts at age 45 at the earliest, age-subgroup analyses were conducted within male and female participants as follows: subgroup
(1) aged 16 to 45; (2) 46 to 64; and (3) older than 65.[21] All statistical data were analyzed using the IBM SPSS software version 23.0 (IBM Corp., Armonk, NY, USA). The statistical significance was set at 0.05.
RESULTS
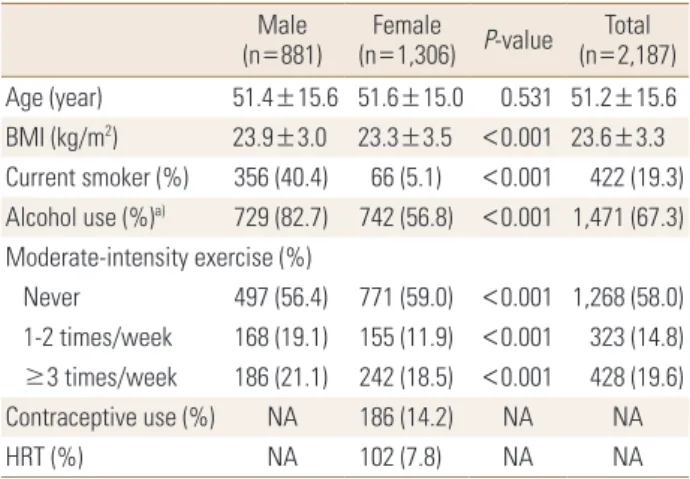
A total of 2,187 participants were included in the analy- ses. Mean age of participants for male and female were 51.4 and 51.6 years old, respectively. Female participants were 59.7% of 2,187 individuals. Among female partici- pants, 14.2% of them reported that they had a history of contraceptive use while 7.8% of them were on hormone replacement therapy at least in the previous year. Table 1 provides the characteristics of survey participants.
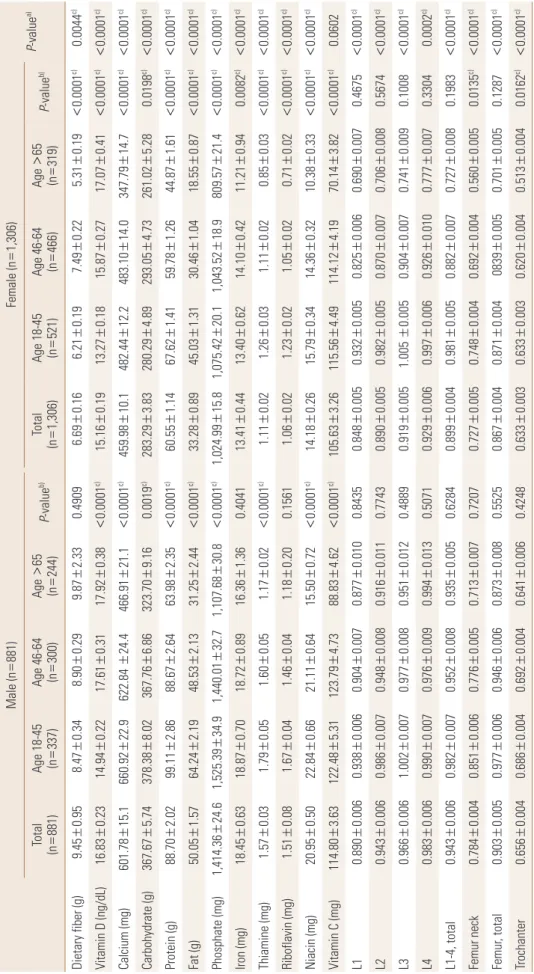
The average amounts of daily fiber intake for men and women were 9.08 g and 6.34 g respectively, which were below the recommended amount of daily consumption.
The serum levels of 25-hydroxy-vitamin D (25[OH]D) for men and women were 16.82 ng/mL and 15.40 ng/mL re- spectively, which were below the lower limit of normal range of 25(OH)D. The mean amount of daily calcium in- take for men and women were 583.56 mg and 437.77 mg respectively, which were below the recommended amount of daily consumption.
There were significant differences between men and women in the amount of consumption for dietary fiber (P=0.0044), calcium, carbohydrate, protein, fat, iron, thia- mine, riboflavin, and niacin (P-value for all except for di-
Table 1. Characteristics of study participants Male
(n=881) Female
(n=1,306) P-value Total (n=2,187) Age (year) 51.4±15.6 51.6±15.0 0.531 51.2±15.6 BMI (kg/m2) 23.9±3.0 23.3±3.5 <0.001 23.6±3.3 Current smoker (%) 356 (40.4) 66 (5.1) <0.001 422 (19.3) Alcohol use (%)a) 729 (82.7) 742 (56.8) <0.001 1,471 (67.3) Moderate-intensity exercise (%)
Never 497 (56.4) 771 (59.0) <0.001 1,268 (58.0) 1-2 times/week 168 (19.1) 155 (11.9) <0.001 323 (14.8) ≥3 times/week 186 (21.1) 242 (18.5) <0.001 428 (19.6) Contraceptive use (%) NA 186 (14.2) NA NA
HRT (%) NA 102 (7.8) NA NA
a)Alcohol use: individuals who ever used alcohol in the previous year were counted as an alcohol user.
BMI, body mass index; HRT, hormone replacement therapy; NA, not ap- plicable.
Table 2. Daily amount of nutritional consumption and mean bone mineral density of each bone region Male (n=881)Female (n=1,306) P-valuea) Total (n=881) Age 18-45 (n
=337)
Age 46-64 (nAge >65 Total b)P-value =300)(n=244)(n=1,306)
Age 18-45 (n=521)
Age 46-64 (n
=466)Age >65 (n=319)P-valueb) Dietary fiber (g)9.45±0.958.47±0.348.90±0.299.87±2.330.49096.69±0.166.21±0.197.49±0.225.31±0.19<0.0001c)0.0044c) Vitamin D (ng/dL)16.83±0.2314.94±0.2217.61±0.3117.92±0.38<0.0001c)15.16±0.1913.27±0.1815.87±0.2717.07±0.41<0.0001c)<0.0001c) Calcium (mg)601.78±15.1660.92±22.9622.84 ±24.4466.91±21.1<0.0001c)459.98±10.1482.44±12.2483.10±14.0347.79±14.7<0.0001c) <0.0001c) Carbohydrate (g)367.67±5.74378.38±8.02367.76±6.86323.70±9.160.0019c)283.29±3.83280.29±4.89293.05±4.73261.02±5.280.0198c)<0.0001c) Protein (g)88.70±2.0299.11±2.8688.67±2.6463.98±2.35<0.0001c)60.55±1.1467.62±1.4159.78±1.2644.87±1.61<0.0001c) <0.0001c) Fat (g)50.05±1.5764.24±2.1948.53±2.1331.25±2.44<0.0001c)33.28±0.8945.03±1.3130.46±1.0418.55±0.87<0.0001c)<0.0001c) Phosphate (mg)1,414.36±24.61,525.39±34.91,440.01±32.71,107.68±30.8<0.0001c)1,024.99±15.81,075.42±20.11,043.52±18.9809.57±21.4<0.0001c)<0.0001c) Iron (mg)18.45±0.6318.87±0.7018.72±0.8916.36±1.360.404113.41±0.4413.40±0.6214.10±0.4211.21±0.940.0082c) <0.0001c) Thiamine (mg)1.57±0.031.79±0.051.60±0.051.17±0.02<0.0001c)1.11±0.021.26±0.031.11±0.020.85±0.03<0.0001c)<0.0001c) Riboflavin (mg)1.51±0.081.67±0.041.46±0.041.18±0.200.15611.06±0.021.23±0.021.05±0.020.71±0.02<0.0001c) <0.0001c) Niacin (mg)20.95±0.5022.84±0.6621.11±0.6415.50±0.72<0.0001c)14.18±0.2615.79±0.3414.36±0.3210.38±0.33<0.0001c)<0.0001c) Vitamin C (mg)114.80±3.63122.48±5.31123.79±4.7388.83±4.62<0.0001c)105.63±3.26115.56±4.49114.12±4.1970.14±3.82<0.0001c)0.0602 L10.890±0.0060.938±0.0060.904±0.0070.877±0.0100.84350.848±0.0050.932±0.0050.825±0.0060.690±0.0070.4675<0.0001c) L20.943±0.0060.986±0.0070.948±0.0080.916±0.0110.77430.890±0.0050.982±0.0050.870±0.0070.706±0.0080.5674<0.0001c) L30.966±0.0061.002±0.0070.977±0.0080.951±0.0120.48890.919±0.0051.005 ±0.0050.904±0.0070.741±0.0090.1008<0.0001c) L40.983±0.0060.990±0.0070.976±0.0090.994±0.0130.50710.929±0.0060.997±0.0060.926±0.0100.777±0.0070.33040.0002c) L1-4, total0.943±0.0060.982±0.0070.952±0.0080.935±0.0050.62840.899±0.0040.981±0.0050.882±0.0070.727±0.0080.1983<0.0001c) Femur neck0.784±0.0040.851±0.0060.776±0.0050.713±0.0070.72070.727±0.0050.748±0.0040.692±0.0040.560±0.0050.0135c) <0.0001c) Femur, total0.903±0.0050.977±0.0060.946±0.0060.873±0.0080.55250.867±0.0040.871±0.0040839±0.0050.701±0.0050.1287<0.0001c) Trochanter0.656±0.0040.686±0.0040.692±0.0040.641±0.0060.42480.633±0.0030.633±0.0030.620±0.0040.513±0.0040.0162c) <0.0001c) a) Between men and women. b) Within age subgroups. C) P<0.05.
Table 3. Recommended daily intake of nutrition and vitamins in Ko- reaa)
Male Female
Dietary fiber (g) 25 30
Calcium (mg) 700-800 700-800
Carbohydrate (g) NA NA
Protein (g) 55-60 45-55
Fat (g) NA NA
Phosphate (mg) 700 700
Iron (mg) 9-10 7-14
Thiamine (mg) 1.2 1.1
Riboflavin (mg) 1.5 1.2
Niacin (mg) 16 14
Vitamin C (mg) 100 100
a)Adults aged >18 (pregnant women were excluded).
NA, not available.
Table 4. Regression coefficients of daily dietary fiber consumption by age groups and gender in multivariable linear regression
Male Female
Age 18-45 Age 46-64 Age >65 Age 18-45 Age 46-64 Age >65
β P-value β P-value β P-value β P-value β P-value β P-value
L1 0.004 0.040a) 0.000 0.967 0.001 0.698 0.002 0.152 -0.001 0.642 -0.008 0.230
L2 0.004 0.038a) -0.001 0.772 0.005 0.102 0.003 0.106 0.000 0.951 -0.006 0.388
L3 0.003 0.082 -0.001 0.866 0.006 0.060 0.002 0.207 0.001 0.599 -0.007 0.357
L4 0.003 0.176 -0.001 0.757 0.005 0.146 0.002 0.338 0.000 0.916 -0.008 0.280
L1-4, total 0.003 0.060 0.000 0.884 0.004 0.093 0.002 0.172 0.000 0.983 -0.004 0.498
Femur neck 0.001 0.520 -0.001 0.493 0.001 0.389 -0.001 0.654 -0.001 0.463 0.003 0.289
Femur, total 0.001 0.563 0.000 0.868 0.002 0.363 0.000 0.736 -0.001 0.508 0.004 0.278
Trochanter 0.001 0.583 -0.001 0.467 0.002 0.199 -0.000 0.949 -0.001 0.378 0.005 0.055
a)P<0.05.
β, regression coefficient.
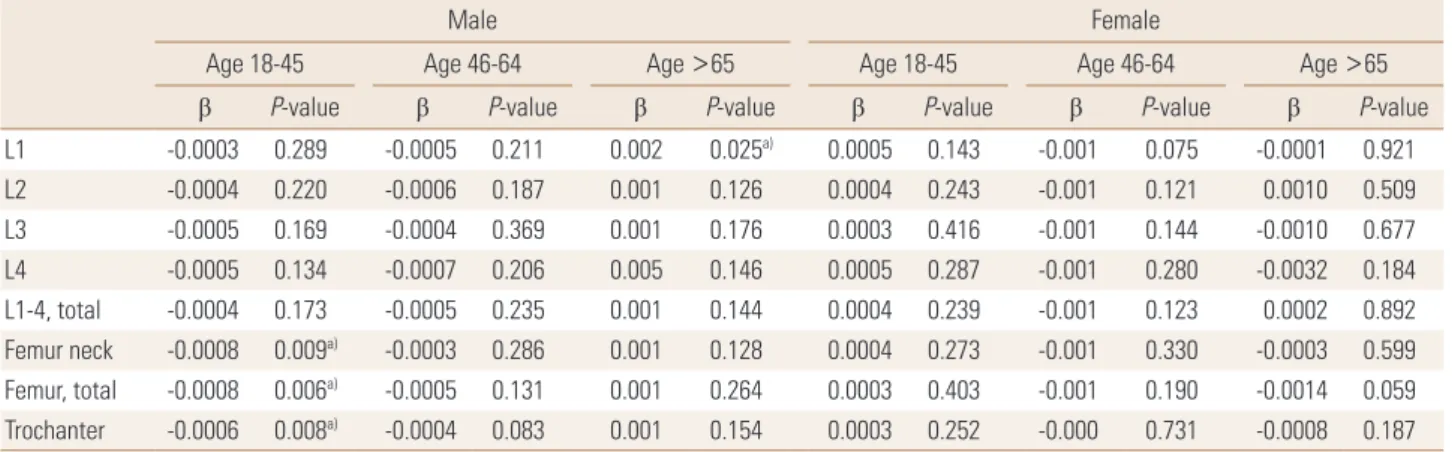
Table 5. Regression coefficients of protein consumption by age groups and gender in multivariable linear regression
Male Female
Age 18-45 Age 46-64 Age >65 Age 18-45 Age 46-64 Age >65
β P-value β P-value β P-value β P-value β P-value β P-value
L1 -0.0003 0.289 -0.0005 0.211 0.002 0.025a) 0.0005 0.143 -0.001 0.075 -0.0001 0.921
L2 -0.0004 0.220 -0.0006 0.187 0.001 0.126 0.0004 0.243 -0.001 0.121 0.0010 0.509
L3 -0.0005 0.169 -0.0004 0.369 0.001 0.176 0.0003 0.416 -0.001 0.144 -0.0010 0.677
L4 -0.0005 0.134 -0.0007 0.206 0.005 0.146 0.0005 0.287 -0.001 0.280 -0.0032 0.184
L1-4, total -0.0004 0.173 -0.0005 0.235 0.001 0.144 0.0004 0.239 -0.001 0.123 0.0002 0.892
Femur neck -0.0008 0.009a) -0.0003 0.286 0.001 0.128 0.0004 0.273 -0.001 0.330 -0.0003 0.599 Femur, total -0.0008 0.006a) -0.0005 0.131 0.001 0.264 0.0003 0.403 -0.001 0.190 -0.0014 0.059 Trochanter -0.0006 0.008a) -0.0004 0.083 0.001 0.154 0.0003 0.252 -0.000 0.731 -0.0008 0.187
a)P<0.05.
β, regression coefficient.
etary fiber were P<0.0001). However, the amount of vita- min C intake showed no difference between men and wom- en (P=0.0602). Table 2 provides the average amount of nutritional consumption and BMD of L1-4 total, L1, L2, L3 and L4 vertebrae, femur neck, femur total, and trochanter of the study population by age groups and gender. Table 3 provides the amount of recommended daily consumption of each nutrient and vitamin in South Korea.[22]
For the male group, there were no significant associa- tions between dietary fiber intake and BMD of each bone area. However, in males aged between 18 and 45, fiber in- take significantly increased BMDs of L1 (regression coeffi- cient β=0.004, P =0.040) and L2 (β=0.004, P =0.038);
there was a 0.004 g/cm2 increase in BMD of L1 and L2 for additional 1 g of daily fiber intake. However, daily protein
consumption significantly lowered BMDs of femur neck (β=-0.001, P=0.009), femur total (β=-0.001, P=0.006), and trochanter (β=-0.001, P=0.008); there was a 0.001 g/cm2 decrease in BMD of femur neck, trochanter and intertro- chanter for additional 1 g of daily protein intake. In the same age group, no significant association was identified between dietary fiber intake and L3, L4, L1-4 total, femur neck, femur total, and trochanteric area. In male aged be- tween 46 and 65, fiber intake showed no significant asso- ciation with any bone area of interest in our study. In males aged 65 and older, nutrient intake did not show any signif- icant correlations with BMDs except fat consumption, which was inversely associated with BMD of trochanter (β=-0.001, P=0.017); there was a 0.001 g/cm2 decrease in BMD of tro- chanter for additional 1 g of daily fat intake. Table 4-6 pro- vide the regression coefficient of daily dietary fiber, protein and fat consumption by age groups and gender, respec- tively. Table 7 provides independent covariates (nutrition and minerals only) that were statistically significant in the regression model.
For the female group, no significant associations were found between dietary fiber intake and BMD of each bone area. In females aged between 18 and 45, fiber intake showed no statistically significant relationship with BMDs of any bone regions of interest, either. However, in the same age group, daily fat consumption significantly increased BMDs of L1 (β=0.001, P=0.028), L2 (β=0.001, P=0.024), and L3 (β=0.001, P=0.033); there was a 0.001 g/cm2 increase in BMD of L1, L2, and L3 for additional 1 g of daily fat intake.
Additionally, daily carbohydrate consumption significantly increased BMDs of femur neck (β=0.0001, P=0.044), and
trochanter (β=0.0001, P=0.045) in the same age group of female; there was a 0.0001 g/cm2 increase in BMD of femur neck and trochanter for additional 1 g of daily carbohy- drate intake. In female aged between 46 and 65, fiber in- take showed no significant association with BMD of any bone area of interest. In females aged 65 and more, while fiber was not also significantly associated with BMD of any bone area, the daily consumption of vitamin C showed negative correlations with BMD of femur total (β=-0.0004, P=0.013) and trochanter (β=-0.0004, P=0.003) respec- tively; there was a 0.0004 g/cm2 decrease in BMD of both femur total and trochanter for additional 1 mg of daily vi- tamin C intake.
DISCUSSION
The associations between daily fiber consumption and BMD of L1, L2, L3, and L4 vertebrae, L1-4 total, femur neck, femur total, and trochanter were investigated in our study.
Daily fiber intake was a protective factor of BMD of L1 and L2 vertebrae particularly in males aged between 18 and 45 but not in females of any age group. However, dietary fiber consumption showed no significant associations with BMD of L1-4 total, nor was it with femur neck, femur total, and trochanter in any age group regardless of sex.
A recently published 8-year of follow-up longitudinal co- hort study using the Framingham offspring cohort dem- onstrated the higher the amount of daily dietary fiber the male participants consumed, the less bone loss of femur neck they experienced.[23] The positive relationship be- tween fiber intake and bone health in younger male group Table 6. Regression coefficients of fat consumption by age groups and gender in multivariable linear regression
Male Female
Age 18-45 Age 46-64 Age >65 Age 18-45 Age 46-64 Age >65
β P-value β P-value β P-value β P-value β P-value β P-value
L1 0.0004 0.173 0.0000 0.875 -0.0007 0.310 0.0006 0.015a) 0.0006 0.160 0.0004 0.754
L2 0.0003 0.272 -0.0001 0.666 -0.0009 0.247 0.0007 0.014a) 0.0007 0.119 0.0011 0.460
L3 0.0001 0.682 -0.0001 0.709 -0.0006 0.456 0.0006 0.021a) 0.0006 0.213 0.0025 0.154
L4 0.0002 0.426 -0.0002 0.646 -0.0016 0.074 0.0006 0.057 0.0005 0.319 0.0021 0.207
L1-4, total 0.0003 0.355 -0.0001 0.797 -0.0011 0.149 0.0006 0.017a) 0.0006 0.202 0.0011 0.417 Femur neck -0.0000 0.980 -0.0001 0.533 -0.0006 0.197 0.0004 0.098 0.0002 0.539 -0.0001 0.787 Femur, total -0.0000 0.883 -0.0001 0.562 -0.0010 0.050 0.0003 0.169 0.0002 0.451 -0.0006 0.379 Trochanter 0.0000 0.876 -0.0005 0.017a) -0.0010 0.017a) 0.0002 0.252 -0.0000 0.765 -0.0007 0.171
a)P<0.05.
β, regression coefficient.
in our cross-sectional study was in line with the study out- come of the Framingham offspring cohort study; higher fi- ber intake increased BMD of femur neck only in males. No- tably, sex difference in the association of dietary fiber and BMD was evident in both studies regardless of types of di- etary fiber that study participants consumed; most of the
study participants in the Framingham offspring cohort study were Caucasians whose sources of fiber may be dif- ferent than those of most Koreans.[23]
The positive impact of dietary fiber consumption may be explained by the production of short-chain fatty acid (SCFA) during the fermentation of fiber in the intestine; the Table 7. Significant independent variables (nutrition and minerals only) in the linear regression model
Male Female
Age 18-45 Age 46-64 Age >65 Age 18-45 Age 46-64 Age >65
L1
Fiber 0.004 - - - - -
Vitamin D 0.004 - - - - -
Calcium 0.004 - - - - 0.000
Protein - - 0.002 - - -
Fat - - - 0.001 - -
Phosphatea) - - - -0.000 - -
L2
Fiber 0.004 - - - - -
Calcium 0.000 0.000 - - - -
Fat - - 0.001 - -
L3
Fat - - - 0.001 - -
Vitamin B1a) - - - -0.033 - -
L4
Vitamin D 0.004 - - - - -
Calcium 0.000 - - - - -
L1-4, total
Vitamin D 0.004 - - - - -
Fat - - - 0.001 - -
Thiaminea) - - - -0.030 - -
Femur neck
Vitamin D 0.005 - - - - 0.002
Proteina) -0.001 - - - - -
Vitamin B2 0.044 - - - - -
Femur, total
Vitamin D 0.004 - - - - 0.003
Proteina) -0.001 - - - - -
Carbohydrate - - - 0.000 - -
Vitamin Ca) - - - - - 0.000
Trochanter
Vitamin D 0.003 - - - - 0.002
Proteina) -0.001 - - - - -
Fata) - -0.001 -0.001 - - -
Carbohydrate - - - 0.000 - -
Vitamin Ca) - - - - - 0.000
The data is presented as regression coefficient (β).
a)Negative association.
SCFA may facilitate the absorption of calcium.[24] Consid- ering that fiber can increase the intestinal lumen resulting in a larger surface of calcium absorption, fiber consump- tion can even enhance the effect of SCFA on calcium ab- sorption.[25] However, it is unclear where the difference in the age-group specific positive impact of fiber consump- tion on BMD comes from. Considering the relatively small sample size in our study, the association between fiber consumption and bone health may be better character- ized as age difference in a study with more extensive sam- ple size in the future.
Plausible mechanism behind the sex difference in terms of associations between fiber consumption and BMD also remains unclear. In order to adjust for the hormonal im- pact on bone mineralization, the regression analyses for men and women were conducted separately. Also, in an effort to elucidate where the sex difference comes from, we included the use of contraceptives and hormone re- placement therapy in the regression model for women since exogenous sex hormone uses may influence the de- gree of BMDs in female groups. Even in the pre- and post- menopausal subgroup analyses, fiber consumption did not show any significant association with BMDs of any bone areas. The sex difference in the associations between fiber and bone health may be explained by the sex differ- entials in overall gut microbiome composition and its role of SCFA in bone mineralization.[20,26]
Due to lack of scientific evidence concerning either ben- eficial or harmful effects of fiber consumption, upper or lower limit that indicates required amount of average fiber intake per day has not been reported in Korea. Instead, based on median value of average amount of fiber con- sumption reported in KNHANES, the Korean Nutrition So- ciety estimated sufficient rather than necessary amount of daily fiber intake in Dietary Reference Intake for Korean 2015 (KDRI 2015).[22] The KDRI 2015 suggested that the sufficient amount of daily fiber intake for Korean adults is 25 g/day for men and 20 g/day for women regardless of age.[22] However, in our study, average amounts of daily fiber intake for men and women were 9.08 g and 6.34 g re- spectively, which were far below the recommended daily intake in Korea. The most recent practice guideline for os- teoporosis published by the Korean Society of Bone Me- tabolism in 2018 reported that fiber consumption may hinder calcium absorption and specified that they do not
recommend patients with osteoporosis to consume di- etary fiber, leaning in the negative impact of fiber con- sumption on bone health.[27] However, the evidence to support their recommendations on fiber consumption was not clearly indicated in the guideline. Further, Gordon et al.[28] pointed out in their review literature that even 50 g total dietary fiber per day are not expected to cause any negative impact on mineral bioavailability. Given the com- plexity of research hypothesizing possible relationships between fiber and its clinical implication due to potential interactions between foods and nutrition, population spe- cific epidemiologic study may be an alternative methodol- ogy to provide more solid evidence in clinical practice. Ex- tensive population-based epidemiologic study for the Ko- rean population may be warranted to revise current rec- ommendation on fiber consumption for prevention and management of osteoporosis.
As proven previously in other studies, protein consump- tion showed its negative impact on BMD of femur neck, fe- mur total, and trochanter in our study as well.[13-16] In a study conducted by Lim et al.[29], authors pointed out that the daily consumption of protein was increased par- ticularly in college students in Korea. It is quite concerning given that the excessive protein intake may have negative impact on bone health particularly in younger adults in Korea.
Unlike previously published epidemiologic studies that showed the positive effect of vitamin C on bone health, consumption of vitamin C significantly lowered BMD of fe- mur total and trochanter in female older than 65 in our study.[19] Currently, the critical role of vitamin C in bone mineralization can be explained by the effect of vitamin C on collagen maturation.[30] New epigenetic studies are in progress in order to identify the potential causal associa- tion between consumption of vitamin C and bone miner- alization at the molecular level.[31] Such studies may less- en the potential bias and limitations that epidemiologic population studies possess and provide better explanations for the contradictory results with respect to the impact of vitamin C on bone health in population-based studies.
In our study, daily fat consumption significantly increased BMD of L1-4 total, L1, L2, and L3 in younger females aged between 18 and 45 while it decreased BMD of trochanter in middle-aged men older than 46. The positive impact of fat consumption on bone health in the younger age group
(female aged 18-45) may be explained by the essential role of high-fat diet in achieving peak bone mass during growth at a younger age.[32] On the other hand, fat consumption and its negative impact on bone health in the older age group (male aged 46 and older) may be associated with deteriorating changes in bone microstructure that high fat intake can bring about; as bone strength reduces, high-fat diet can alter the bone marrow environment and create inflammatory environment, which eventually cause detri- mental effect on bone microstructure.[33] Regarding the role of sex difference in the relationship between fat con- sumption and BMD, however, further research is warranted to elucidate the pathophysiologic mechanism behind.
Even though KNHANES entails comprehensive and large- scale information of foods and nutritional patterns in South Korea, the study outcomes should be interpreted cautious- ly because the outcomes may be confounded by the po- tential recall bias that comes from the fact that the survey was based on the participants’ ability to recall all food items consumed for the last 24 hr. Also, there is the possibility of bias arising from lack of representativeness in our study since we included survey participants who had document- ed record of BMDs of bone areas of interest. Due to the lim- ited number of patients included in our study, the data we selected from the KNHANES may not represent entirely the accumulative nutritional status or daily dietary patterns of the South Korean population. Larger sample sizes may ad- dress these limitations of our study. However, our study is, to our knowledge, a novel population-based research that aimed at ascertaining potential association between daily consumption of dietary fiber and bone health, particularly using Korean food items. Our study may lead to further ex- perimental study to verify the positive associations between fiber consumption and bone mineralization.
DECLARATIONS
Ethics approval and consent to participate Not applicable.
Conflict of interest
No potential conflict of interest relevant to this article was reported.
ORCID
Heuy Sun Suh https://orcid.org/0000-0002-3058-8947
REFERENCES
1. National Research Council. Committee on diet and health:
Diet and health: Implications for reducing chronic disease risk. Washington, DC: National Academy Press; 1989.
2. Ha YC, Kim HY, Jang S, et al. Economic burden of osteopo- rosis in South Korea: Claim data of the national health in- surance service from 2008 to 2011. Calcif Tissue Int 2017;
101:623-30.
3. Sahni S, Mangano KM, McLean RR, et al. Dietary appro- aches for bone health: Lessons from the framingham os- teoporosis study. Curr Osteoporos Rep 2015;13:245-55.
4. Heaney RP, Weaver CM, Fitzsimmons ML. Soybean phytate content: effect on calcium absorption. Am J Clin Nutr 1991;
53:745-7.
5. Barbosa JC, Shultz TD, Filley SJ, et al. The relationship among adiposity, diet, and hormone concentrations in vegetarian and nonvegetarian postmenopausal women. Am J Clin Nutr 1990;51:798-803.
6. Kelsay JL. A review of research on effects of fiber intake on man. Am J Clin Nutr 1978;31:142-59.
7. Feng W, Marshall R, Lewis-Barned NJ, et al. Low follicular oestrogen levels in New Zealand women consuming high fibre diets: a risk factor for osteopenia? N Z Med J 1993;
106:419-22.
8. Kalem MN, Kalem Z, Akgun N, et al. The relationship be- tween postmenopausal women’s sclerostin levels and their bone density, age, body mass index, hormonal sta- tus, and smoking and consumption of coffee and dairy products. Arch Gynecol Obstet 2017;295:785-93.
9. Jorde R, Sneve M, Torjesen PA, et al. No significant effect on bone mineral density by high doses of vitamin D3 giv- en to overweight subjects for one year. Nutr J 2010;9:1.
10. Füzéki E, Engeroff T, Banzer W. Health benefits of light-in- tensity physical activity: A systematic review of acceler- ometer data of the national health and nutrition examina- tion survey (NHANES). Sports Med 2017;47:1769-93.
11. Hosny IA, Elghawabi HS, Younan WB, et al. Beneficial im- pact of aerobic exercises on bone mineral density in obese premenopausal women under caloric restriction. Skeletal Radiol 2012;41:423-7.
12. Jang HD, Hong JY, Han K, et al. Relationship between bone
mineral density and alcohol intake: A nationwide health survey analysis of postmenopausal women. PLoS One 2017;12:e0180132.
13. Holm L, Olesen JL, Matsumoto K, et al. Protein-containing nutrient supplementation following strength training en- hances the effect on muscle mass, strength, and bone for- mation in postmenopausal women. J Appl Physiol (1985) 2008;105:274-81.
14. Remer T, Krupp D, Shi L. Dietary protein’s and dietary acid load's influence on bone health. Crit Rev Food Sci Nutr 2014;54:1140-50.
15. Isanejad M, Sirola J, Mursu J, et al. Association of protein intake with bone mineral density and bone mineral con- tent among elderly women: The OSTPRE fracture preven- tion study. J Nutr Health Aging 2017;21:622-30.
16. Sukumar D, Ambia-Sobhan H, Zurfluh R, et al. Areal and volumetric bone mineral density and geometry at two levels of protein intake during caloric restriction: a ran- domized, controlled trial. J Bone Miner Res 2011;26:1339- 48.
17. Gunnes M, Lehmann EH. Dietary calcium, saturated fat, fi- ber and vitamin C as predictors of forearm cortical and trabecular bone mineral density in healthy children and adolescents. Acta Paediatr 1995;84:388-92.
18. Smith EL, Gilligan C, Smith PE, et al. Calcium supplemen- tation and bone loss in middle-aged women. Am J Clin Nutr 1989;50:833-42.
19. Kim DE, Cho SH, Park HM, et al. Relationship between bone mineral density and dietary intake of beta-carotene, vita- min C, zinc and vegetables in postmenopausal Korean wom- en: a cross-sectional study. J Int Med Res 2016;44:1103-14.
20. Dominianni C, Sinha R, Goedert JJ, et al. Sex, body mass index, and dietary fiber intake influence the human gut microbiome. PLoS One 2015;10:e0124599.
21. Ahmadzadeh A, Emam M, Rajaei A, et al. Comparison of three different osteoporosis risk assessment tools: ORAI (osteoporosis risk assessment instrument), SCORE (simple calculated osteoporosis risk estimation) and OST (osteo- porosis self-assessment tool). Med J Islam Repub Iran 2014;
28:94.
22. Ministry of Health and Welfare, The Korean Nutrition Soci- ety. Dietary reference intakes for Koreans 2015. Sejong:
Ministry of Health and Welfare, The Korean Nutrition Soci- ety; 2015.
23. Dai Z, Zhang Y, Lu N, et al. Association between dietary fi- ber intake and bone loss in the framingham offspring study.
J Bone Miner Res 2018;33:241-9.
24. Albarracin M, Weisstaub AR, Zuleta A, et al. Extruded whole grain diets based on brown, soaked and germinated rice.
Effects on cecum health, calcium absorption and bone parameters of growing Wistar rats. Part I. Food Funct 2016;
7:2722-8.
25. Scholz-Ahrens KE, Schrezenmeir J. Inulin and oligofruc- tose and mineral metabolism: the evidence from animal trials. J Nutr 2007;137:2513s-23s.
26. Lucas S, Omata Y, Hofmann J, et al. Short-chain fatty acids regulate systemic bone mass and protect from pathologi- cal bone loss. Nat Commun 2018;9:55.
27. Byun DW, Yoon HG. Physician’s guide for osteoporosis.
Seoul: CDM the Big Publishing Co.; 2018.
28. Gordon DT, Stoops D, Ratliff V. Dietary fiber and mineral nutrition. In: Kritchevsky D, Bonfield C, editors. Dietary fi- ber in health and disease. St. Paul, MN: Eagan Press; 1995.
p.267-93.
29. Lim HS, Ji SI, Hwang H, et al. Relationship between bone density, eating habit, and nutritional intake in college stu- dents. J Bone Metab 2018;25:181-6.
30. Marini JC, Cabral WA, Barnes AM, et al. Components of the collagen prolyl 3-hydroxylation complex are crucial for normal bone development. Cell Cycle 2007;6:1675-81.
31. Aghajanian P, Hall S, Wongworawat MD, et al. The roles and mechanisms of actions of vitamin C in bone: New de- velopments. J Bone Miner Res 2015;30:1945-55.
32. Malvi P, Piprode V, Chaube B, et al. High fat diet promotes achievement of peak bone mass in young rats. Biochem Biophys Res Commun 2014;455:133-8.
33. Tian L, Yu X. Fat, sugar, and bone health: A complex rela- tionship. Nutrients 2017;9:E506.