pISSN 2288-3886 / eISSN 2288-3959
우리나라 성인 여성의 항산화비타민 섭취량과 비만의 연관성 : 2007 ~ 2016년 국민 건강영양조사 자료를 이용하여 *
함동우1· 김성아1· 전신영2· 강민숙3· 정효지1,4†
서울대학교 보건환경연구소1, 퍼듀대학교 영양학과2, 국립농업과학원 농식품자원부 식생활영양과3, 서울대학교 보건대학원 보건학과4
Association between antioxidant vitamin intake and obesity among Korean women:
using the Korea National Health and Nutrition Examination Survey 2007 ~ 2016 *
Ham, Dongwoo1· Kim, Seong-Ah1· Jun, Shinyoung2· Kang, Min-Sook3· Joung, Hyojee1,4†
1Institute of Health and Environment, Seoul National University, Seoul 08826, Korea
2Department of Nutrition Science, Purdue University, West Lafayette, IN 47907, USA
3Food and Nutrition Division, Department of Agro-food Resources, National Institute of Agricultural Sciences, Wanju, Jeonbuk 55365, Korea
4Department of Public Health, Graduate School of Public Health, Seoul National University, Seoul 08826, Korea
ABSTRACT
Purpose: This study examined the association between the antioxidant vitamin intake and obesity in Korean women.
Methods: Adult women aged ≥ 19 years who completed a health examination and nutrition survey from the Korea National Health and Nutrition Examination Survey between 2007 ~ 2016 were selected for the study (n = 30,425). A BMI ≥ 25 kg/m2 and waist circumference ≥ 85 cm were defined as obesity and abdominal obesity, respectively. The individual antioxidant vitamin intake was estimated by linking the antioxidant vitamin composition database of commonly consumed foods and the subjects’ 24-hour recall food consumption data. Carotenoids, retinol, vitamin A (retinol activity equivalent), vitamin C, tocopherols, and vitamin E (α-tocopherol equivalent) were included in the analysis. Each vitamin intake was converted to the nutrient density per 1,000 kcal. Odds ratio (ORs) and 95% confidence interval (CI) for obesity according to each tertile of the nutrient density was obtained from multiple logistic regression adjusted for age, household income, education level, smoking, alcohol consumption, and physical activity. Results: The mean intake of α-carotene, retinol, vitamin E, α-tocopherol, and γ -tocopherol per 1,000 kcal was significantly lower in the obese group than in the normal group. A higher intake of lycopene was inversely associated with obesity (highest vs. lowest; OR = 0.89, 95% CI: 0.83-0.96) and abdominal obesity (highest vs.
lowest; OR = 0.88, 95% CI: 0.81-0.95). Higher intakes of α-carotene, total carotenoids, vitamin A, and γ-tocopherol also had a negative relationship with abdominal obesity. The antioxidant vitamin intakes from eggs, milk and dairy products, seasoning, and grains were significantly lower in the obese group than in the normal group. Conclusion: This study showed that the dietary intake of antioxidant vitamins was inversely associated with obesity and abdominal obesity among Korean women.
Further study will be needed to examine the causal relationship between the antioxidant vitamin and obesity.
KEY WORDS: antioxidant vitamin, obesity, abdominal obesity, Korean women, KNHANES
Received: September 7, 2018 / Revised: September 27, 2018 / Accepted: October 10, 2018
* This work was carried out with the support of ‘Research Program for Agricultural Science and Technology Development’, National Institute of Agricultural Science, Rural Development Administration, Republic of Korea (Project No. PJ013475022018).
†To whom correspondence should be addressed.
tel: +82-2-880-2831, e-mail: [email protected]
© 2018 The Korean Nutrition Society
This is an Open Access article distributed under the terms of the Creative Commons Attribution Non-Commercial License (http://creative- commons. org/licenses/by-nc/3.0/) which permits unrestricted non-commercial use, distribution, and reproduction in any medium, provided the original work is properly cited.
서 론
비만은 심혈관계 질환, 제2형 당뇨, 고혈압, 이상지질혈 증 등 다양한 만성질환의 위험요인으로 전 세계적으로 그 유병률이 증가하고 있으며,1 수많은 연구를 통해 비만은
정상 체중에 비해 사망 위험을 높이는 것으로 보고되어 왔 다.2 질병관리본부가 발표한 국민건강통계에 따르면 2016 년 우리나라 성인 여성의 비만 (체질량지수 ≥ 25 kg/m2) 유병률 (26.4%)은 남성 (42.3%)에 비해 낮았고, 복부비만 (허리둘레 ≥ 85 cm)의 유병률 (27.8%)도 남성 (31.6%)보다
는 낮았다. 그러나 남성의 비만 유병률은 연령이 증가할수 록 감소한 것과는 달리 여성은 연령이 증가할수록 비만 유 병률이 높았다.3 여성호르몬인 에스트로겐은 체내 지질 대 사를 조절하여 비만을 예방하는 기능을 갖는데, 폐경기 이 후 에스트로겐 분비가 점차 감소함에 따라 중년 이후 여성 에게서 비만의 위험이 점차 높아지는 것으로 알려져 있 다.4 또한 비만은 여성에게서 고콜레스테롤혈증, 당뇨 등 다양한 만성질환의 원인일 뿐만 아니라,1 다낭성난소증후 군, 월경 불순, 자궁암 등 각종 부인과 질환 발생 위험도 높이는 것으로 보고되고 있다.5
비만의 주요 원인으로 에너지의 과잉 섭취, 유전적 요인, 부적절한 생활행태, 환경적 요인 등이 보고되고 있다.1 비 만 발생의 생화학적 기전에 관한 선행 연구에 따르면, 대 식세포 (macrophage)와 같은 면역세포는 면역반응 중에 활성산소를 발생시키는데, 염증상태가 지속되면 활성산소 가 체내에 점점 축적되어 산화스트레스 수준이 높아지게 된다.6 산화스트레스는 세포 내 지질 및 단백질 대사를 교 란시키고, 이로 인한 신체 대사의 기능 저하는 비만을 유 발시키는 것으로 알려졌다.7 또한 에너지의 과잉 섭취는 지방세포 (adipocyte)에서 사이토카인 (cytokine)의 일종인 렙틴 (leptin) 분비를 유발하고 렙틴은 체내 염증수준을 반 영하는 지표인 TNF-α (tumor necrosis factor-α), IL-6 (interleukin-6) 등의 발현을 촉진하게 된다.8,9
비만의 위험인자인 산화스트레스는 활성산소와의 반응 성이 높은 항산화물에 의해 조절되며, 대표적인 항산화물 로는 식품을 통해 섭취하는 비타민 A, 비타민 C, 비타민 E 등의 항산화비타민이 있다.10-12 여러 선행연구를 통해 혈중 항산화비타민 수준과 비만의 관련성이 보고되어 왔 다. 비만 환자들을 대상으로 수행된 한 검진조사에서 체질 량지수 (body mass index, BMI) 와 혈중 레티놀 및 α-토코 페롤 농도 사이에 음의 연관성이 관찰되었다.13 미국과 멕 시코의 성인 여성을 대상으로 수행된 관찰연구에서도 BMI가 높은 대상자일수록 혈중 카로티노이드와 비타민 C 농도는 낮은 것으로 나타났다.14,15
이러한 항산화비타민은 주로 식사를 통해 섭취하지만, 국내에서는 지금까지 대표성이 확보된 표본으로 항산화비 타민 섭취실태와 비만의 연관성을 분석한 연구가 부족한 실정이다. 국민건강영양조사 식품섭취조사자료는 개별 카 로티노이드와 토코페롤 섭취량을 포함하지 않고 있다. 또 한 비타민 A 섭취량의 경우 2015년까지는 2015 한국인 영 양소 섭취기준16에서 새롭게 제정된 레티놀 활성 당량 (retinol activity equivalent, RAE) 대신 레티놀 당량 (retinol equivalent, RE)으로만 섭취량을 조사하여, 2016년 이전과 이후의 자료를 통합할 경우 직접적인 섭취량 비교가 불가
능하다는 제약이 있다. 따라서 본 연구는 체계적으로 구축 된 한국인 상용식품의 항산화비타민 함량 데이터베이스를 2007 ~ 2016년 국민건강영양조사 식품섭취조사자료와 연 계하여, 성인 여성의 항산화비타민 섭취량과 비만의 연관 성을 분석하고 식사를 통한 비만 예방 및 관리방안의 과학 적 근거를 제시하고자 수행되었다.
연구방법
연구대상
본 연구는 국민건강영양조사 제4·5·6기 (2007 ~ 2015) 및 제7기 1차년도 (2016) 자료를 이용하였다. 해당 년도에 국 민건강영양조사에 참여한 만 19세 이상 성인 여성 35,436 명 중, 총 30,861명이 검진조사 중 신체계측 및 24시간 회 상법을 이용한 식품섭취조사를 완료하였다. 이들 중 일일 에너지 섭취량이 500 kcal 미만이거나 5,000 kcal 초과인 대상자를 제외하여 30,425명을 연구대상으로 선정하여 분 석하였다. 본 연구자료는 2007 ~ 2014년에는 질병관리 본부 연구윤리심의위원회 승인을 받아 수집되었으며 (승 인번호 : 2007-02CON-04-P, 2008-04EXP-01-C, 2009-01 CON-03-2C, 2010-02CON-21-C, 2011-02CON-06-C, 2012- 01EXP-01-2C, 2013-07CON-03-4C, 2013-12EXP-03-5C), 2015 ~ 2016년에는 생명윤리법 제2조 제1호 및 동법 시행 규칙 제2조 제2항 제1호에 따라 연구윤리심의원회 심의를 받지 않고 수집되었다.
일일 항산화비타민 섭취량 추정
연구대상자의 1일 항산화비타민 섭취량은 본 연구진이 기구축한 한국인 상용식품의 항산화비타민 함량 데이터베 이스를 24시간 회상 식품섭취조사자료에 연계하여 추정하 였다. 본 데이터베이스는 제4·5기 국민건강영양조사에 참 여한 대상자들이 섭취한 식품 3,193종에 대하여 우리나라 농촌진흥청17,18과 미국 United States Department of Agriculture19에서 발표한 자료를 바탕으로, 카로티노이드 6종 (α-카로틴, β-카로틴, 라이코펜, β-크립토잔틴, 루테인/
제아잔틴), 레티놀, 비타민 C, 토코페롤 4종 (α-토코페롤, β -토코페롤, γ-토코페롤, δ-토코페롤) 등 항산화비타민의 식 품별 함량을 수집하여 구축되었다. 동일 식품에 대해 복수 의 함량값이 제시되어 있는 경우에는 농촌진흥청에서 발 표한 값을 우선적으로 사용하였으며, 두 자료원에 모두 포 함되어 있지 않은 경우 농촌진흥청에서 인용한 일본 문부 과학성20의 자료를 이용하였다.21 또한 자료원에 함량값이 없는 식품의 경우, 가공상태는 다르지만 원재료가 동일한 식품의 함량값을 바탕으로 질병관리본부가 발표하는 수분
환산계수와 Chun 등22이 고안한 방법을 사용하여 대체값 을 적용하였다. 한국인 상용식품의 항산화비타민 함량 데 이터베이스 구축 과정은 선행 연구논문들에 자세하게 기 술되어 있다.21,23,24
개인별 항산화비타민 섭취량은 개별 식품 섭취량 (g)과 식품 1 g 당 항산화비타민 함량을 곱한 뒤, 하루 동안 식 품을 통해 섭취한 항산화비타민 섭취량을 모두 합하여 산 출하였다. 에너지 섭취량의 영향을 최소화하고자 개인별 항산화비타민 섭취량을 열량 1,000 kcal 당으로 환산하여 섭취밀도를 계산하였다. 또한 국민건강영양조사의 18개 식품군 분류를 바탕으로 대상자들이 섭취한 식품을 식물성 식품군 (plant-derived foods), 동물성 식품군 (animal-derived foods), 기타 식품군 (others)으로 재분류하여, 식품군별 항 산화비타민 섭취량을 추정하였다. 식물성 식품군에는 곡 류 및 그 제품, 채소류, 과실류, 해조류, 그 외 식물성 식품 군 (감자 및 전분류, 두류 및 그 제품, 종실류 및 그 제품) 을, 동물성 식품군에는 육류 및 그 제품, 난류, 어패류, 우 유류 및 그 제품을, 기타 식품군에는 유지류, 음료 및 주 류, 조미료류, 그 외 식품군 (당류 및 그 제품, 버섯류, 조 리가공식품류, 기타)을 포함시켰다.
비타민 A 섭취량은 μg 레티놀 활성 당량 (RAE)으로, 비타 민 E 섭취량은 mg α-토코페롤 당량 (α-tocopherol equivalent, α-TE)으로 계산하였으며, 사용한 계산식은 다음과 같다.
Vitamin A (μg RAE) = μg retinol + μg β-carotene/12 + μg α-carotene/24 + μg β-cryptoxanthin/2425 Vitamin E (mg α-TE) = mg α-tocopherol
+ mg β-tocopherol × 0.5 + mg γ-tocopherol × 0.1 + mg δ-tocopherol × 0.0326
비만의 정의
연구대상의 비만 유병 여부는 세계보건기구에서 제정한 아시아인의 BMI를 적용한 비만 기준27과 대한비만학회에 서 제정한 한국인의 복부비만 기준28을 적용하여 판정하였 다. BMI (kg/m2)는 검진조사 중 조사원이 직접 측정한 신 장 (m)과 체중 (kg)을 바탕으로 산출되었으며, 허리둘레 (cm) 측정도 신체계측 시 함께 진행되었다. BMI가 25 kg/m2 이상인 경우 BMI 기준에 따른 비만으로, 허리둘레 가 85 cm 이상인 경우 복부비만으로 판정하였다.
연구대상의 일반적 특성
연구대상의 인구사회학적 특성을 나타내는 변수로 연령, 가구소득, 교육수준을 사용했다. 연령은 19 ~ 29세, 30 ~ 49세, 50 ~ 64세, 65세 이상으로 범주화하였다. 가구소득은
‘상’, ‘중상’, ‘중하’, ‘하’의 사분위로 구분하였으며, 교육 수준은 ‘대학 졸업 이상’, ‘고등학교 졸업’, ‘중학교 졸업’,
‘초등학교 졸업 이하’로 분류하였다.
생활행태를 나타내는 변수로는 현재 흡연율, 월간 음주 율, 중등도 신체활동 실천율 (2007 ~ 2013) 및 유산소 신체 활동 실천율 (2014 ~ 2016)을 사용하였다. 현재 흡연율은 평생 담배 5갑 (100개비) 이상 피웠고 현재 담배를 피우는 분율로, 월간 음주율은 최근 1년 동안 월 1회 이상 음주한 분율로 정의하였다. 중등도 신체활동 실천율은 최근 1주 일 동안 중등도 신체활동을 1회 30분 이상, 주 5일 이상 실천한 분율로 정의하였고, 유산소 신체활동 실천율은 중 강도 신체활동을 주 2시간 30분 이상 또는 고강도 신체활 동을 주 1시간 15분 이상 또는 중강도와 고강도 신체활동 을 혼합하여 각 활동에 상당하는 시간을 실천한 분율로 정 의하였다.
통계분석
국민건강영양조사의 복합표본설계 (complex sampling design) 특성을 반영하여, 층 (kstrata), 집락 (psu), 조사부 문별 연관성 가중치와 기수간 통합 가중치를 고려한 복합 표본분석법을 사용하였다. 모든 분석은 BMI 기준에 따른 비만군과 정상군, 허리둘레 기준에 따른 복부비만군과 정 상군에 대하여 각각 수행하였다. 통계분석은 SAS 9.4 (Statistical Analysis System 9.4, SAS Institute, Cary, NC, USA)를 이용하였으며, 모든 통계적 유의수준은 α = 0.05 를 기준으로 하였다.
연구대상의 일반적 특성 중 범주형 변수는 항목별 백분 율로, 연속형 변수는 PROC SURVEYMEANS를 이용하여 평균과 표준오차로 나타냈으며, 각각 PROC SURVEYFREQ 을 통한 Rao-Scott χ2-test 또는 PROC SURVEYREG를 통 한 t-test로 비만군과 정상군의 분포 차이를 검정하였다. 비 만군과 정상군의 일일 항산화비타민 섭취수준의 평균과 표준오차를 산출하였고, 연령, 가구소득, 교육수준, 현재 흡연율, 월간 음주율, 중등도 신체활동 실천율 및 유산소 신체활동 실천율을 보정하여 ANCOVA로 집단간 차이가 유의한지 확인하였다. 개별 항산화비타민 섭취수준을 삼 분위로 범주화한 뒤, 연령, 가구소득, 교육수준, 현재 흡연 율, 월간 음주율, 중등도 신체활동 실천율 및 유산소 신체 활동 실천율을 보정한 다중 로지스틱 회귀분석 (multiple logistic regression)을 통해 항산화비타민을 가장 적게 섭 취하는 대상자 (T1)에 비하여 많이 섭취하는 대상자 (T2, T3)가 비만일 오즈비 (odds ratio, OR)를 계산하였다. OR 의 p for trend는 항산화비타민 섭취수준의 분위별 중위수 를 회귀식에 적용하여 도출하였다.
Variables1) BMI < 25 kg/m2 (n = 21,349)
BMI ≥ 25 kg/m2
(n = 9,027) p-value2) WC < 85 cm (n = 22,145)
WC ≥ 85 cm
(n = 8,217) p-value2) Age, years3)
19 ~ 29 13.6 5.5 < 0.0001 13.9 4.0 < 0.0001
30 ~ 49 40.8 28.5 42.4 23.1
50 ~ 64 24.2 33.2 24.8 32.6
65+ 21.4 32.9 19.0 40.4
Household income 3)4)
Low 19.1 28.3 < 0.0001 17.7 32.9 < 0.0001
Middle-low 24.2 27.7 24.3 27.7
Middle-high 27.0 24.5 27.8 22.1
High 29.7 19.5 30.2 17.3
Education level 3)
≤Elementary school 26.3 44.6 < 0.0001 24.3 51.7 < 0.0001
Middle school 9.1 13.1 9.4 12.7
High school 33.3 27.6 34.5 23.7
≥College 31.4 14.8 31.9 12.0
Current smoking 3)5)
Yes 5.0 4.5 0.3980 4.9 4.7 0.6883
Alcohol consumption 3)6)
Yes 39.3 33.8 < 0.0001 39.8 31.9 < 0.0001
Physical activity 3)7)
Yes 26.2 26.6 0.6403 26.9 24.7 0.0013
BMI, kg/m2 8) 21.5 ± 0.0 27.8 ± 0.0 < 0.0001 21.9 ± 0.0 27.5 ± 0.1 < 0.0001
WC, cm8) 74.0 ± 0.1 89.2 ± 0.1 < 0.0001 73.9 ± 0.1 91.8 ± 0.1 < 0.0001
Energy intake, kcal/d 8) 1,713.3 ± 5.9 1,652.0 ± 9.1 < 0.0001 1,712.5 ± 5.8 1,646.8 ± 9.6 < 0.0001 BMI, body mass index; WC, waist circumference
1) The numbers of missing values were respectively 422 for household income, 1,171 for education level, 862 for current smoking, 884 for alcohol consumption, and 1,237 for physical activity according to BMI status, and 421 for household income, 1,172 for education level, 863 for current smoking, 885 for alcohol consumption, and 1,238 for physical activity according to WC status. 2) p-values were obtained from Rao-Scott chi-square test for categorical variables (age, household income, education level, current smoking, alcohol consumption, physical activity) and t-test for continuous variables (BMI, WC, energy intake). 3) Data are presented in percentage (%).
4) Household income: low (first quartile), middle-low (second quartile), middle-high (third quartile), high (fourth quartile) 5) Current smoking:
'yes' meant who ever smoked ≥ 100 cigarettes over lifetime and still smoking. 6) Alcohol consumption: 'yes' meant who drank alcohol more than once a month over the past year 7) Physical activity: 'yes' meant who performed vigorous-intensity activities for ≥ 20 minutes once at least 3 days a week or intermediate-intensity activities for ≥ 0.5 hour once at least 5 days a week (2007 ~ 2013) or who performed vigorous-intensity activities for ≥ 1.25 hour or intermediate-intensity activities for ≥ 2.5 hours per week (2014 ~ 2016). 8) Data are presented in mean ± standard error.
Table 1. General characteristics of the study subjects
결 과
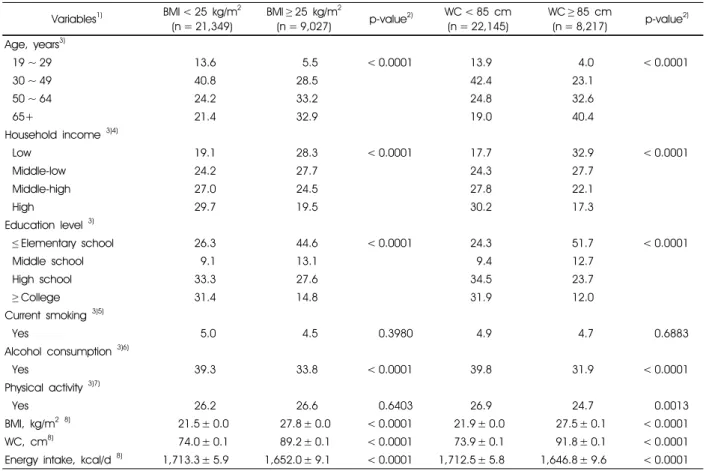
연구대상자의 일반적 특성을 Table 1에 제시하였다.
BMI 기준에 따른 비만군은 9,027명 (29.7%), 정상군은 21,349명 (70.3%)이었으며, 허리둘레 기준에 따른 복부비 만군은 8,217명 (27.1%), 정상군은 22,145명 (72.9%)이었 다. BMI에 따라 비만 여부를 판정한 경우와 허리둘레에 따라 비만 여부를 판정한 경우 모두 비만군과 정상군 사이 에 연령, 가구소득, 교육수준, 월간 음주율에 있어 유의한 차이를 보였다 (p < 0.0001).
Table 2는 비만군과 정상군의 열량 1,000 kcal 당 항산화 비타민 섭취량을 비교한 것이다. BMI 기준에 따른 비만군
과 허리둘레 기준에 따른 복부비만군에서 모두 α-카로틴 (BMI 기준 p = 0.0078, 허리둘레 기준 p < 0.0001), 레티놀 (p < 0.0001), 비타민 E (p < 0.0001), α-토코페롤 (p < 0.0001), γ-토코페롤 (p < 0.0001) 섭취량이 정상군에 비해 유의하게 낮았다. 라이코펜은 복부비만군에서만 정상군에 비해 유 의하게 적게 섭취하고 있었다 (p = 0.0214).
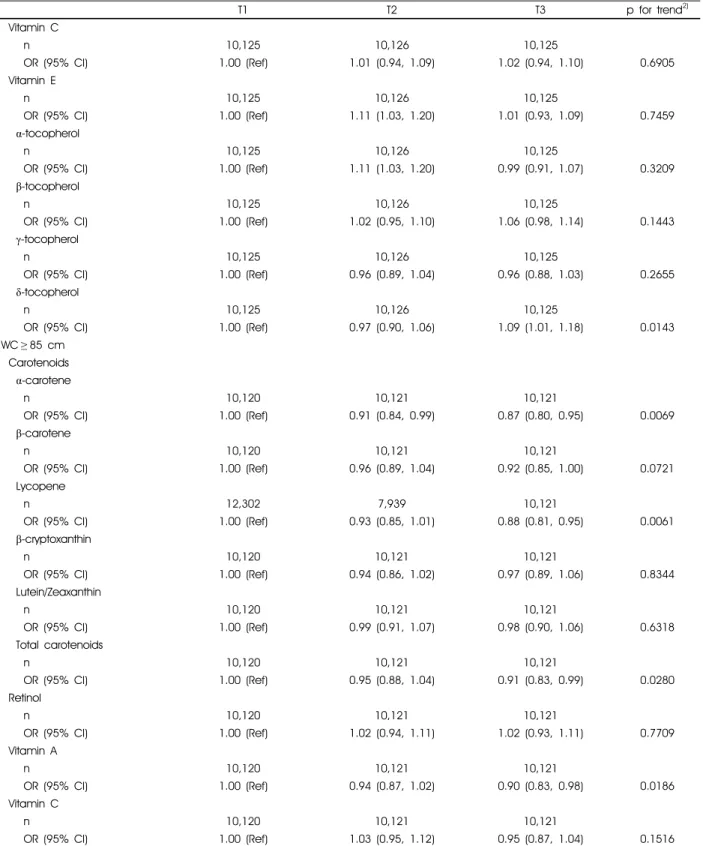
항산화비타민 섭취수준에 따른 비만의 유병률을 비교하 기 위해 섭취수준 삼분위별 OR과 95% 신뢰구간을 Table 3에 제시하였다. α-카로틴 (T3 vs. T1, OR = 0.87, 95% CI:
0.80-0.95), 라이코펜 (T3 vs. T1, OR = 0.88, 95% CI: 0.81- 0.95), 총 카로티노이드 (T3 vs. T1, OR = 0.91, 95% CI: 0.83- 0.99), 비타민 A (T3 vs. T1, OR = 0.90, 95% CI: 0.83-0.98),
T1 T2 T3 p for trend2) BMI ≥ 25 kg/m2
Carotenoids α-carotene
n 10,125 10,126 10,125
OR (95% CI) 1.00 (Ref) 0.97 (0.90, 1.05) 0.97 (0.89, 1.05) 0.5162
β-carotene
n 10,125 10,126 10,125
OR (95% CI) 1.00 (Ref) 0.98 (0.91, 1.06) 1.03 (0.95, 1.11) 0.4239
Lycopene
n 12,320 7931 10,125
OR (95% CI) 1.00 (Ref) 0.99 (0.91, 1.07) 0.89 (0.83, 0.96) 0.0022
β-cryptoxanthin
n 10,125 10,126 10,125
OR (95% CI) 1.00 (Ref) 0.97 (0.89, 1.05) 1.08 (0.99, 1.16) 0.0178
Lutein/Zeaxanthin
n 10,125 10,126 10,125
OR (95% CI) 1.00 (Ref) 1.04 (0.96, 1.12) 1.06 (0.98, 1.14) 0.1857
Total carotenoids
n 10,125 10,126 10,125
OR (95% CI) 1.00 (Ref) 0.97 (0.90, 1.05) 0.96 (0.88, 1.03) 0.3095
Retinol
n 10,125 10,126 10,125
OR (95% CI) 1.00 (Ref) 1.03 (0.95, 1.11) 1.00 (0.92, 1.08) 0.7148
Vitamin A
n 10,125 10,126 10,125
OR (95% CI) 1.00 (Ref) 1.00 (0.93, 1.08) 1.02 (0.94, 1.10) 0.6888
BMI, body mass index; WC, waist circumference; OR, odds ratio; CI, confidence interval
1) Odds ratios were obtained from multiple logistic regression model adjusted for age, household income, education level, smoking, alcohol consumption, and physical activity. 2) p for trend were obtained from the same model as estimation of ORs by using the median nutrient density of each tertile as the independent variable.
Table 3. Odds ratios1) and 95% confidence intervals of obesity according to the tertiles of daily antioxidant vitamin intake per 1,000 kcal BMI < 25 kg/m2 BMI ≥ 25 kg/m2 p-value1) WC < 85 cm WC ≥ 85 cm p-value1) Carotenoid (μg/d/1,000 kcal)
α-carotene 324.1 ± 8.12) 280.8 ± 14.2 0.0078 329.6 ± 8.0 257.0 ± 15.1 < 0.0001
β-carotene 1,958.6 ± 24.5 2,047.7 ± 41.4 0.1683 1,971.8 ± 23.9 2,022.5 ± 44.9 0.5625
Lycopene 1,463.0 ± 47.8 1,350.7 ± 88.3 0.1996 1,484.4 ± 48.5 1,273.9 ± 89.6 0.0214
β-cryptoxanthin 313.6 ± 9.6 358.0 ± 13.2 0.0050 317.5 ± 9.4 353.8 ± 13.9 0.0397
Lutein/Zeaxanthin 1,208.4 ± 18.6 1,319.5 ± 32.2 0.0112 1,223.3 ± 17.6 1,290.6 ± 34.9 0.2043 Total carotenoids 5,267.7 ± 62.3 5,356.7 ± 115.9 0.8106 5,326.6 ± 62.7 5,197.8 ± 118.1 0.1509 Retinol (μg/d/1,000 kcal) 58.6 ± 0.9 50.5 ± 1.6 < 0.0001 59.0 ± 0.9 48.7 ± 1.7 < 0.0001 Vitamin A (μg RAE/d/1,000 kcal) 248.4 ± 2.4 247.8 ± 4.2 0.5964 250.3 ± 2.3 242.7 ± 4.5 0.0696
Vitamin C (mg/d/1,000 kcal) 67.6 ± 0.9 69.5 ± 1.2 0.5868 68.3 ± 0.9 67.8 ± 1.3 0.1494
Vitamin E (mg α-TE/d/1,000 kcal) 3.5 ± 0.0 3.4 ± 0.0 < 0.0001 3.6 ± 0.0 3.4 ± 0.0 < 0.0001 α-tocopherol (mg/d/1,000 kcal) 3.1 ± 0.0 3.0 ± 0.0 < 0.0001 3.1 ± 0.0 2.9 ± 0.0 < 0.0001 β-tocopherol (mg/d/1,000 kcal) 0.2 ± 0.0 0.3 ± 0.0 0.0112 0.3 ± 0.0 0.3 ± 0.0 0.2027 γ-tocopherol (mg/d/1,000 kcal) 2.6 ± 0.0 2.5 ± 0.0 < 0.0001 2.7 ± 0.0 2.4 ± 0.0 < 0.0001 δ-tocopherol (mg/d/1,000 kcal) 1.6 ± 0.0 1.7 ± 0.0 0.0487 1.6 ± 0.0 1.7 ± 0.0 0.3785 BMI, body mass index; WC, waist circumference; RAE, retinol activity equivalent; α-TE, α-tocopherol equivalent
1) p-values were obtained from ANCOVA adjusted for age, household income, education level, current smoking, alcohol consumption, and physical activity. 2) Data are presented in mean ± standard error.
Table 2. Daily antioxidant vitamin intake per 1,000 kcal according to obesity status
T1 T2 T3 p for trend2) Vitamin C
n 10,125 10,126 10,125
OR (95% CI) 1.00 (Ref) 1.01 (0.94, 1.09) 1.02 (0.94, 1.10) 0.6905
Vitamin E
n 10,125 10,126 10,125
OR (95% CI) 1.00 (Ref) 1.11 (1.03, 1.20) 1.01 (0.93, 1.09) 0.7459
α-tocopherol
n 10,125 10,126 10,125
OR (95% CI) 1.00 (Ref) 1.11 (1.03, 1.20) 0.99 (0.91, 1.07) 0.3209
β-tocopherol
n 10,125 10,126 10,125
OR (95% CI) 1.00 (Ref) 1.02 (0.95, 1.10) 1.06 (0.98, 1.14) 0.1443
γ-tocopherol
n 10,125 10,126 10,125
OR (95% CI) 1.00 (Ref) 0.96 (0.89, 1.04) 0.96 (0.88, 1.03) 0.2655
δ-tocopherol
n 10,125 10,126 10,125
OR (95% CI) 1.00 (Ref) 0.97 (0.90, 1.06) 1.09 (1.01, 1.18) 0.0143
WC ≥ 85 cm Carotenoids
α-carotene
n 10,120 10,121 10,121
OR (95% CI) 1.00 (Ref) 0.91 (0.84, 0.99) 0.87 (0.80, 0.95) 0.0069
β-carotene
n 10,120 10,121 10,121
OR (95% CI) 1.00 (Ref) 0.96 (0.89, 1.04) 0.92 (0.85, 1.00) 0.0721
Lycopene
n 12,302 7,939 10,121
OR (95% CI) 1.00 (Ref) 0.93 (0.85, 1.01) 0.88 (0.81, 0.95) 0.0061
β-cryptoxanthin
n 10,120 10,121 10,121
OR (95% CI) 1.00 (Ref) 0.94 (0.86, 1.02) 0.97 (0.89, 1.06) 0.8344
Lutein/Zeaxanthin
n 10,120 10,121 10,121
OR (95% CI) 1.00 (Ref) 0.99 (0.91, 1.07) 0.98 (0.90, 1.06) 0.6318
Total carotenoids
n 10,120 10,121 10,121
OR (95% CI) 1.00 (Ref) 0.95 (0.88, 1.04) 0.91 (0.83, 0.99) 0.0280
Retinol
n 10,120 10,121 10,121
OR (95% CI) 1.00 (Ref) 1.02 (0.94, 1.11) 1.02 (0.93, 1.11) 0.7709
Vitamin A
n 10,120 10,121 10,121
OR (95% CI) 1.00 (Ref) 0.94 (0.87, 1.02) 0.90 (0.83, 0.98) 0.0186
Vitamin C
n 10,120 10,121 10,121
OR (95% CI) 1.00 (Ref) 1.03 (0.95, 1.12) 0.95 (0.87, 1.04) 0.1516
BMI, body mass index; WC, waist circumference; OR, odds ratio; CI, confidence interval
1) Odds ratios were obtained from multiple logistic regression model adjusted for age, household income, education level, smoking, alcohol consumption, and physical activity. 2) p for trend were obtained from the same model as estimation of ORs by using the median nutrient density of each tertile as the independent variable.
Table 3. Odds ratios1) and 95% confidence intervals of obesity according to the tertiles of daily antioxidant vitamin intake per 1,000 kcal (continued)
T1 T2 T3 p for trend2) Vitamin E
n 10,120 10,121 10,121
OR (95% CI) 1.00 (Ref) 1.02 (0.94, 1.11) 0.96 (0.88, 1.04) 0.2372
α-tocopherol
n 10,120 10,121 10,121
OR (95% CI) 1.00 (Ref) 1.02 (0.94, 1.11) 0.94 (0.86, 1.02) 0.0814
β-tocopherol
n 10,120 10,121 10,121
OR (95% CI) 1.00 (Ref) 0.98 (0.91, 1.07) 0.98 (0.90, 1.06) 0.6445
γ-tocopherol
n 10,120 10,121 10,121
OR (95% CI) 1.00 (Ref) 0.97 (0.89, 1.05) 0.92 (0.84, 0.99) 0.0348
δ-tocopherol
n 10,120 10,121 10,121
OR (95% CI) 1.00 (Ref) 1.01 (0.93, 1.10) 1.05 (0.97, 1.15) 0.1955
BMI, body mass index; WC, waist circumference; OR, odds ratio; CI, confidence interval
1) Odds ratios were obtained from multiple logistic regression model adjusted for age, household income, education level, smoking, alcohol consumption, and physical activity. 2) p for trend were obtained from the same model as estimation of ORs by using the median nutrient density of each tertile as the independent variable.
Table 3. Odds ratios1) and 95% confidence intervals of obesity according to the tertiles of daily antioxidant vitamin intake per 1,000 kcal (continued)
α-carotene (μg/d) β-carotene (μg/d) Lycopene (μg/d)
BMI < 25 kg/m2 BMI ≥ 25 kg/m2 BMI < 25 kg/m2 BMI ≥ 25 kg/m2 BMI < 25 kg/m2 BMI ≥ 25 kg/m2 Plant-derived foods
Grains 4.2 ± 1.11) 3.7 ± 1.1 28.9 ± 1.4 23.1 ± 1.4** 6.3 ± 1.5 5.0 ± 1.5
Vegetables 432.7 ± 12.7 349.3 ± 16.6**** 2,293.6 ± 34.4 2,362.1 ± 56.9 1,435.5 ± 55.7 1,206.1 ± 114.9
Fruits 26.8 ± 1.1 26.6 ± 1.4 172.8 ± 6.7 181.9 ± 9.4 841.8 ± 45.0 759.2 ± 56.8
Seaweed 65.1 ± 1.5 58.5 ± 2.1* 264.5 ± 5.4 257.9 ± 8.6 0.0 ± 0.0 0.0 ± 0.0
Etc2) 4.5 ± 0.4 5.5 ± 0.6 21.0 ± 1.2 19.7 ± 1.2 0.0 ± 0.0 0.0 ± 0.0
Animal-derived foods
Meats 0.0 ± 0.0 0.0 ± 0.0 1.5 ± 0.1 1.3 ± 0.2 0.0 ± 0.0 0.0 ± 0.0
Eggs 0.0 ± 0.0 0.0 ± 0.0 3.7 ± 0.1 3.1 ± 0.1**** 0.0 ± 0.0 0.0 ± 0.0
Fish and shellfish 0.0 ± 0.0 0.0 ± 0.0 1.8 ± 0.1 2.6 ± 0.6 0.0 ± 0.0 0.0 ± 0.0
Milk and dairy products 0.0 ± 0.0 0.0 ± 0.0 4.3 ± 0.1 2.8 ± 0.1**** 0.0 ± 0.0 0.0 ± 0.0
Others
Oils 0.0 ± 0.0 0.0 ± 0.0 0.7 ± 0.0 0.5 ± 0.0**** 0.0 ± 0.0 0.0 ± 0.0
Beverage and alcohol 24.5 ± 5.2 33.5 ± 26.9 62.2 ± 11.2 81.5 ± 57.8 0.0 ± 0.0 0.0 ± 0.0
Seasoning 0.1 ± 0.0 0.0 ± 0.0** 402.0 ± 5.6 410.0 ± 10.3 181.7 ± 6.9 108.4 ± 7.5****
Etc3) 1.1 ± 0.4 0.2 ± 0.1* 2.6 ± 0.4 3.0 ± 0.6 1.2 ± 0.5 0.4 ± 0.3
BMI, body mass index
1) Data are presented in mean ± standard error. p-values were obtained from ANCOVA adjusted for age, household income, education level, current smoking, alcohol consumption, and physical activity. Asterisks are marked if mean intakes of the group of BMI ≥ 25 kg/m2 were significantly lower than the group of BMI < 25 kg/m2 (*p < 0.05, **p < 0.01, ***p < 0.001, ****p < 0.0001). 2) Etc among plant-derived foods: potatoes and starch, legumes, seeds and nuts 3) Etc among others: sweets, mushrooms, processed food, others
Table 4. Antioxidant vitamin intakes from each food group according to obesity status by body mass index
γ-토코페롤 (T3 vs. T1, OR = 0.92, 95% CI: 0.84-0.99) 섭 취량이 높은 군에서 복부비만의 유병률이 유의하게 낮은 것으로 나타났다. 라이코펜은 BMI 기준에 따른 비만과도 음의 관련성을 갖고 있었다 (T3 vs. T1, OR = 0.89, 95%
CI: 0.83-0.96).
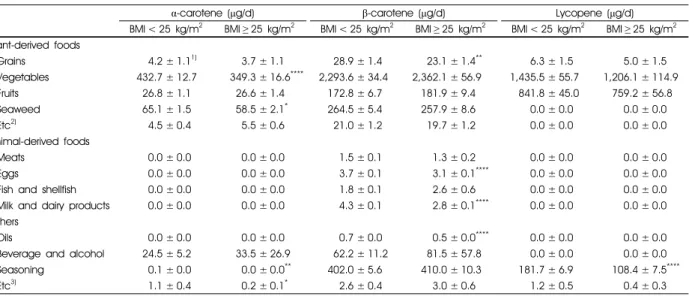
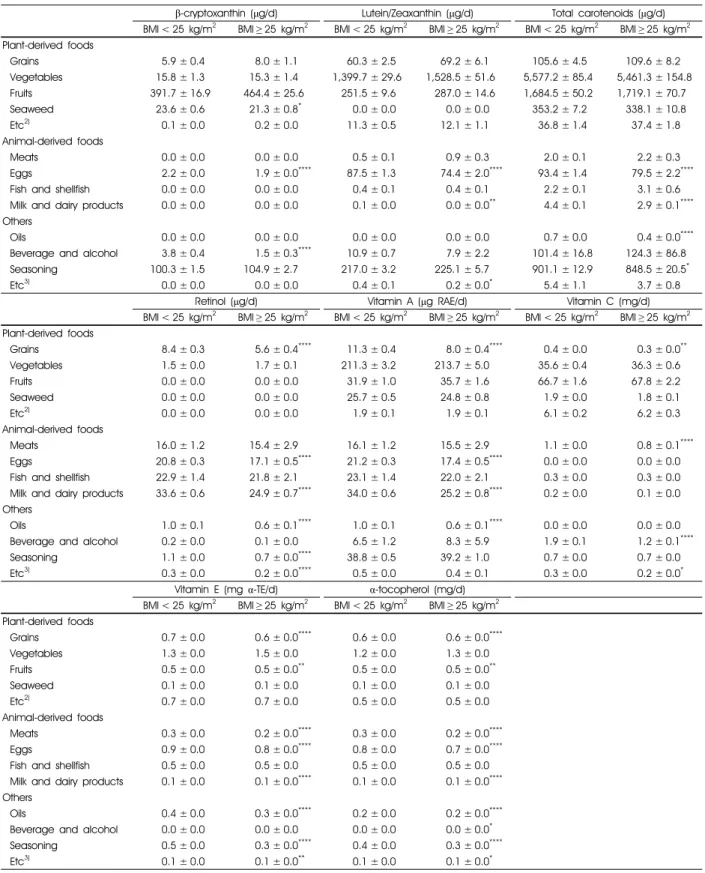
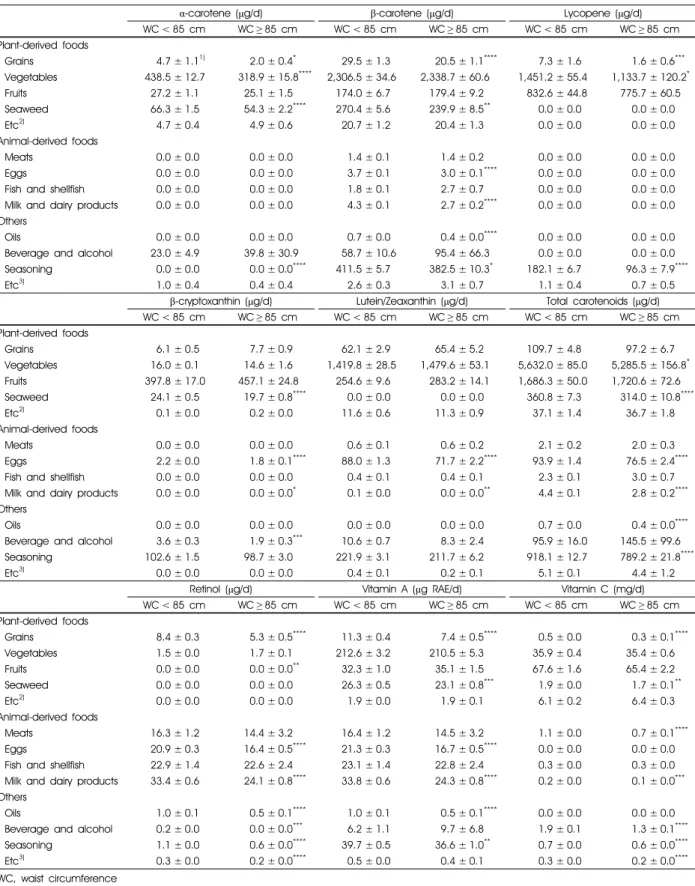
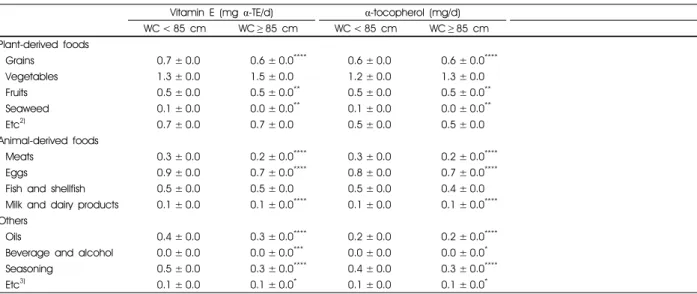
Table 4와 5는 비만군과 정상군의 식품군별 항산화비타 민 섭취량을 비교한 것이다. BMI 기준에 따른 비만군과 허리둘레 기준에 따른 복부비만군 모두 정상군에 비해 대
체로 항산화비타민 섭취량이 낮았다. 특히 난류를 통해 섭취하는 루테인/제아잔틴 (p < 0.0001)과 레티놀 (p <
0.0001), 우유류를 통해 섭취하는 레티놀 (p < 0.0001), 조 미료류를 통한 라이코펜 (p < 0.0001), 곡류를 통해 섭취하 는 레티놀 (p < 0.0001) 섭취량이 군별로 유의한 차이가 있 었다. 분석 결과 β-토코페롤, γ-토코페롤, δ-토코페롤의 개 별 식품군별 섭취량은 매우 적어 결과를 제시하지 않았다.
β-cryptoxanthin (μg/d) Lutein/Zeaxanthin (μg/d) Total carotenoids (μg/d) BMI < 25 kg/m2 BMI ≥ 25 kg/m2 BMI < 25 kg/m2 BMI ≥ 25 kg/m2 BMI < 25 kg/m2 BMI ≥ 25 kg/m2 Plant-derived foods
Grains 5.9 ± 0.4 8.0 ± 1.1 60.3 ± 2.5 69.2 ± 6.1 105.6 ± 4.5 109.6 ± 8.2
Vegetables 15.8 ± 1.3 15.3 ± 1.4 1,399.7 ± 29.6 1,528.5 ± 51.6 5,577.2 ± 85.4 5,461.3 ± 154.8
Fruits 391.7 ± 16.9 464.4 ± 25.6 251.5 ± 9.6 287.0 ± 14.6 1,684.5 ± 50.2 1,719.1 ± 70.7
Seaweed 23.6 ± 0.6 21.3 ± 0.8* 0.0 ± 0.0 0.0 ± 0.0 353.2 ± 7.2 338.1 ± 10.8
Etc2) 0.1 ± 0.0 0.2 ± 0.0 11.3 ± 0.5 12.1 ± 1.1 36.8 ± 1.4 37.4 ± 1.8
Animal-derived foods
Meats 0.0 ± 0.0 0.0 ± 0.0 0.5 ± 0.1 0.9 ± 0.3 2.0 ± 0.1 2.2 ± 0.3
Eggs 2.2 ± 0.0 1.9 ± 0.0**** 87.5 ± 1.3 74.4 ± 2.0**** 93.4 ± 1.4 79.5 ± 2.2****
Fish and shellfish 0.0 ± 0.0 0.0 ± 0.0 0.4 ± 0.1 0.4 ± 0.1 2.2 ± 0.1 3.1 ± 0.6
Milk and dairy products 0.0 ± 0.0 0.0 ± 0.0 0.1 ± 0.0 0.0 ± 0.0** 4.4 ± 0.1 2.9 ± 0.1****
Others
Oils 0.0 ± 0.0 0.0 ± 0.0 0.0 ± 0.0 0.0 ± 0.0 0.7 ± 0.0 0.4 ± 0.0****
Beverage and alcohol 3.8 ± 0.4 1.5 ± 0.3**** 10.9 ± 0.7 7.9 ± 2.2 101.4 ± 16.8 124.3 ± 86.8
Seasoning 100.3 ± 1.5 104.9 ± 2.7 217.0 ± 3.2 225.1 ± 5.7 901.1 ± 12.9 848.5 ± 20.5*
Etc3) 0.0 ± 0.0 0.0 ± 0.0 0.4 ± 0.1 0.2 ± 0.0* 5.4 ± 1.1 3.7 ± 0.8
Retinol (μg/d) Vitamin A (μg RAE/d) Vitamin C (mg/d)
BMI < 25 kg/m2 BMI ≥ 25 kg/m2 BMI < 25 kg/m2 BMI ≥ 25 kg/m2 BMI < 25 kg/m2 BMI ≥ 25 kg/m2 Plant-derived foods
Grains 8.4 ± 0.3 5.6 ± 0.4**** 11.3 ± 0.4 8.0 ± 0.4**** 0.4 ± 0.0 0.3 ± 0.0**
Vegetables 1.5 ± 0.0 1.7 ± 0.1 211.3 ± 3.2 213.7 ± 5.0 35.6 ± 0.4 36.3 ± 0.6
Fruits 0.0 ± 0.0 0.0 ± 0.0 31.9 ± 1.0 35.7 ± 1.6 66.7 ± 1.6 67.8 ± 2.2
Seaweed 0.0 ± 0.0 0.0 ± 0.0 25.7 ± 0.5 24.8 ± 0.8 1.9 ± 0.0 1.8 ± 0.1
Etc2) 0.0 ± 0.0 0.0 ± 0.0 1.9 ± 0.1 1.9 ± 0.1 6.1 ± 0.2 6.2 ± 0.3
Animal-derived foods
Meats 16.0 ± 1.2 15.4 ± 2.9 16.1 ± 1.2 15.5 ± 2.9 1.1 ± 0.0 0.8 ± 0.1****
Eggs 20.8 ± 0.3 17.1 ± 0.5**** 21.2 ± 0.3 17.4 ± 0.5**** 0.0 ± 0.0 0.0 ± 0.0
Fish and shellfish 22.9 ± 1.4 21.8 ± 2.1 23.1 ± 1.4 22.0 ± 2.1 0.3 ± 0.0 0.3 ± 0.0
Milk and dairy products 33.6 ± 0.6 24.9 ± 0.7**** 34.0 ± 0.6 25.2 ± 0.8**** 0.2 ± 0.0 0.1 ± 0.0 Others
Oils 1.0 ± 0.1 0.6 ± 0.1**** 1.0 ± 0.1 0.6 ± 0.1**** 0.0 ± 0.0 0.0 ± 0.0
Beverage and alcohol 0.2 ± 0.0 0.1 ± 0.0 6.5 ± 1.2 8.3 ± 5.9 1.9 ± 0.1 1.2 ± 0.1****
Seasoning 1.1 ± 0.0 0.7 ± 0.0**** 38.8 ± 0.5 39.2 ± 1.0 0.7 ± 0.0 0.7 ± 0.0
Etc3) 0.3 ± 0.0 0.2 ± 0.0**** 0.5 ± 0.0 0.4 ± 0.1 0.3 ± 0.0 0.2 ± 0.0*
Vitamin E (mg α-TE/d) α-tocopherol (mg/d) BMI < 25 kg/m2 BMI ≥ 25 kg/m2 BMI < 25 kg/m2 BMI ≥ 25 kg/m2 Plant-derived foods
Grains 0.7 ± 0.0 0.6 ± 0.0**** 0.6 ± 0.0 0.6 ± 0.0****
Vegetables 1.3 ± 0.0 1.5 ± 0.0 1.2 ± 0.0 1.3 ± 0.0
Fruits 0.5 ± 0.0 0.5 ± 0.0** 0.5 ± 0.0 0.5 ± 0.0**
Seaweed 0.1 ± 0.0 0.1 ± 0.0 0.1 ± 0.0 0.1 ± 0.0
Etc2) 0.7 ± 0.0 0.7 ± 0.0 0.5 ± 0.0 0.5 ± 0.0
Animal-derived foods
Meats 0.3 ± 0.0 0.2 ± 0.0**** 0.3 ± 0.0 0.2 ± 0.0****
Eggs 0.9 ± 0.0 0.8 ± 0.0**** 0.8 ± 0.0 0.7 ± 0.0****
Fish and shellfish 0.5 ± 0.0 0.5 ± 0.0 0.5 ± 0.0 0.5 ± 0.0
Milk and dairy products 0.1 ± 0.0 0.1 ± 0.0**** 0.1 ± 0.0 0.1 ± 0.0****
Others
Oils 0.4 ± 0.0 0.3 ± 0.0**** 0.2 ± 0.0 0.2 ± 0.0****
Beverage and alcohol 0.0 ± 0.0 0.0 ± 0.0 0.0 ± 0.0 0.0 ± 0.0*
Seasoning 0.5 ± 0.0 0.3 ± 0.0**** 0.4 ± 0.0 0.3 ± 0.0****
Etc3) 0.1 ± 0.0 0.1 ± 0.0** 0.1 ± 0.0 0.1 ± 0.0*
BMI, body mass index
1) Data are presented in mean ± standard error. p-values were obtained from ANCOVA adjusted for age, household income, education level, current smoking, alcohol consumption, and physical activity. Asterisks are marked if mean intakes of the group of BMI ≥ 25 kg/m2 were significantly lower than the group of BMI < 25 kg/m2 (*p < 0.05, **p < 0.01, ***p < 0.001, ****p < 0.0001). 2) Etc among plant-derived foods: potatoes and starch, legumes, seeds and nuts 3) Etc among others: sweets, mushrooms, processed food, others
Table 4. Antioxidant vitamin intakes from each food group according to obesity status by body mass index (continued)
α-carotene (μg/d) β-carotene (μg/d) Lycopene (μg/d) WC < 85 cm WC ≥ 85 cm WC < 85 cm WC ≥ 85 cm WC < 85 cm WC ≥ 85 cm Plant-derived foods
Grains 4.7 ± 1.11) 2.0 ± 0.4* 29.5 ± 1.3 20.5 ± 1.1**** 7.3 ± 1.6 1.6 ± 0.6***
Vegetables 438.5 ± 12.7 318.9 ± 15.8**** 2,306.5 ± 34.6 2,338.7 ± 60.6 1,451.2 ± 55.4 1,133.7 ± 120.2*
Fruits 27.2 ± 1.1 25.1 ± 1.5 174.0 ± 6.7 179.4 ± 9.2 832.6 ± 44.8 775.7 ± 60.5
Seaweed 66.3 ± 1.5 54.3 ± 2.2**** 270.4 ± 5.6 239.9 ± 8.5** 0.0 ± 0.0 0.0 ± 0.0
Etc2) 4.7 ± 0.4 4.9 ± 0.6 20.7 ± 1.2 20.4 ± 1.3 0.0 ± 0.0 0.0 ± 0.0
Animal-derived foods
Meats 0.0 ± 0.0 0.0 ± 0.0 1.4 ± 0.1 1.4 ± 0.2 0.0 ± 0.0 0.0 ± 0.0
Eggs 0.0 ± 0.0 0.0 ± 0.0 3.7 ± 0.1 3.0 ± 0.1**** 0.0 ± 0.0 0.0 ± 0.0
Fish and shellfish 0.0 ± 0.0 0.0 ± 0.0 1.8 ± 0.1 2.7 ± 0.7 0.0 ± 0.0 0.0 ± 0.0
Milk and dairy products 0.0 ± 0.0 0.0 ± 0.0 4.3 ± 0.1 2.7 ± 0.2**** 0.0 ± 0.0 0.0 ± 0.0
Others
Oils 0.0 ± 0.0 0.0 ± 0.0 0.7 ± 0.0 0.4 ± 0.0**** 0.0 ± 0.0 0.0 ± 0.0
Beverage and alcohol 23.0 ± 4.9 39.8 ± 30.9 58.7 ± 10.6 95.4 ± 66.3 0.0 ± 0.0 0.0 ± 0.0
Seasoning 0.0 ± 0.0 0.0 ± 0.0**** 411.5 ± 5.7 382.5 ± 10.3* 182.1 ± 6.7 96.3 ± 7.9****
Etc3) 1.0 ± 0.4 0.4 ± 0.4 2.6 ± 0.3 3.1 ± 0.7 1.1 ± 0.4 0.7 ± 0.5
β-cryptoxanthin (μg/d) Lutein/Zeaxanthin (μg/d) Total carotenoids (μg/d) WC < 85 cm WC ≥ 85 cm WC < 85 cm WC ≥ 85 cm WC < 85 cm WC ≥ 85 cm Plant-derived foods
Grains 6.1 ± 0.5 7.7 ± 0.9 62.1 ± 2.9 65.4 ± 5.2 109.7 ± 4.8 97.2 ± 6.7
Vegetables 16.0 ± 0.1 14.6 ± 1.6 1,419.8 ± 28.5 1,479.6 ± 53.1 5,632.0 ± 85.0 5,285.5 ± 156.8*
Fruits 397.8 ± 17.0 457.1 ± 24.8 254.6 ± 9.6 283.2 ± 14.1 1,686.3 ± 50.0 1,720.6 ± 72.6
Seaweed 24.1 ± 0.5 19.7 ± 0.8**** 0.0 ± 0.0 0.0 ± 0.0 360.8 ± 7.3 314.0 ± 10.8****
Etc2) 0.1 ± 0.0 0.2 ± 0.0 11.6 ± 0.6 11.3 ± 0.9 37.1 ± 1.4 36.7 ± 1.8
Animal-derived foods
Meats 0.0 ± 0.0 0.0 ± 0.0 0.6 ± 0.1 0.6 ± 0.2 2.1 ± 0.2 2.0 ± 0.3
Eggs 2.2 ± 0.0 1.8 ± 0.1**** 88.0 ± 1.3 71.7 ± 2.2**** 93.9 ± 1.4 76.5 ± 2.4****
Fish and shellfish 0.0 ± 0.0 0.0 ± 0.0 0.4 ± 0.1 0.4 ± 0.1 2.3 ± 0.1 3.0 ± 0.7
Milk and dairy products 0.0 ± 0.0 0.0 ± 0.0* 0.1 ± 0.0 0.0 ± 0.0** 4.4 ± 0.1 2.8 ± 0.2****
Others
Oils 0.0 ± 0.0 0.0 ± 0.0 0.0 ± 0.0 0.0 ± 0.0 0.7 ± 0.0 0.4 ± 0.0****
Beverage and alcohol 3.6 ± 0.3 1.9 ± 0.3*** 10.6 ± 0.7 8.3 ± 2.4 95.9 ± 16.0 145.5 ± 99.6
Seasoning 102.6 ± 1.5 98.7 ± 3.0 221.9 ± 3.1 211.7 ± 6.2 918.1 ± 12.7 789.2 ± 21.8****
Etc3) 0.0 ± 0.0 0.0 ± 0.0 0.4 ± 0.1 0.2 ± 0.1 5.1 ± 0.1 4.4 ± 1.2
Retinol (μg/d) Vitamin A (μg RAE/d) Vitamin C (mg/d)
WC < 85 cm WC ≥ 85 cm WC < 85 cm WC ≥ 85 cm WC < 85 cm WC ≥ 85 cm Plant-derived foods
Grains 8.4 ± 0.3 5.3 ± 0.5**** 11.3 ± 0.4 7.4 ± 0.5**** 0.5 ± 0.0 0.3 ± 0.1****
Vegetables 1.5 ± 0.0 1.7 ± 0.1 212.6 ± 3.2 210.5 ± 5.3 35.9 ± 0.4 35.4 ± 0.6
Fruits 0.0 ± 0.0 0.0 ± 0.0** 32.3 ± 1.0 35.1 ± 1.5 67.6 ± 1.6 65.4 ± 2.2
Seaweed 0.0 ± 0.0 0.0 ± 0.0 26.3 ± 0.5 23.1 ± 0.8*** 1.9 ± 0.0 1.7 ± 0.1**
Etc2) 0.0 ± 0.0 0.0 ± 0.0 1.9 ± 0.0 1.9 ± 0.1 6.1 ± 0.2 6.4 ± 0.3
Animal-derived foods
Meats 16.3 ± 1.2 14.4 ± 3.2 16.4 ± 1.2 14.5 ± 3.2 1.1 ± 0.0 0.7 ± 0.1****
Eggs 20.9 ± 0.3 16.4 ± 0.5**** 21.3 ± 0.3 16.7 ± 0.5**** 0.0 ± 0.0 0.0 ± 0.0
Fish and shellfish 22.9 ± 1.4 22.6 ± 2.4 23.1 ± 1.4 22.8 ± 2.4 0.3 ± 0.0 0.3 ± 0.0
Milk and dairy products 33.4 ± 0.6 24.1 ± 0.8**** 33.8 ± 0.6 24.3 ± 0.8**** 0.2 ± 0.0 0.1 ± 0.0***
Others
Oils 1.0 ± 0.1 0.5 ± 0.1**** 1.0 ± 0.1 0.5 ± 0.1**** 0.0 ± 0.0 0.0 ± 0.0
Beverage and alcohol 0.2 ± 0.0 0.0 ± 0.0*** 6.2 ± 1.1 9.7 ± 6.8 1.9 ± 0.1 1.3 ± 0.1****
Seasoning 1.1 ± 0.0 0.6 ± 0.0**** 39.7 ± 0.5 36.6 ± 1.0** 0.7 ± 0.0 0.6 ± 0.0****
Etc3) 0.3 ± 0.0 0.2 ± 0.0**** 0.5 ± 0.0 0.4 ± 0.1 0.3 ± 0.0 0.2 ± 0.0****
WC, waist circumference
1) Data are presented in mean ± standard error. p-values were obtained from ANCOVA adjusted for age, household income, education level, current smoking, alcohol consumption, and physical activity. Asterisks ae marked if mean intakes of the group of WC ≥ 85 cm were significantly lower than the group of WC < 85 cm (*p < 0.05, **p < 0.01, ***p < 0.001, ****p < 0.0001). 2) Etc among plant-derived foods: potatoes and starch, legumes, seeds and nuts 3) Etc among others: sweets, mushrooms, processed food, others
Table 5. Antioxidant vitamin intakes from each food group according to obesity status by waist circumference level