pISSN 2288-3886 / eISSN 2288-3959
Association between nutrient intakes and prevalence of depressive disorder in Korean adults: 2014 Korean National Health and Nutrition Examination Survey *
Park, Seon-Joo1· Choi, Ji Hee1· Lee, Jae Yeon2· Lee, Changho3· Lee, Hae-Jeung1†
1Department of Food and Nutrition,College of BioNano Technology, Gachon University, Seongnam, Gyeonggi 13120, Korea
2Department of Public Health, General Graduate School, Kyungpook National University, Daegu 41566, Korea
3Research Group of Functional Food Materials, Korea Food Research Institute, Wanju, Jeonbuk 55365, Korea
ABSTRACT
Objective: Dietary nutrients may play a significant role in depressive disorders. However, sufficient evidences in epidemiological studies are limited. We investigated the cross-sectional association between dietary nutrients and the prevalence of depressive disorder in Korean adults using representative Korean data. Methods: Participants were 2,938 adults aged 19 ~ 64 years from the Korea National Health and Nutrition Examination Survey (KNHANES) conducted in 2014.
Dietary intakes were assessed using 24-h recall method. Depressive disorder was assessed using Patients Health Questionnaire-9 (PHQ-9, self-depression test) as applied in 2014 KNHANES only. We defined depressive disorder as having a PHQ-9 score of ≥ 10, which was characterized as moderate depression and more. A multivariate logistic regression analysis was performed to estimate the adjusted odd ratios (ORs) and 95% confidence interval (CIs) of depressive disorder. Results:
Among the 2,938 subjects, 170 were identified as having depressive disorder. The multivariate-adjusted regression analysis demonstrated that the risk of depression was significantly associated with riboflavin (OR = 0.44, 95% CI: 0.24-0.85, p for trend
= 0.018), thiamin (OR = 0.48, 95% CI: 0.23-0.99, p for trend = 0.045), and vitamin C (OR = 0.57, 95% CI: 0.34-0.95, p for trend
= 0.025) in the highest versus lowest tertiles of intake. Conclusion: The high consumption of riboflavin, thiamin, and vitamin C was associated with the low prevalence of depressive disorder in Korean adults.
KEY WORDS: depressive disorder, riboflavin, thiamin, vitamin C, KNHANES
Received: September 10, 2018 / Revised: September 21, 2018 / Accepted: October 2, 2018
* This work was supported by Korea Food Research Institute (E0164500-03), Republic of Korea and the Creative Industrial Technology Development Program (10053249, Development of Personalized Healthcare System Exploiting User Life-log and Open Government Data for Business Service Model Proof on Whole Life Cycle Care) funded by the Ministry of Trade, Industry & Energy (MOTIE, Korea).
†To whom correspondence should be addressed.
tel: +82-31-750-5968, e-mail: [email protected], [email protected]
© 2018 The Korean Nutrition Society
This is an Open Access article distributed under the terms of the Creative Commons Attribution Non-Commercial License (http://creative- commons. org/licenses/by-nc/3.0/) which permits unrestricted non-commercial use, distribution, and reproduction in any medium, provided the original work is properly cited.
Introduction
Depression is a disease burden categorized as a common mental disorder worldwide. The World Health Organization estimated 300 million people to have depressive symptoms regardless of ages.1 Complex causes of depressive disorder include biological, heredity, environmental, and physical factors.2 Recently, the importance of dietary information on mental health is also highlighted as a critical topic, however, few scientific works have concentrated on dietary nutrient intakes and depressive disorder.
Several assumptions exist on the association between dietary nutrient intakes and prevalence of depressive disorder. In a recent review, dietary nutrient intakes, including riboflavin, and thiamin were suggested to be
involved in some coenzymes of the brain activity and neurotransmitters, which are types of monoamines, that regulate mood and are more likely to be synthesized from enzyme activation.3 In other words, riboflavin, iron, and homocysteine in methylation are required for the synthesis of serotonin, catecholamine, and monoamine neurotrans- mitters. These mechanisms suggest a link between nutrient intakes and depressive disorder.4
Few emerging pieces of evidence revealed that the dietary nutrients are associated with a depressive disorder in epidemiological studies. Several cross-sectional studies showed an association between insufficient intake of dietary riboflavin and depressive disorder. In the Japanese population, riboflavin intake and depressive symptoms are inversely related in girls, with no association in boys.5
Another Japanese study showed an inverse association between consumption of riboflavin and postpartum depression in women.6
Some studies showed that the thiamin supplement improves mood even in individuals who were well nourished before the supplement.7,8 In randomized controlled trials, after 6 weeks, symptoms of depression improved after supplementation of adjuvant thiamin compared to that after supplementation of the placebo.9 In China, deficiency of thiamin was associated with a high prevalence of depressive symptoms in elderly people.10
Vitamin C deficiencies in older women are also associated with symptoms of depression.11 A recent randomized controlled trial, reported that vitamin C may be an effective adjuvant agent for treating a major depressive disorder in pediatric patients.12 A cross-sectional study conducted among 1,634 older Japanese reported an inverse association between dietary intakes of vitamin C and depressive symptoms only in overweight women.13
There have been few studies conducted to examine the association between nutrient intakes and depression in Korea.14,15 Therefore, we investigated the association between dietary nutrients and depressive disorder among Korean adults using data from the Korea National Health and Nutrition Examination Survey (KNHANES), which is a nationally representative survey data.
Methods
Study population
The KNHANES is a nationally representative and reliable study that collected socio-demographic characteristics, health behaviors, health status, and nutrition information of Korean population. The sample of KNHANES was selected by multistage, stratified, cluster-sampling design with proportional distributions based on the National Census Registry. In this study, we used the KNHANES data collected in 2014, which was recently opened (http://knhanes.cdc.go.kr), because PHQ-9 (Patients Health Questionnaire-9) was applied in 2014 KNHANES only.
In the 2014 KNHANES, 7,550 individuals participated, and 3,160 individuals aged under < 19 and > 65 years were not included. Then, we excluded 634 subjects who had unrealistic energy intake (< 500 or > 5,000 kcal/day), 587 subjects who did not complete information of PHQ-9, and 229 subjects who did not have data of potential
confounding factors such as income, education, stress, and chronic disease. Finally, a total of 2,938 adults had complete information for analysis. All the subjects provided informed consent.
This study was conducted under the Ethical Principles for Medical Research Involving Human Subjects by the Helsinki Declaration. No requirement of Institutional Review Board (IRB) in this study, since KNHANES data were publicly available online. The Institutional Review Board of Korea Centers for Disease Control and Prevention opened the approval number to the public, 2013- 12EXP-03-5C.
Definition of depressive disorder
Depressive disorder was measured in each individual using the self-reported scale, the Patient Health Question- naire 9-item scale (PHQ-9). This tool was validated as an appropriate diagnostic method for depressive disorder in Korea16 and in Western and Asian countries. Several studies have used PHQ-9 for assessing depressive disorder.17,18 The PHQ-9 consists of the following nine questions: (1) Little interest or pleasure in doing things;
(2) Feeling down, depressed, or hopeless; (3) Trouble falling asleep, staying asleep, or sleeping too much; (4) Feeling tired or having little energy; (5) Poor appetite or overeating; (6) Feeling bad about yourself or that you’re a failure or have let yourself or your family down; (7) Trouble concentrating on things, such as reading the newspaper or watching television; (8) Moving or speaking so slowly that other people could have noticed, or, the opposite, i.e., being so fidgety or restless that you have been moving around a lot more than usual; and (9) Thoughts that you would be better off dead or of hurting yourself in some way. Each question is scored on a scale of 0 (never) to 3 (almost every day), with the total numbers ranging between 0 and 27. Recent reporters defined total scores of 0 ~ 4 as no depression, 5 ~ 9 mild depression, 10 ~ 14 moderate depression, 15 ~ 19 moderately severe depression, and 20 ~ 27 severe depression.17
We defined depressive disorder as having a PHQ-9 score of ≥ 10 based on the Korean study15, similar to the other previous studies reported from other countries.17,18
Nutrients intakes and covariates
Nutrients were assessed using a one-day 24-h recall, and nutrients were energy intake, carbohydrate, protein,
fat, fiber, calcium, phosphorus, iron, sodium, potassium, vitamin A, carotene, retinol, thiamin, riboflavin, niacin and vitamin C. A total of 2,938 Korean adults were categorized into tertiles for each nutrient.
We considered sex, age, income status (household’s monthly income), education, physical activity, smoking status, alcohol consumption, menopause (female only), stress level, sleep duration, body mass index (BMI), having chronic diseases, and total energy intake as potential confounding factors. According to income, subjects were divided into the following five groups: < 1,000,000 won, 1,000,000 ~ 2,000,000 won, 2,000,000 ~ 3,000,000 won, 3,000,000 ~ 4,000,000 won, and ≥ 4,000,000 won).
Educational level was divided into four groups: those who finished elementary school, middle school, high school, and college or higher degrees. We divided physical activity into two categories: “sedentary” or “active”. Based on smoking status, the subjects were categorized into three groups: non-smoker, current smoker, and past-smoker.
Regarding the degree of alcohol consumption, they were divided into non-drinker, mild drinker and heavy drinker.
Heavy drinker was defined as subjects having a drink twice or more per week and having at least 7 drinks per occasion for men or five 5 drinks per occasion for women. Other drinkers besides heavy drinkers were defined as mild drinkers. Based on stress levels, subjects were categorized into four groups: extreme, moderate, low, and none. We adjusted for stress19, and sleep disturbance20, which were reported as risk factors for depressive disorder. Unfortu- nately, KNHANES does not have a questionnaire about sleep disturbance, we used categorized sleep duration instead (≤ 5 hour, 6 hour, 7 hour, and ≥ 8 hour). The health examination part of KNHANES, body weight and height are measured to 0.1 kg and 0.1 cm, respectively, for each individual dressed in light clothing without footwear. As the standard of BMI for obesity in Centers for Disease Control and Prevention (CDC) of Korea, subjects were categorized into three groups: < 18.5, 18.5 ~ 24.9, and ≥ 25.
The chronic disease status was categorized as either yes or no. Chronic diseases are defined when more than one of following diseases were present: hypertension, diabetes mellitus, hypercholesterolemia, myocardial infarction, angina pectoris and cancers such as stomach, liver, and breast.
Statistical analysis
Nutrients were represented as means and standard errors
(SEs) of continuous variables. To determine the subject characteristics in the two groups (normal versus depressive disorder), we conducted descriptive statistics using the chi-square test for categorical variables and Student’s t-test for continuous variables. All nutrients were categorized to the tertiles, and their association with depressive disorder was analyzed. Multivariate models were adjusted for sex, age, household income, educational level, physical activity, smoking status, alcohol consumption, menopause, stress level, sleep duration, BMI, chronic diseases, and total energy intake. To confirm whether any linear association between nutrient intakes and depressive disorder exists, the linear trend test was conducted by treating the median of each range in tertiles of nutrients as a continuous variable.
In the multivariable surveylogistic regression analysis, age, sleep duration, and total energy intake were included as continuous variables. Due to the small number of case, further analysis based on gender was conducted. All analyses were performed using the SAS program (SAS 9.4, Institute, Cary, NC, USA).
Results
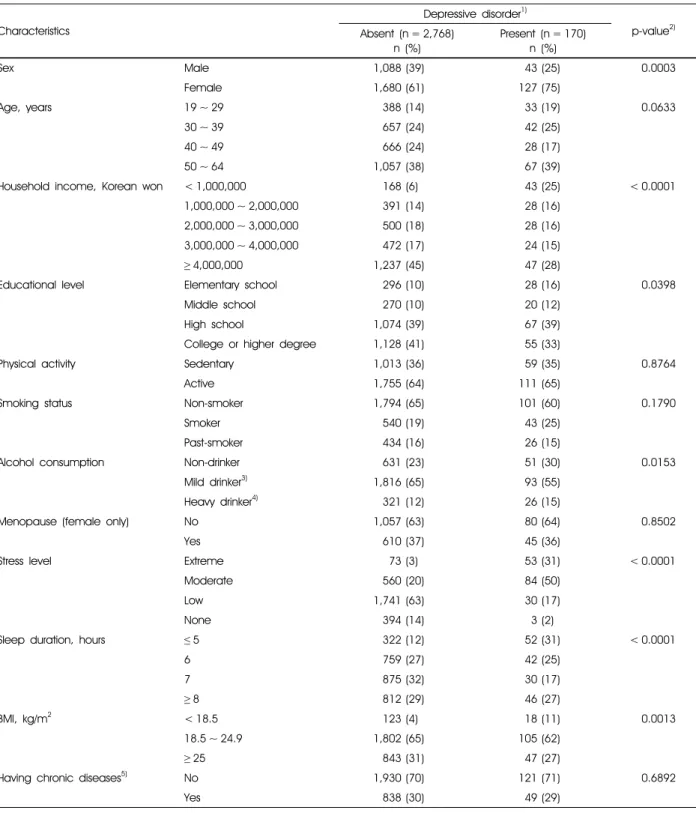
The characteristics of 2,938 study subjects divided into the normal group without depressive disorder and depressive disorder group (PHQ-9 score ≥ 10), were compared across categories (Table 1). Participants, who had the depressive disorder, were likely to be female, to have lowest monthly income and a low educational level, to be non-drinker, to be stressed, to have a short duration of sleep, and to have low BMI.
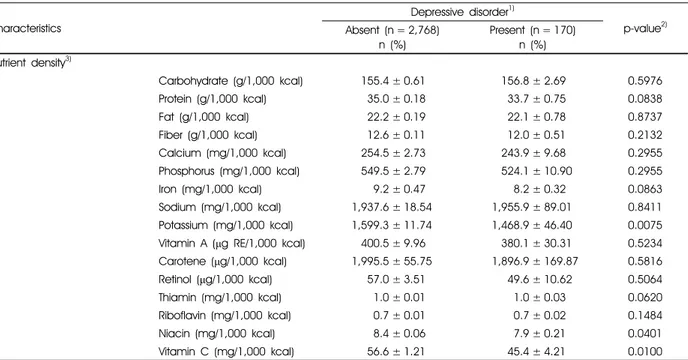
Table 2 and Table 3 showed nutrient intakes and nutrient density of subjects, respectively. With regard to nutrient intakes, the normal group had more sufficient nutrient intake than the depressive disorder group. Especially, intakes of carbohydrate, protein, fiber, calcium, phosphorus, iron, potassium, thiamin, riboflavin, niacin, and vitamin C, including energy intake, were significantly higher in the normal group than in the depressive disorder group (Table 2). To compare with nutrient density of two groups, potassium, niacin, and vitamin C intakes were higher in the normal group than in the depressive disorder group (Table 3).
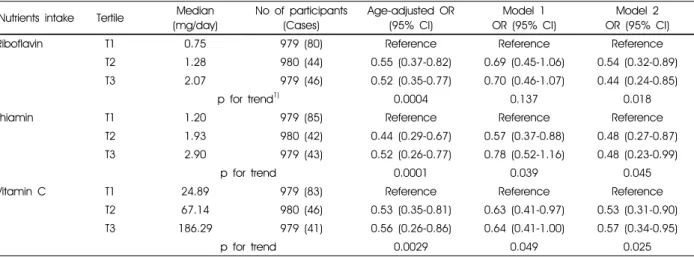
Results of the surveylogistic regression analyses between nutrient intakes and depressive disorder are presented in Table 4. We found inverse associations on riboflavin,
Characteristics
Depressive disorder1)
p-value2) Absent (n = 2,768)
n (%)
Present (n = 170) n (%)
Sex Male 1,088 (39) 43 (25) 0.0003
Female 1,680 (61) 127 (75)
Age, years 19 ~ 29 388 (14) 33 (19) 0.0633
30 ~ 39 657 (24) 42 (25)
40 ~ 49 666 (24) 28 (17)
50 ~ 64 1,057 (38) 67 (39)
Household income, Korean won < 1,000,000 168 (6) 43 (25) < 0.0001
1,000,000 ~ 2,000,000 391 (14) 28 (16)
2,000,000 ~ 3,000,000 500 (18) 28 (16)
3,000,000 ~ 4,000,000 472 (17) 24 (15)
≥4,000,000 1,237 (45) 47 (28)
Educational level Elementary school 296 (10) 28 (16) 0.0398
Middle school 270 (10) 20 (12)
High school 1,074 (39) 67 (39)
College or higher degree 1,128 (41) 55 (33)
Physical activity Sedentary 1,013 (36) 59 (35) 0.8764
Active 1,755 (64) 111 (65)
Smoking status Non-smoker 1,794 (65) 101 (60) 0.1790
Smoker 540 (19) 43 (25)
Past-smoker 434 (16) 26 (15)
Alcohol consumption Non-drinker 631 (23) 51 (30) 0.0153
Mild drinker3) 1,816 (65) 93 (55)
Heavy drinker4) 321 (12) 26 (15)
Menopause (female only) No 1,057 (63) 80 (64) 0.8502
Yes 610 (37) 45 (36)
Stress level Extreme 73 (3) 53 (31) < 0.0001
Moderate 560 (20) 84 (50)
Low 1,741 (63) 30 (17)
None 394 (14) 3 (2)
Sleep duration, hours ≤5 322 (12) 52 (31) < 0.0001
6 759 (27) 42 (25)
7 875 (32) 30 (17)
≥8 812 (29) 46 (27)
BMI, kg/m2 < 18.5 123 (4) 18 (11) 0.0013
18.5 ~ 24.9 1,802 (65) 105 (62)
≥25 843 (31) 47 (27)
Having chronic diseases5) No 1,930 (70) 121 (71) 0.6892
Yes 838 (30) 49 (29)
BMI: body mass index
1) The depressive disorder is classified by 10 or more than 10 scores in PHQ-9 (Patient Health Questionnaire-9) 2) Proportion of each variable was tested using the chi-square test. 3)The drinkers excluding heavy drinker 4) Heavy drinker was defined as the average annual alcohol consumption per drinker per year 7 glasses or more of alcohol more once a week (5 glasses or more in women).
5) Chronic diseases involve hypertension, diabetes, hypercholesterolemia, myocardial infarction, angina pectoris and cancers of the stomach, liver, colorectal, breast, and lung.
Table 1. Characteristics of sample subjects from the 2014 Korean National Health and Nutrition Examination Survey with and without the depressive disorder (n = 2,938)
Characteristics
Depressive disorder1)
p-value2) Absent (n = 2,768)
n (%)
Present (n = 170) n (%) Nutrient intake/day3)
Calorie intake (kcal) 2,078.5 ± 15.52 1,923.1 ± 66.05 0.0164
Carbohydrate (g) 314.8 ± 2.33 291.6 ± 9.85 0.0173
Protein (g) 72.9 ± 0.69 65.8 ± 3.1 0.0257
Fat (g) 47.5 ± 0.61 44.7 ± 2.54 0.2727
Fiber (g) 25.25 ± 0.25 22.3 ± 1.09 0.0053
Calcium (mg) 505.0 ± 5.38 455.4 ± 23.15 0.0273
Phosphorus (mg) 1,123.6 ± 9.21 1,002.9 ± 40.95 0.0018
Iron (mg) 18.9 ± 1.26 15.8 ± 0.82 0.0371
Sodium (mg) 3,970.8 ± 46.2 3,758.4 ± 217.2 0.3400
Potassium (mg) 3,221.9 ± 30.2 2,781.8 ± 125.3 0.0005
Vitamin A (μg RE) 806.0 ± 22.7 760.9 ± 78.7 0.5828
Carotene (μg) 3,940.8 ± 113.3 3,792.1 ± 402.90 0.6203
Retinol (μg) 127.0 ± 12.09 112.2 ± 39.02 0.7263
Thiamin (mg) 2.1 ± 0.02 1.9 ± 0.09 0.0252
Riboflavin (mg) 1.4 ± 0.01 1.3 ± 0.06 0.0144
Niacin (mg) 17.3 ± 0.17 15.1 ± 0.72 0.0079
Vitamin C (mg) 111.6 ± 2.48 84.2 ± 8.34 0.0019
1) The depressive disorder is classified by 10 or more than 10 scores in PHQ-9 (Patient Health Questionnaire-9). 2) Mean of each variable was tested using the Student's t-test. 3) mean ± standard error
Table 2. Nutrient intake of sample subjects from the 2014 Korean National Health and Nutrition Examination Survey with and without the depressive disorder (n = 2,938)
Characteristics
Depressive disorder1)
p-value2) Absent (n = 2,768)
n (%)
Present (n = 170) n (%) Nutrient density3)
Carbohydrate (g/1,000 kcal) 155.4 ± 0.61 156.8 ± 2.69 0.5976
Protein (g/1,000 kcal) 35.0 ± 0.18 33.7 ± 0.75 0.0838
Fat (g/1,000 kcal) 22.2 ± 0.19 22.1 ± 0.78 0.8737
Fiber (g/1,000 kcal) 12.6 ± 0.11 12.0 ± 0.51 0.2132
Calcium (mg/1,000 kcal) 254.5 ± 2.73 243.9 ± 9.68 0.2955
Phosphorus (mg/1,000 kcal) 549.5 ± 2.79 524.1 ± 10.90 0.2955
Iron (mg/1,000 kcal) 9.2 ± 0.47 8.2 ± 0.32 0.0863
Sodium (mg/1,000 kcal) 1,937.6 ± 18.54 1,955.9 ± 89.01 0.8411 Potassium (mg/1,000 kcal) 1,599.3 ± 11.74 1,468.9 ± 46.40 0.0075 Vitamin A (μg RE/1,000 kcal) 400.5 ± 9.96 380.1 ± 30.31 0.5234 Carotene (μg/1,000 kcal) 1,995.5 ± 55.75 1,896.9 ± 169.87 0.5816
Retinol (μg/1,000 kcal) 57.0 ± 3.51 49.6 ± 10.62 0.5064
Thiamin (mg/1,000 kcal) 1.0 ± 0.01 1.0 ± 0.03 0.0620
Riboflavin (mg/1,000 kcal) 0.7 ± 0.01 0.7 ± 0.02 0.1484
Niacin (mg/1,000 kcal) 8.4 ± 0.06 7.9 ± 0.21 0.0401
Vitamin C (mg/1,000 kcal) 56.6 ± 1.21 45.4 ± 4.21 0.0100
1) The depressive disorder is classified by 10 or more than 10 scores in PHQ-9 (Patient Health Questionnaire-9). 2) Mean of each variable was tested using the Student's t-test. 3) mean ± standard error
Table 3. Nutrient density of sample subjects from the 2014 Korean National Health and Nutrition Examination Survey with and without the depressive disorder (n = 2,938)
thiamin, and vitamin C after adjusting the covariates.
Compared to the lowest tertile for riboflavin, the second and third tertiles showed a statistically significant ORs
of 0.54 (95% CI: 0.32-0.89), 0.44 (95% CI: 0.24-0.85) after adjusting the confounding factors, respectively. In multivariate models, the risk of depressive disorder in the
Nutrients intake Tertile Median (mg/day)
No of participants (Cases)
Age-adjusted OR (95% CI)
Model 1 OR (95% CI)
Model 2 OR (95% CI)
Riboflavin T1 0.75 979 (80) Reference Reference Reference
T2 1.28 980 (44) 0.55 (0.37-0.82) 0.69 (0.45-1.06) 0.54 (0.32-0.89)
T3 2.07 979 (46) 0.52 (0.35-0.77) 0.70 (0.46-1.07) 0.44 (0.24-0.85)
p for trend1) 0.0004 0.137 0.018
Thiamin T1 1.20 979 (85) Reference Reference Reference
T2 1.93 980 (42) 0.44 (0.29-0.67) 0.57 (0.37-0.88) 0.48 (0.27-0.87)
T3 2.90 979 (43) 0.52 (0.26-0.77) 0.78 (0.52-1.16) 0.48 (0.23-0.99)
p for trend 0.0001 0.039 0.045
Vitamin C T1 24.89 979 (83) Reference Reference Reference
T2 67.14 980 (46) 0.53 (0.35-0.81) 0.63 (0.41-0.97) 0.53 (0.31-0.90)
T3 186.29 979 (41) 0.56 (0.26-0.86) 0.64 (0.41-1.00) 0.57 (0.34-0.95)
p for trend 0.0029 0.049 0.025
All analysis was conducted by the surveylogistic regression model.
1) Calculated using the surveylogistic regression model.
Model 1: Adjusting for age (continuous), sex and SES (socio-economic status) such as income and education
Model 2: Adjusting for age (continuous), sex, energy intake (continuous), household income, education, physical activity, smoking, alcohol consumption, menstruation, stress level, sleep duration (continuous), BMI, chronic disease
Table 4. Logistic regression analyses of vitamins intakes and depressive disorder in a population sample of 2,938 participants
second and third tertiles of thiamin intake presented a statistically significant ORs of 0.48 (95% CI: 0.27-0.87), 0.48 (95% CI: 0.23-0.99), respectively, compared with the first tertile (p for trend = 0.045). The likelihood for depressive disorder in the second and third tertiles for vitamin C decreased to 0.53 and 0.57, respectively (p for trend = 0.025). In addition, the inverse association between riboflavin intake and depressive disorder still significantly remain after excluding subjects who were diagnosed with depression by physician’s (data not shown).
Discussion
This study aimed to identify the association between nutrient intakes and depressive disorder in Korean adults aged 19 ~ 64 years. Riboflavin, thiamin, and vitamin C intake were inversely associated with depressive disorders.
Previous studies reported that women were more likely than men to have depressive symptoms, 21,22 which is similar to that observed in our study. Besides gender, low income and educational level were reported to have a significant relationship with the risk of depression.23,24 Stress and sleep disturbance could not be separated from a depressive disorder. It is clear that depression is associated with stress from the various situations.25 One study found that older adults with depression had a higher risk of developing and worsening status of sleep disturbances using a meta-analysis,26 and another study reported the relationship
between major depression and sleep abnormalities in men aged 20 ~ 74 years.20 Similar to these previous studies, the risk factors were likely higher in the depressive disorder group than a normal group in our study. Therefore, we adjusted these factors in the association of nutrient intake in relation to the prevalence of depressive disorder.
To date, one cross-sectional study and a cohort study reported a relationship between riboflavin intake (0.55 ~
0.93 mg/1,000 kcal) and depressive disorder in the Japanese population.5,6 In a cross-sectional study, an inverse association was found between riboflavin intake and depressive disorder only in girls5, and in a prospective cohort study, a J-shaped association between riboflavin intake and postpartum depressive disorder was reported in Japanese women.6 Likewise, a study on the Chinese population also reported an inverse association between riboflavin (0.7 ~ 1.2 mg/d) and depressive disorder.27 Coenzymes of riboflavin are required for remethylation and transsulfuration of homocysteine,28 and previous studies reported about an inverse association between riboflavin status and homocysteine.29,30 Increased levels of homocysteine, arising from riboflavin deficiency, may play an important role in mediating the association between low riboflavin intake and the risk of depressive disorder.
These results are likely to point an inverse relationship between riboflavin and depressive disorder, and our study supports similar results in Korean adults. However, recently a report revealed an inadequate riboflavin status in Korean
adults, i.e., approximately 28% of the participants consumed less riboflavin than the Estimated Average Requirement.31
In the present data, high thiamin intake was related to decreased odds of depressive disorder. A recent randomized controlled trial study found that symptoms of depression improved from 6 weeks after taking adjuvant thiamin (300 mg/d) compared to placebo.9 A study in China found that lower concentrations of all three erythrocyte thiamine biomarkers (i.e., free thiamine, thiamine monophosphate, and thiamine diphosphate) were monotonically associated with a higher prevalence of depressive disorder in elderly people (age range 50 ~ 70 years).10
A number of studies showed the effect of vitamin C on major depressive disorder. For example, a result of a cross-sectional study showed that low vitamin C intake (58.61 g/1,000 kcal) was associated with a risk of depressive symptoms in the Japanese population.13 A recent randomized controlled trial with adjuvant administration of vitamin C (1,000 mg/d) may prove its use for the treatment of depressive disorder in pediatric patients.12 Additionally, adjuvant administration of vitamin C may be effective in decreasing the risk of suicidal behaviors and thoughts associated with antidepressant therapy in pediatric patients.32
The association between vitamin C and depressive disorder still seems unclear in an epidemiological study, however, mechanisms of depressive disorder linking to vitamin C have been reported. Vitamin C is associated with protecting the neuron against oxidative stress, alleviating inflammation, promoting neuronal development, regulating the neurotransmission, and controlling the epigenetic function; all of these processes are closely associated with psychiatry.33 Beside the importance of vitamin C in the functioning of several processes in the central nervous system has been proven by an in vivo study results.34
The strength of this study include the use of the national representative information called KNHANES and the analysis of nutrients and depressive disorder using PHQ-9;
to our knowledge, this is the first study to assess the association between riboflavin, thiamin, and vitamin C intakes and PHQ-9 in representing Korean adults. This study had a few limitations as well. First, because of a cross-sectional design, a causal relationship between intakes of riboflavin, thiamin, and vitamin C intakes and depressive disorder was undetermined. Second, dietary nutrient intakes
may not reflect body nutrient status and be affected by various factors including absorption, metabolic process, and excretion. Thus, further studies are necessary to verify our results using reliable biomarkers of nutrients. Third, although we analyzed after adjusting for diverse potential confounding factors, we could not exclude the potentiality of unmeasured or residual confounders.
Our study supported that dietary riboflavin, thiamin and vitamin C are associated with low prevalence of depressive disorder in Korean adults. Further studies are warranted to conclude whether this association also exists in a large cohort study design.
Summary
In this study, we examined the association between nutrient intakes and depressive disorder in Korean adults using 2014 KNHANES data. We defined depressive disorder as having ≥ 10 PHQ-9 score, which characterizes as moderate depression and more. Among the 2,938 subjects, 170 were identified as having depressive disorder.
With regard to nutrient intakes, the normal group had more sufficient nutrient intake than the depressive disorder group.
Especially, intakes of energy, carbohydrate, protein, fiber, calcium, phosphorus, iron, potassium, thiamin, riboflavin, niacin, and vitamin C were significantly higher in the normal group than that in the depressive disorder group.
Multivariate-adjusted regression analysis demonstrated that the high intake of riboflavin, thiamin, and vitamin C were independently related to a low prevalence of depressive disorder in Korean adults. Based on our findings, riboflavin, thiamin, and vitamin C could be important nutrients to prevent depressive disorder in Korean adults.
ORCID
Park, Seon-Joo https://orcid.org/0000-0002-1825-1815 Choi, Ji Hee https://orcid.org/0000-0001-7801-7513 Lee, Jae Yeon https://orcid.org/0000-0002-6295-9044 Lee, Changho https://orcid.org/0000-0002-1039-1434 Lee, Hae-Jeung https://orcid.org/0000-0001-8353-3619
References
1. World Health Organization. World health day 2017 [Internet].
Geneva: World Health Organization. 2017 [cited 2018 Aug 10].
Available from: http://www.who.int/campaigns/world-health- day/2017/en/.
2. Hyde JS, Mezulis AH, Abramson LY. The ABCs of depression:
integrating affective, biological, and cognitive models to explain the emergence of the gender difference in depression.
Psychol Rev 2008; 115(2): 291-313.
3. Kennedy DO. B vitamins and the brain: mechanisms, dose and efficacy-a review. Nutrients 2016; 8(2): 68.
4. Murakami K, Sasaki S. Dietary intake and depressive symptoms:
a systematic review of observational studies. Mol Nutr Food Res 2010; 54(4): 471-488.
5. Murakami K, Miyake Y, Sasaki S, Tanaka K, Arakawa M.
Dietary folate, riboflavin, vitamin B-6, and vitamin B-12 and depressive symptoms in early adolescence: the Ryukyus Child Health Study. Psychosom Med 2010; 72(8): 763-768.
6. Miyake Y, Sasaki S, Tanaka K, Yokoyama T, Ohya Y, Fukushima W, Saito K, Ohfuji S, Kiyohara C, Hirota Y; Osaka Maternal and Child Health Study Group. Dietary folate and vitamins B12, B6, and B2 intake and the risk of postpartum depression in Japan: the Osaka Maternal and Child Health Study. J Affect Disord 2006; 96(1-2): 133-138.
7. Schmidt LJ, Cremin FM, Grivetti LE, Clifford AJ. Influence of thiamine supplementation on the health and general wellbeing of an elderly Irish population with marginal thiamine deficiency.
J Gerontol 1991; 46(1): 16-22.
8. Benton D, Griffiths R, Haller J. Thiamine supplementation mood and cognitive functioning. Psychopharmacology (Berl) 1997; 129(1): 66-71.
9. Ghaleiha A, Davari H, Jahangard L, Haghighi M, Ahmadpanah M, Seifrabie MA, Bajoghli H, Holsboer-Trachsler E, Brand S.
Adjuvant thiamine improved standard treatment in patients with major depressive disorder: results from a randomized, double- blind, and placebo-controlled clinical trial. Eur Arch Psychiatry Clin Neurosci 2016; 266(8): 695-702.
10. Zhang G, Ding H, Chen H, Ye X, Li H, Lin X, Ke Z. Thiamine nutritional status and depressive symptoms are inversely associated among older Chinese adults. J Nutr 2013; 143(1):
53-58.
11. Thea RM, Angela ME. Depression in women across the life cycle. J Pharm Pract 2001; 14(6): 511-525.
12. Amr M, El-Mogy A, Shams T, Vieira K, Lakhan SE. Efficacy of vitamin C as an adjunct to fluoxetine therapy in pediatric major depressive disorder: a randomized, double-blind, placebo-controlled pilot study. Nutr J 2013; 12(1): 31.
13. Nguyen TT, Tsujiguchi H, Kambayashi Y, Hara A, Miyagi S, Yamada Y, Nakamura H, Shimizu Y, Hori D, Suzuki F, Hayashi K, Nakamura H. Relationship between vitamin intake and depressive symptoms in elderly Japanese individuals:
differences with gender and body mass index. Nutrients 2017;
9(12): 1319-1335.
14. Jeong Y, Han AL, Shin SR, Lee SY, Kim JH. Relationship between diet and prevalence of depression among Korean adults: Korea National Health and Nutrition Examination Survey 2010. J Agric Med Community Health 2016; 41(2): 75-84.
15. Kim JH, Han AL, Shin SR, Park SY. Relationship between dietary intake and depression in metabolic syndroem among Korean adults: Korea National Health and Nutrition Exami-
nation Survey 2014. J Agric Med Community Health 2017;
42(2): 79-86.
16. Han C, Jo SA, Kwak JH, Pae CU, Steffens D, Jo I, Park MH.
Validation of the Patient Health Questionnaire-9 Korean version in the elderly population: the Ansan Geriatric study. Compr Psychiatry 2008; 49(2): 218-223.
17. Kroenke K, Spitzer RL, Williams JB. The PHQ-9: validity of a brief depression severity measure. J Gen Intern Med 2001;
16(9): 606-613.
18. Manea L, Gilbody S, McMillan D. A diagnostic meta-analysis of the Patient Health Questionnaire-9 (PHQ-9) algorithm scoring method as a screen for depression. Gen Hosp Psychiatry 2015;
37(1): 67-75.
19. Murakami K, Mizoue T, Sasaki S, Ohta M, Sato M, Matsushita Y, Mishima N. Dietary intake of folate, other B vitamins, and omega-3 polyunsaturated fatty acids in relation to depressive symptoms in Japanese adults. Nutrition 2008; 24(2): 140-147.
20. Hubain P, Le Bon O, Vandenhende F, Van Wijnendaele R, Linkowski P. Major depression in males: effects of age, severity and adaptation on sleep variables. Psychiatry Res 2006;
145(2-3): 169-177.
21. Kessler RC, McGonagle KA, Swartz M, Blazer DG, Nelson CB. Sex and depression in the National Comorbidity Survey.
I: lifetime prevalence, chronicity and recurrence. J Affect Disord 1993; 29(2-3): 85-96.
22. Weissman MM, Olfson M. Depression in women: implications for health care research. Science 1995; 269(5225): 799-801.
23. Freeman A, Tyrovolas S, Koyanagi A, Chatterji S, Leonardi M, Ayuso-Mateos JL, Tobiasz-Adamczyk B, Koskinen S, Rummel-Kluge C, Haro JM. The role of socio-economic status in depression: results from the COURAGE (aging survey in Europe). BMC Public Health 2016; 16(1): 1098.
24. Hoebel J, Maske UE, Zeeb H, Lampert T. Social inequalities and depressive symptoms in adults: the role of objective and subjective socioeconomic status. PLoS One 2017; 12(1):
e0169764.
25. Hammen C. Generation of stress in the course of unipolar depression. J Abnorm Psychol 1991; 100(4): 555-561.
26. Bao YP, Han Y, Ma J, Wang RJ, Shi L, Wang TY, He J, Yue JL, Shi J, Tang XD, Lu L. Cooccurrence and bidirectional prediction of sleep disturbances and depression in older adults:
Meta-analysis and systematic review. Neurosci Biobehav Rev 2017; 75: 257-273.
27. Woo J, Lynn H, Lau WY, Leung J, Lau E, Wong SY, Kwok T. Nutrient intake and psychological health in an elderly Chinese population. Int J Geriatr Psychiatry 2006; 21(11):
1036-1043.
28. Ganji V, Kafai MR. Frequent consumption of milk, yogurt, cold breakfast cereals, peppers, and cruciferous vegetables and intakes of dietary folate and riboflavin but not vitamins B-12 and B-6 are inversely associated with serum total homocysteine concentrations in the US population. Am J Clin Nutr 2004;
80(6): 1500-1507.
29. Jacques PF, Bostom AG, Wilson PW, Rich S, Rosenberg IH, Selhub J. Determinants of plasma total homocysteine concent- ration in the Framingham Offspring cohort. Am J Clin Nutr 2001; 73(3): 613-621.
30. Moat SJ, Ashfield-Watt PA, Powers HJ, Newcombe RG, McDowell IF. Effect of riboflavin status on the homocysteine- lowering effect of folate in relation to the MTHFR (C677T) genotype. Clin Chem 2003; 49(2): 295-302.
31. Choi JY, Kim YN, Cho YO. Evaluation of riboflavin intakes and status of 20-64-year-old adults in South Korea. Nutrients 2014; 7(1): 253-264.
32. Isacsson G, Rich CL. Antidepressant drugs and the risk of
suicide in children and adolescents. Paediatr Drugs 2014; 16(2):
115-122.
33. Han QQ, Shen TT, Wang F, Wu PF, Chen JG. Preventive and Therapeutic Potential of Vitamin C in Mental Disorders. Curr Med Sci 2018; 38(1): 1-10.
34. Kocot J, Luchowska-Kocot D, Kiełczykowska M, Musik I, Kurzepa J. Does Vitamin C influence neurodegenerative diseases and psychiatric disorders? Nutrients 2017; 9(7): 1-29.