Evaluation of Agreement of Overweight Screening Criteria in Adolescents: Korean National Health and Nutrition Examination Surveys
Ji Yeon Han1, Sochung Chung1,2,*
1Department of Pediatrics, Konkuk University Medical Center, Seoul; 2Department of Pediatrics, Konkuk University School of Medicine, Seoul, Korea
Background: The increasing prevalence of overweight children and childhood obesity has led to early devel- opment of obesity-related diseases, including diabetes. Screening tests for type 2 diabetes in children indicate overweight as a major risk factor. Three overweight screening criteria have been considered: body mass index (BMI) >85th percentile (overweight 1, OW1), weight for height >85th percentile (OW2), and weight >120% of ideal for height (OW3). This study was conducted to evaluate the agreement in these screening criteria and the impact of increased use of screening methods.
Methods: Data were obtained from 965 Korean adolescents (521 boys and 444 girls). The subjects were classi- fied into overweight and normal weight groups by the three above criteria. The agreement between criteria was evaluated using Cohen’s kappa value. Furthermore, we studied the relationships between the criteria and pa- rameters of height, weight, BMI, and z score, based on the 2007 Korean growth chart.
Results: Totals of 188, 139, and 115 adolescents were classified as OW1, OW2, and OW3, respectively. The kappa values were 0.798, 0.710, and 0.891 for OW1 and OW2, OW1 and OW3, and OW2 and OW3, respectively. Weight, weight-z, BMI, and BMI-z were greater among subjects in all overweight groups compared to the normal weight group. However, the heights of the subjects did not differ between the three groups.
Conclusion: Active assessment of overweight status using OW1 could be improved by including more adoles- cents and focusing on the variability of individual growth and disease risk, even though substantial agreement was observed among the three overweight screening criteria.
Key words: Overweight, Obesity, Body mass index, Adolescent, Growth
Received January 26, 2021 Reviewed May 12, 2021 Accepted May 12, 2021
* Corresponding author Sochung Chung
https://orcid.org/0000-0002-7655-2691 Department of Pediatrics, Konkuk University Medical Center, Konkuk University School of Medicine, 120-1 Neungdong-ro, Gwangjin-gu, Seoul 05030, Korea
Tel: +82-2-2030-7553 Fax: +82-2-2030-7748 E-mail: [email protected]
INTRODUCTION
The worldwide prevalence of childhood obesity has increased over the past three decades, including in Korea.
1,2The increasing prevalence of childhood obesity has led to obesity-related comorbid diseases, including diabetes, at an early age.
3-5Screening tests for type 2 diabetes in asymptomatic children test for obesity plus any two of the following risk factors: family history of type 2 diabetes, race/
ethnicity, or signs of insulin resistance or conditions associated with insulin resistance such as acanthosis nigricans, hypertension, dys-
lipidemia, or small for-gestational-age birth weight.
6According to the American Diabetes Association, three overweight criteria are considered in this screening test: body mass index (BMI) > 85th percentile for age and sex (overweight 1, OW1), weight for height
> 85th percentile (OW2), and weight > 120% of ideal for height (OW3).
7The present study was conducted to evaluate agreement in the three screening criteria and the impact of increased use of screening methods. In addition, this study aimed to minimize the number of affected children overlooked during the overweight screening process.
Copyright © 2021 Korean Society for the Study of Obesity
This is an Open Access article distributed under the terms of the Creative Commons Attribution Non-Commercial License (https://creativecommons.org/licenses/by-nc/4.0/) which permits unrestricted non-commercial use, distribution, and reproduction in any medium, provided the original work is properly cited.
2017-03-16 https://crossmark-cdn.crossref.org/widget/v2.0/logos/CROSSMARK_Color_square.svg
METHODS Subjects
This study was performed using data from the Fourth and Fifth Korea National Health and Nutrition Examination Surveys con- ducted by the Korea Centers for Disease Control and Prevention, including a total of 965 adolescents (521 boys and 444 girls) from 10 to 18 years of age. Details of the subjects have been described in a previous study.
8The subjects were classified into overweight groups based on criteria. Subjects were included in the normal weight group if no criterion was met. The Institutional Review Board of Konkuk University Medical Center (IRB No. 2020-11- 045) approved this study. Owing to the retrospective design, the requirement for informed consent was waived.
Anthropometric measurements
The weight (WT) and height (HT) of the participants were mea- sured in light clothing and without shoes. WT was measured with a digital scale (GL-6000-20; CASKOREA, Seoul, Korea) to the nearest 0.1 kg, and HT was measured to the nearest 0.1 cm with a stadiometer (SECA 225; SECA Deutschland, Hamburg, Germa- ny). BMI was calculated as weight (kg)/height
2(m
2). Growth sta- tus as measured by HT, WT, and BMI and z scores based on age and sex were based on the 2007 Korean growth chart.
9Statistical analysis
Data are expressed as mean± standard deviation. Inter-group comparisons of the assessments were performed using t-test, and agreement was evaluated using Cohen’s kappa values to analyze the
consistency of each criterion. The significance level for each com- parison was set at P<0.05. All analysis was performed using SPSS ver. 17.0 (SPSS Inc., Chicago, IL, USA).
RESULTS
A total of 965 adolescents constituted the study population. The characteristics of each group according to sex are shown in Table 1.
The mean HT, WT, and BMI of the subjects were 159.5 cm, 52.4 kg, and 20.4 kg/m
2, respectively, and their z scores of HT (HTz), WT (WTz), BMI (BMIz) were 0.70, 0.36, and 0.07. Totals of 188 (108
Table 1. Characteristics of the study populations
Variable Boy (n= 521) Girl (n= 444) Total (n= 965)
Age (yr) 13.5± 2.6 13.6± 2.5 13.6± 2.5
HT (cm) 161.8± 13.2 156.7± 8.2 159.5± 11.4
WT (kg) 54.9± 15.0 49.6± 11.0 52.4± 13.6
BMI (kg/m2) 20.7± 3.8 20.0± 3.4 20.4± 3.7
HTz 0.74± 1.06 0.66± 1.05 0.70± 1.06
WTz 0.37± 1.07 0.35± 1.04 0.36± 1.06
BMIz 0.06± 1.12 0.09± 1.05 0.07± 1.09
Values are presented as mean± standard deviation.
HT, height; WT, weight; BMI, body mass index; HTz, z score of HT; WTz, z score of WT;
BMIz, z score of BMI.
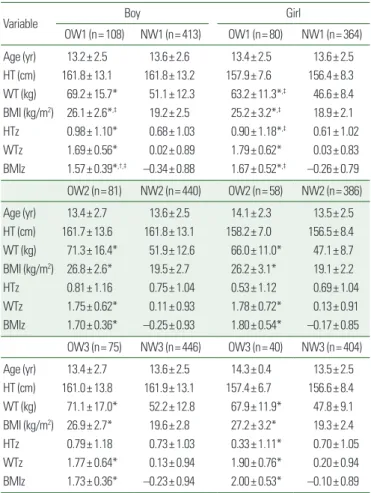
Table 2. Comparisons of subjects in the overweight and normal weight groups and between overweight groups
Variable Boy Girl
OW1 (n= 108) NW1 (n= 413) OW1 (n= 80) NW1 (n= 364)
Age (yr) 13.2± 2.5 13.6± 2.6 13.4± 2.5 13.6± 2.5
HT (cm) 161.8± 13.1 161.8± 13.2 157.9± 7.6 156.4± 8.3 WT (kg) 69.2± 15.7* 51.1± 12.3 63.2± 11.3*,‡ 46.6± 8.4 BMI (kg/m2) 26.1± 2.6*,‡ 19.2± 2.5 25.2± 3.2*,‡ 18.9± 2.1 HTz 0.98± 1.10* 0.68± 1.03 0.90± 1.18*,‡ 0.61± 1.02
WTz 1.69± 0.56* 0.02± 0.89 1.79± 0.62* 0.03± 0.83
BMIz 1.57± 0.39*,†,‡ –0.34± 0.88 1.67± 0.52*,‡ –0.26± 0.79 OW2 (n= 81) NW2 (n= 440) OW2 (n= 58) NW2 (n= 386)
Age (yr) 13.4± 2.7 13.6± 2.5 14.1± 2.3 13.5± 2.5
HT (cm) 161.7± 13.6 161.8± 13.1 158.2± 7.0 156.5± 8.4 WT (kg) 71.3± 16.4* 51.9± 12.6 66.0± 11.0* 47.1± 8.7 BMI (kg/m2) 26.8± 2.6* 19.5± 2.7 26.2± 3.1* 19.1± 2.2
HTz 0.81± 1.16 0.75± 1.04 0.53± 1.12 0.69± 1.04
WTz 1.75± 0.62* 0.11± 0.93 1.78± 0.72* 0.13± 0.91
BMIz 1.70± 0.36* –0.25± 0.93 1.80± 0.54* –0.17± 0.85 OW3 (n= 75) NW3 (n= 446) OW3 (n= 40) NW3 (n= 404)
Age (yr) 13.4± 2.7 13.6± 2.5 14.3± 0.4 13.5± 2.5
HT (cm) 161.0± 13.8 161.9± 13.1 157.4± 6.7 156.6± 8.4 WT (kg) 71.1± 17.0* 52.2± 12.8 67.9± 11.9* 47.8± 9.1 BMI (kg/m2) 26.9± 2.7* 19.6± 2.8 27.2± 3.2* 19.3± 2.4
HTz 0.79± 1.18 0.73± 1.03 0.33± 1.11* 0.70± 1.05
WTz 1.77± 0.64* 0.13± 0.94 1.90± 0.76* 0.20± 0.94
BMIz 1.73± 0.36* –0.23± 0.94 2.00± 0.53* –0.10± 0.89 Values are presented as mean± standard deviation. OW1 is a group with BMI > 85th percentile for age and sex, OW2 is a group with weight for height > 85th percentile, and OW3 is a group with weight > 120% of ideal for height. NW is a group that does not meet any of the overweight criteria.
*Statistically significant P< 0.05 between OW and NW; †Statistically significant P< 0.05 between OW1 and OW2; ‡Statistically significant P< 0.05 between OW1 and OW3. There was no significant difference between OW2 and OW3.
OW, overweight; NW, normal weight; HT, height; WT, weight; BMI, body mass index;
HTz, z score of HT; WTz, z score of WT; BMIz, z score of BMI.
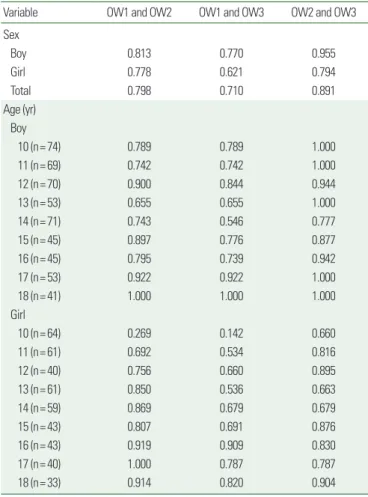
Table 3. The respective kappa values of OW1 and OW2, OW1 and OW3, and OW2 and OW3 based on sex and age
Variable OW1 and OW2 OW1 and OW3 OW2 and OW3
Sex
Boy 0.813 0.770 0.955
Girl 0.778 0.621 0.794
Total 0.798 0.710 0.891
Age (yr) Boy
10 (n= 74) 0.789 0.789 1.000
11 (n= 69) 0.742 0.742 1.000
12 (n= 70) 0.900 0.844 0.944
13 (n= 53) 0.655 0.655 1.000
14 (n= 71) 0.743 0.546 0.777
15 (n= 45) 0.897 0.776 0.877
16 (n= 45) 0.795 0.739 0.942
17 (n= 53) 0.922 0.922 1.000
18 (n= 41) 1.000 1.000 1.000
Girl
10 (n= 64) 0.269 0.142 0.660
11 (n= 61) 0.692 0.534 0.816
12 (n= 40) 0.756 0.660 0.895
13 (n= 61) 0.850 0.536 0.663
14 (n= 59) 0.869 0.679 0.679
15 (n= 43) 0.807 0.691 0.876
16 (n= 43) 0.919 0.909 0.830
17 (n= 40) 1.000 0.787 0.787
18 (n= 33) 0.914 0.820 0.904
OW1 is a group with BMI > 85th percentile for age and sex, OW2 is a group with weight for height > 85th percentile, and OW3 is a group with weight > 120% of ideal for height.
OW, overweight; BMI, body mass index.
boys and 80 girls), 139 (81 boys and 58 girls), and 115 (75 boys and 40 girls) adolescents were classified in OW1, OW2, and OW3, respectively, based on overweight screening criteria. Comparisons of subjects in the overweight and normal WT groups and between overweight groups are shown in Table 2. WT, WTz, BMI, and BMIz were greater among subjects in all three overweight groups com- pared to those in the normal WT group. However, HT of the sub- jects did not differ between the three groups. This indicated that subjects in the overweight groups exhibited higher WT and BMI without HT difference. On comparison of overweight groups, sig- nificant differences were observed in BMI and BMIz between OW1 and OW3 boys and girls. There was no significant difference in BMIz between OW2 and OW3 in either boys or girls.
The respective kappa values of each overweight group according to sex and age is shown in Table 3. The kappa values were 0.798, 0.710, and 0.891 for OW1 and OW2, OW1 and OW3, and OW2 and OW3, respectively. Among the three comparisons, the most significant agreement was found in the OW2 and OW3 groups, es- pecially in boys. The kappa values differed based on age and sex, were higher in boys than in girls, and were lower in mid-adolescents compared to late-adolescents.
In addition, as seen in the diagram of the degree of agreements, all three comparisons show substantial agreements (Fig. 1A-C).
Furthermore, when the obesity group was included in the diagram of OW1 and OW3 (Fig. 1D), only one girl belonged to the OW1 and obesity group but not to the OW3 group. Her characteristics were as follows: HT, 157 cm; WT, 59 kg; BMI, 24 kg/m
2; HTz, 1.88; WTz, 2.15; and BMIz, 1.72. Only one boy belonged to the
Figure 1. Diagrams of the degree of agreement between (A) OW1 and OW2, (B) OW1 and OW3, and (C) OW2 and OW3. There is substantial agreement in all three com- parisons. Totals of 188, 139, and 115 adolescents were classified into the respective OW1, OW2, and OW3 groups. The number of overlapping adolescents is shown in the figure. (D) The diagram showing agreement among the OW1, OW3, and OB groups. *One adolescent belongs to the OW1 and obesity groups but not to the OW3 group (marked with the number sign. †Another adolescent only belongs to the OW3 group but not to the OW1 and obesity groups. OW, overweight group; OB, obesity group.
OW1 is a group with BMI > 85th percentile for age and sex, OW2 is a group with weight for height > 85th percentile, and OW3 is a group with weight > 120% of ideal for height. An obesity group is a group with BMI > 95th percentile for age and sex.
A B C
136 114 115
OW2 OW2
OW1 OW1 OW3 OW3
D
OW1 OW3
*OB
†
OW3 group but not to the OW1 and obesity groups. His charac-
teristics were as follows: HT, 170 cm; WT, 74 kg; BMI, 25 kg/m
2;
HTz, –0.44; WTz, 0.92; and BMIz, 1.17.
When comparing subjects in the overweight groups (OW1 and OW3) with those in the obesity group (BMI > 95th percentile for age and sex), there were significant differences in WT, WTz, BMI, and BMIz in the obesity and OW3 groups (Table 4). BMI and BMIz tended to increase in the order of OW1, OW3, and obesity groups. In addition, subjects (especially girls) in the OW3 group exhibited a lower HTz value compared to those in the other groups.
The comparison of girls in the OW1 and OW3 groups revealed a significant difference (P<0.05) in HTz values. A detailed compari- son based on age revealed that the Hz value tended to decrease with age (Supplementary Table 1).
DISCUSSION
The result of this study showed substantial agreement among the three overweight screening criteria, consistent with previous stud- ies.
6,7In comparison of agreement between overweight groups (Ta- ble 3), the kappa value between OW1 and OW3 (0.710) was lower than that between OW2 and OW3 (0.891). There was variability in agreement according to age and sex, and the lowest kappa value was in mid-adolescents at approximately the age of peak HT in- crease (Table 3), 13.5 years in boys and 11.5 years in girls.
10In this study, BMI, WT for HT, and ideal body WT were tested as overweight indexes. BMI is a widely accepted screening index for overweight (BMI above 85th percentile) and obesity (BMI above 95th percentile), although the criteria used to assess these states in children and adolescents vary widely.
11In Classification and Diagnosis of Diabetes 2019 published by the American Diabe- tes Association, BMI was the only parameter used for screening type 2 diabetes in asymptomatic children and adolescents.
12Although BMI is used widely as a surrogate measure of adiposity, values in children should be interpreted with caution. BMI is a good indicator for relatively obese children but not for thinner chil- dren.
13,14Many Asians can be classified as normal WT but with obesity based on body composition and fat distribution.
15Due to the limitations of BMI, reference values for body composition components have been produced using various techniques, and the use of body composition charts for children through a personalized therapeutic approach has increased.
15Obesity-related health risks, including diabetes, are likely to be increased when OW3 is considered as the overweight screening criterion, owing to the higher number of missed adolescents (Table 2). Although the OW1 and OW3 criteria demonstrated substantial agreement, the differences in BMI and BMIz should be noted. The OW1 criterion should be used for screening to include more chil- dren and adolescents by focusing on the variability of individual growth.
One girl, who belonged to the OW1 and obesity groups but not to the OW3 group (Fig. 1D), had high WT but was relatively tall.
Considering that the OW3 criterion is based on the ideal WT for HT, the taller is the individual, the greater is the ideal body WT.
Therefore, the girl had a largely ideal body WT for HT and would
Table 4. Comparisons between the overweight (OW1 and OW3) and obesitygroups
Variable OW1 OW3 Obesity
Total (n= 188) (n= 115) (n= 63)
Age (yr) 13.3± 2.5 13.7± 2.7 13.7± 2.5
HT (cm) 160.1± 11.2 159.8± 11.9 161.7± 9.5
WT (kg)† 66.6± 14.3 70.0± 15.4 75.5± 14.1
BMI (kg/m2)*,† 25.7± 2.9 27.0± 2.8 28.6± 2.7
HTz* 0.95± 1.13 0.63± 1.17 0.88± 1.18
WTz† 1.73± 0.59 1.81± 0.68 2.19± 0.59
BMIz*,† 1.61± 0.45 1.82± 0.44 2.11± 0.39
Boy (n= 108) (n= 75) (n= 36)
Age (yr) 13.2± 2.5 13.4± 2.7 13.5± 2.5
HT (cm) 161.8± 13.1 161.0± 13.8 164.0± 11.2
WT (kg)† 69.2± 15.7 71.1± 17.0 78.4± 15.4
BMI (kg/m2)*,† 26.1± 2.6 26.9± 2.7 28.8± 2.2
HTz 0.98± 1.10 0.79± 1.18 1.05± 1.21
WTz† 1.69± 0.56 1.77± 0.64 2.14± 0.55
BMIz*,† 1.57± 0.39 1.72± 0.36 2.02± 0.27
Girl (n= 80) (n= 40) (n= 27)
Age (yr) 13.4± 2.5 14.3± 2.4 13.9± 2.4
HT (cm) 157.9± 7.6 157.4± 6.7 158.5± 5.3
WT (kg)* 63.2± 11.3 67.9± 11.9 71.5± 11.3
BMI (kg/m2)* 25.2± 3.2 27.2± 3.2 28.3± 3.2
HTz* 0.90± 1.18 0.33± 1.11 0.65± 1.13
WTz 1.79± 0.62 1.90± 0.76 2.25± 0.64
BMIz* 1.66± 0.52 2.00± 0.53 2.23± 0.48
OW1 is a group with BMI > 85th percentile for age and sex, OW3 is a group with weight > 120% of ideal for height, and an obesity group is a group with BMI > 95th percentile for age and sex.
*Statistically significant P< 0.05 between OW1 and OW3; †Statistically significant P< 0.05 between the obesity group and OW3.
OW, overweight; HT, height; WT, weight; BMI, body mass index; HTz, z score of HT;
WTz, z score of WT; BMIz, z score of BMI.