R E S E A R C H
Open Access
Association between serum vitamin D status and
health-related quality of life (HRQOL) in an older
Korean population with radiographic knee
osteoarthritis: data from the Korean national
health and nutrition examination survey
(2010
–2011)
Hye-Jung Kim, Jee-Yon Lee, Tae-Jong Kim and Ji-Won Lee
*Abstract
Background: Vitamin D is important in bone health and its relationship with osteoarthritis has recently been reported. Both vitamin D deficiency and knee osteoarthritis are age dependent and are known to affect quality of life (QOL) in older populations. In this study, we aimed to determine the association between vitamin D status and health-related quality of life (HRQOL) in an older Korean population with knee osteoarthritis.
Methods: A total of 2,165 participants aged≥50 years with radiographic knee osteoarthritis defined as Kellgren-Lawrence (KL) grade≥2 were selected from data from the 5th Korean National Health and Nutrition Examination Survey (KNHANES V), a representative cross-sectional nationwide survey conducted in 2010–2011. They stratified into two levels by vitamin D status (deficiency <10 ng/dL and normal≥10 ng/dL). HRQOL was measured using the EuroQOL visual analogue scale (EQ-VAS) and the five dimensions and summary index of the EuroQOL-5 dimension (EQ-5D).
Results: The vitamin D deficiency group was more likely to report problems with mobility, self-care, and usual activities. Vitamin D deficiency was significantly associated with poor HRQOL indicated by the lowest quartile of EQ-VAS (unadjusted odds ratio [OR] =1.832, p = 0.006) and the lowest quartile of the EQ-5D index (unadjusted OR = 1.992, p = 0.003). Theses associations of vitamin D status with EQ-VAS and EQ-5D index were maintained after adjustment for age and sex (Model 1: OR = 1.677, p = 0.022 and OR = 1.701, p = 0.021, respectively). The significant associations of vitamin D status with EQ-VAS were maintained after adjustment for other possible covariates (Model 3: OR = 1.562, p = 0.044). Also, a trend of associations between vitamin D status and EQ-5D index were shown after adjustment for other covariates (Model3: OR = 1.681, p = 0.056).
Conclusion: This is the first study to reveal that vitamin D status is independently associated with HRQOL in an older Korean population with knee osteoarthritis. Our results suggest that the maintenance of sufficient vitamin D status may be important to prevent QOL decline in older populations with knee osteoarthritis.
Keywords: Vitamin D, Quality of life, EQ-VAS, EQ-5D, Osteoarthritis, knee
* Correspondence:[email protected]
Department of Family Medicine, Severance Hospital, Yonsei University College of Medicine, 250 Seongsanno, Seodaemun-gu, Seoul 120-752, Republic of Korea
© 2015 Kim et al.; licensee Biomed Central. This is an Open Access article distributed under the terms of the Creative Commons Attribution License (http://creativecommons.org/licenses/by/4.0), which permits unrestricted use, distribution, and reproduction in any medium, provided the original work is properly credited. The Creative Commons Public Domain Dedication waiver (http://creativecommons.org/publicdomain/zero/1.0/) applies to the data made available in this article, unless otherwise stated.
Background
Vitamin D deficiency is a common problem affecting ap-proximately 1 billion people worldwide [1,2], and elderly persons are more likely to experience vitamin D defi-ciency [3]. The basic role of vitamin D is the mainten-ance of calcium homeostasis and bone health [4]. Although the precise mechanisms remain unknown, vitamin D has recently been shown to be linked with various extraskeletal diseases, such as cardiovascular dis-eases, diabetes, cancer, auto-immune disdis-eases, and de-pressive disorders [5-7]. Furthermore, because these chronic pathologic conditions are known to affect qual-ity of life (QOL), vitamin D deficiency may also be re-lated to QOL in old people. Many previous studies have assessed the relationships between vitamin D status and QOL in subjects with various medical conditions. Recent studies demonstrated the association between vitamin D and health-related QOL (HRQOL) in general older population [8,9]. However, these results were inconsist-ent in other groups of subjects with differinconsist-ent medical conditions [10,11]. These inconsistencies resulted from the differences in methodologies, the association of vita-min D with specific diseases, study design, and study populations [12].
Osteoarthritis is the most common musculoskeletal disorder in older populations [13,14]. It is a major cause of chronic pain and physical disabilities and impairs HRQOL in older people [15,16]. Recently, new evidences are emerging that vitamin D deficiency is associated with osteoarthritis [4,17]. These results raise an expectation that vitamin D status may be a modifiable determinant to prevent QOL impairment in osteoarthritis. However, to our knowledge, no studies have specifically investi-gated the relationship between vitamin D status and HRQOL in older osteoarthritis patients.
Therefore, in the present study, we aimed to assess the association between vitamin D status and HRQOL in Korean elderly population with radiographically confirmed knee osteoarthritis using data from the first and second years (2010–2011) of the fifth Korean National Health and Nutrition Examination Survey (KNHANES V).
Methods
Study population
This cross-sectional study was based on data obtained from the first and second years (2010–2011) of the Korea National Health and Nutrition Examination Survey (KNHANES) V, a nationwide survey conducted by the Korea Center for Disease Control and Prevention. The survey represents the non-institutionalised civilian Korean population and consists of the Health Interview Survey and Health Examination Study. A multistage, stratified, probability sampling method was used, and households for sampling units were selected based on age, sex, and
geographical area. Participants were informed that their household had been randomly selected to participate in this survey performed by the Korea Center for Disease Control and Prevention. They were given the right to re-fuse participation according to the National Health En-hancement Act supported by the National Statistics Law of Korea. All the participants signed an informed consent form.
Of the 17,476 participants in the KNHANES V con-ducted in 2010–1011, we excluded individuals without radiographic knee imaging and participants younger than 50 years. Because radiographic image studies were recommended to subjects aged 50 years and older, 6,327 participants underwent the radiographic examination for bilateral knee joints. After excluding 764 persons with missing data for blood vitamin D measurements (serum 25(OH)D levels), a total of 2,165 participants with radio-graphic knee osteoarthritis defined as Kellgren-Lawrence (KL) grade≥2 were ultimately included in our analysis.
Definition of radiographic knee osteoarthritis
Bilateral antero-posterior, lateral (30° flexion) and weight-bearing antero-posterior plain knee radiographs were taken using a SD 3000 Synchro Stand (Accele Ray SYFM Co., Seoul, Korea), and the radiographic images were reviewed by two radiologists. The degree of radio-graphic knee osteoarthritis was assessed according to the KL grading system: Grade 0, none: no visible features of OA; Grade 1, doubtful: questionable osteophytes or questionable joint space narrowing; Grade 2, minimal: definitive small osteophytes, minimal/mild joint space narrowing; Grade 3, moderate: definitive moderate osteophytes, joint space narrowing of at least 50%; Grade 4, severe: severely impaired joint space, subchondral bone cysts and sclerosis [18,19]. A subject who has radiographic osteoarthritis was defined if the KL grade was greater or equal to two [20].
Demographic and behavioural variables and QOL
Demographic and behavioural variables included age (year), sex (male or female), residential region (urban or rural area), education level (middle school graduation or below), income (high or low, re-categorized from equiva-lized monthly household income expressed in quartiles). Marital status was divided into subjects who were mar-ried and lived with their spouse and subjects who were unmarried, widowed, divorced, or separated. For smok-ing status, subjects were classified into current smokers, ex-smokers, and non-smokers. The International Phys-ical Activity Questionnaire (IPAQ) was adopted to meas-ure physical activity frequency. Regular exercise was defined as participating in vigorous exercise (strenuous or gasping activities, such as running, high-speed cyc-ling, and swimming) more than 3 times per week for ≥
20 min at a time, moderate-intensity exercise (slightly strenuous or gasping activities such as slow swimming, badminton, and table tennis) more than 5 times per week for≥ 30 min at a time, or walking more than 5 times per week for≥ 30 min at a time. Subjects with a history of ei-ther hypertension, diabetes mellitus, dyslipidaemia, cerebro-vascular accident, chronic renal disease, or liver cirrhosis were considered to have a chronic disease comorbidity. Completed questionnaires were reviewed by trained staff and entered in to a database.
Anthropometric measurements were performed by well-trained medical staff following a standardised protocol. Body mass index (BMI) was defined as weight divided by square of height (kg/m2). Waist circumfer-ence (cm) was measured at the umbilicus level with the subject standing and at the narrowest point between the lower border of the rib cage and the uppermost border of the iliac crest during normal expiration.
In KNHANES V, the EuroQOL-5 dimension (EQ-5D), EQ-5D index, and EuroQOL-visual analogue scale (EQ-VAS) developed by the EuroQOL group were used to measure HRQOL. EQ-5D consists of five questions to evaluate the level of self-reported problems in five di-mensions (mobility, self-care, usual activities, pain or discomfort, and depression or anxiety), with three pos-sible answers for each item (1 = no problem, 2 = moder-ate problem, 3 = severe problem) [21]. A summary index with a maximum score of 1 (EQ-5D index) can be calcu-lated by a combination of each score of five dimensions and ranges from −0.171 to 1. The maximum score of 1 on EQ-5D index refer to the best health state with no problem in any of five dimensions. Participants de-scribed their subjective health status using EQ-VAS ran-ging from 0 (the worst imaginable health state) to 100 (the best imaginable health state).
Vitamin D measurement
Blood samples were collected during the fasting state of health examination surveys. After collection, the samples were immediately refrigerated and transported to the designated central laboratory (NeoDin Medical Institute, Seoul, Korea). Serum 25(OH)D levels were measured using a radioimmunoassay kit (DiaSorin Inc., Stillwater, MN) with a 1470 WIZARD gamma–Counter (PerkinElmer, Waltham, MA). The serum 25(OH) D level represents the storage form of vitamin D, and the World Health Organization defined vitamin D deficiency and insuffi-ciency as serum 25(OH)D levels below 25 nmol/L (10 ng/mL) and 50 nmol/L(20 ng/mL), respectively [22]. Also recent studies showed the strong association be-tween vitamin D deficiency lower than 10 ng/mL and various pathologic conditions affecting QOL [23,24]. Therefore, vitamin D status was divided into two groups according to serum 25(OH) D concentration: deficiency
(<10 ng/mL) and normal (≥10 ng/mL) referring to refer-ence literatures [22,25].
Statistical analysis
In all the analyses, the complex sampling and survey sam-ple weights of the KNHANES were used to represent the entire Korean adult population without biased estimates. All data were presented as the estimated number, the weighted mean (SEs) for continuous variables, and the weighted proportions (% SEs) for categorical variables. The clinical characteristics of the study population be-tween the vitamin D deficiency and vitamin D normal groups were compared using the generalised linear model for continuous variables and chi-square tests for categor-ical variables.
Chi-square tests were used to compare the prevalence of problems for each of the EQ-5 dimensions and quar-tiles of EQ-VAS and EQ-5D index according to vitamin D status. The scores in each of five problems were re-classified into two categories. EQ-VAS and EQ-5D index as continuous variables were divided into the quartiles defined as following QOL classification: 1st quartile (poor), 2nd quartile (fair), 3rd quartile (good), and 4th quartile (very good).
To investigate the association between vitamin D sta-tus and poor HRQOL in patients with radiographic knee osteoarthritis, the odds ratios (ORs) and 95% confidence intervals (CIs) for the prevalence of poor HRQOL based on vitamin D status were calculated after adjusting for covariates according to vitamin D status using multivari-ate logistic regression analysis. Before analysis, we classi-fied participants EQ-5D index and EQ-VAS into quartiles. Then, the lowest quartiles of EQ-5D index and EQ-VAS were used as the indicators of poor HRQOL. Covariates included age, sex, body mass index (BMI), waist circumference (WC), education, income, residence, exercise, marital status, smoking status, comorbidity of chronic disease, and KL grade. They were the significant determinants (p value < 0.05) for poor HRQOL in uni-variate logistic regression analysis (data not shown) or clinically important variables on poor HRQOL identified in previous studies [26].
We performed all statistical analyses using the IBM Statistical Package for the Social Sciences, version 20.0 (SPSS Inc., Chicago, IL, USA). Statistical significance was defined as p < 0.05.
Results
Clinical characteristics according to vitamin D status in the study population
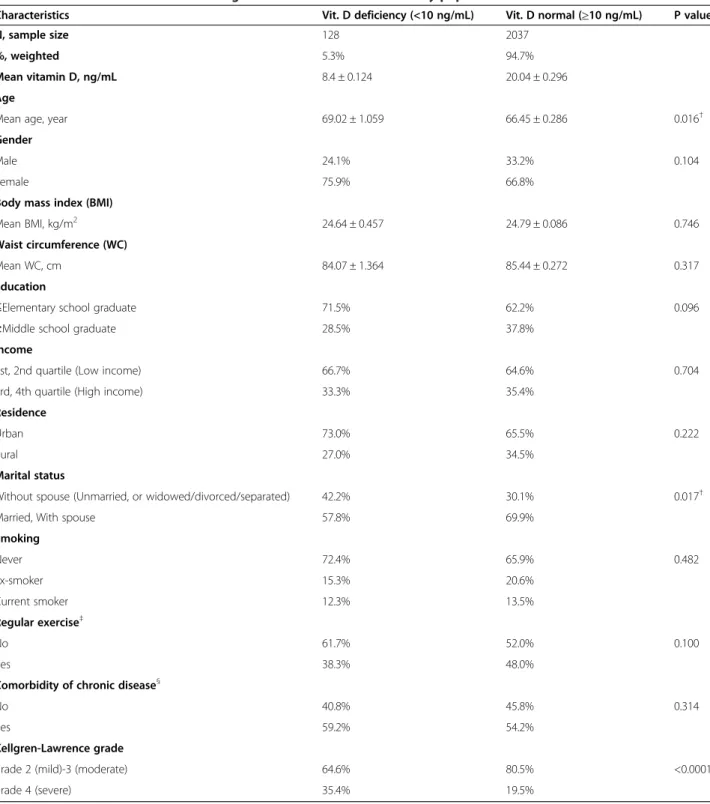
The subjects’ clinical characteristics according to vitamin D status are presented in Table 1. The number and weighted proportion of vitamin D deficiency group were 128 and 5.3%. The mean serum 25(OH)D levels were
Table 1 Clinical characteristics according to vitamin D status in the study population
Characteristics Vit. D deficiency (<10 ng/mL) Vit. D normal (≥10 ng/mL) P value
N, sample size 128 2037
%, weighted 5.3% 94.7%
Mean vitamin D, ng/mL 8.4 ± 0.124 20.04 ± 0.296
Age
Mean age, year 69.02 ± 1.059 66.45 ± 0.286 0.016†
Gender
Male 24.1% 33.2% 0.104
Female 75.9% 66.8%
Body mass index (BMI)
Mean BMI, kg/m2 24.64 ± 0.457 24.79 ± 0.086 0.746
Waist circumference (WC)
Mean WC, cm 84.07 ± 1.364 85.44 ± 0.272 0.317
Education
≤Elementary school graduate 71.5% 62.2% 0.096
≥Middle school graduate 28.5% 37.8%
Income
1st, 2nd quartile (Low income) 66.7% 64.6% 0.704
3rd, 4th quartile (High income) 33.3% 35.4%
Residence
Urban 73.0% 65.5% 0.222
Rural 27.0% 34.5%
Marital status
Without spouse (Unmarried, or widowed/divorced/separated) 42.2% 30.1% 0.017†
Married, With spouse 57.8% 69.9%
Smoking Never 72.4% 65.9% 0.482 Ex-smoker 15.3% 20.6% Current smoker 12.3% 13.5% Regular exercise‡ No 61.7% 52.0% 0.100 Yes 38.3% 48.0%
Comorbidity of chronic disease§
No 40.8% 45.8% 0.314
Yes 59.2% 54.2%
Kellgren-Lawrence grade
grade 2 (mild)-3 (moderate) 64.6% 80.5% <0.0001†
grade 4 (severe) 35.4% 19.5%
Data are presented as weighted proportions unless otherwise indicated. Continuous results presented as weighted mean with standard error.
†Statistically significant p-value≤ 0.05. P-values were determined by chi-square test for categorical variables and t-test for continuous variables.
‡Regular exercise was defined as participating in vigorous exercise (strenuous or gasping activities, such as running, high-speed cycling, and swimming) more than
3 times per week for≥20 min at a time or moderate-intensity exercise (slightly strenuous or gasping activities, such as slow swimming, badminton, and table tennis) more than 5 times per week for≥30 min at a time, or walking more than 5 times per week for ≥30 min at a time.
§
Comorbidity of chronic disease included subjects with hypertension, diabetes, dyslipidaemia, cerebrovascular accident, chronic renal disease, or liver cirrhosis. Abbreviations: BMI, body mass index; Vit. D, vitamin D; WC, waist circumference.
8.45 ± 0.124 and 20.04 ± 0.296 ng/ml for the vitamin D deficiency and vitamin D normal groups, respectively. The vitamin D deficiency group was significantly older (69.02 ± 1.059 vs. 66.45 ± 0.286, p = 0.016) and showed a larger proportion of severe KL grade (35.4% vs. 19.5%, p < 0.0001) compared to the vitamin D normal group. In addition, the proportion of people who lived without their spouse was significantly higher in the vitamin D deficiency group (p = 0.017).
Comparison of the EQ-5 dimensions, EQ-VAS, and EQ-5D index according to vitamin D status
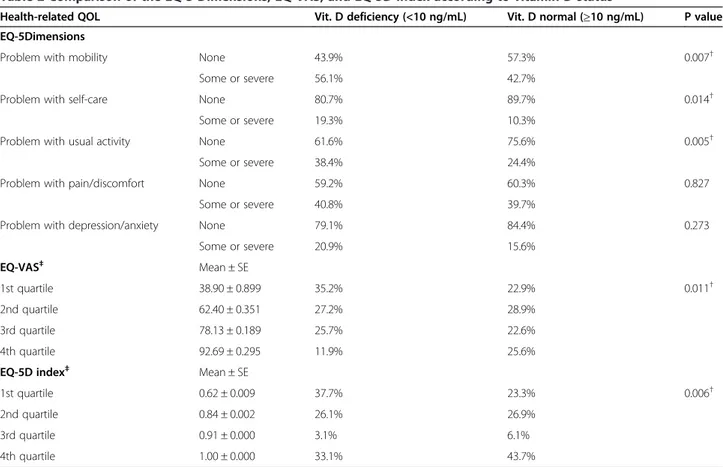
The weighted proportions of problems for each of EQ-5 dimensions and each quartile of EQ-VAS and EQ-5D index according to vitamin D status are presented in Table 2. The proportion of people having problems with mobility, self-care, and usual activity was significantly higher in the vitamin D deficiency group than the vita-min D normal group (56.1% vs. 42.7%, p = 0.007, 19.3% vs. 10.3%, p = 0.014, and 38.4% vs. 24.4%, p = 0.005, respectively). In addition, these differences were still remained when we re-analyzed among subdivided vita-min D groups such as vitavita-min D deficiency (<10 ng/
mL), insufficiency (10-20 ng/mL), and sufficiency (>20 ng/mL).The significant differences were presented between vitamin D deficiency and insufficiency group ra-ther than between vitamin D insufficiency and suffi-ciency groups (56.1% vs 42.8% vs 42.5%, p = 0.049, 19.3% vs 10.9% vs 9.5%, p = 0.028, and 38.4% vs 25.1% vs. 23.6%, p = 0.026, respectively) (Additional file 1). How-ever, there was no significant difference in the propor-tion of people with problems in pain/discomfort or depression/anxiety among vitamin D subgroups. Fur-thermore, the proportions of vitamin D deficient partici-pants in the 1st (lowest) quartiles of EQ-VAS and EQ-5D index defined as poor HRQOL were significantly higher compared with the vitamin D normal group (35.2% vs. 22.9%, p = 0.011 and 37.7% vs. 23.3%, p = 0.006, respectively) (Table 2) and compared with the vitamin D insufficiency and sufficiency groups (35.2% vs. 22.7% vs. 23.2%, p = 0.040 and 37.7% vs. 23.8% vs. 22.8%, p = 0.114, respectively) (Additional file 1).
Prevalence of poor HRQOL based on vitamin D status
To assess the association between vitamin D deficiency and poor HRQOL, we compared the prevalence of poor
Table 2 Comparison of the EQ-5 Dimensions, EQ-VAS, and EQ-5D index according to vitamin D status
Health-related QOL Vit. D deficiency (<10 ng/mL) Vit. D normal (≥10 ng/mL) P value EQ-5Dimensions
Problem with mobility None 43.9% 57.3% 0.007†
Some or severe 56.1% 42.7%
Problem with self-care None 80.7% 89.7% 0.014†
Some or severe 19.3% 10.3%
Problem with usual activity None 61.6% 75.6% 0.005†
Some or severe 38.4% 24.4%
Problem with pain/discomfort None 59.2% 60.3% 0.827
Some or severe 40.8% 39.7%
Problem with depression/anxiety None 79.1% 84.4% 0.273
Some or severe 20.9% 15.6% EQ-VAS‡ Mean ± SE 1st quartile 38.90 ± 0.899 35.2% 22.9% 0.011† 2nd quartile 62.40 ± 0.351 27.2% 28.9% 3rd quartile 78.13 ± 0.189 25.7% 22.6% 4th quartile 92.69 ± 0.295 11.9% 25.6%
EQ-5D index‡ Mean ± SE
1st quartile 0.62 ± 0.009 37.7% 23.3% 0.006†
2nd quartile 0.84 ± 0.002 26.1% 26.9%
3rd quartile 0.91 ± 0.000 3.1% 6.1%
4th quartile 1.00 ± 0.000 33.1% 43.7%
Data are presented as weighted proportions unless otherwise indicated. Continuous results presented as weighted mean with standard error.
†Statistically significant p-value≤ 0.05. P-values were determined by chi-square test.
‡The quartiles of EQ-VAS and EQ-5D index were defined as the following QOL classification: 1st quartile (poor), 2nd quartile (fair), 3rd quartile (good), 4th quartile
(very good).
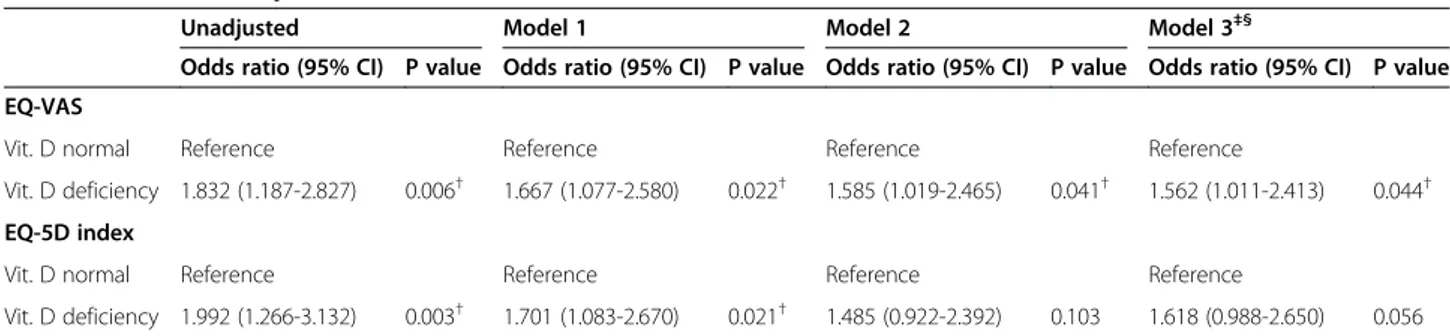
HRQOL (the first quartile of EQ-VAS and EQ-5Dindex) based on vitamin D status. The odds ratios(OR) and 95% confidence intervals (95% CI) for the prevalence of poor HRQOL in vitamin D deficiency compared to vitamin D normal group are shown in Table 3. In the unadjusted analysis, vitamin D deficiency was significantly associ-ated with the first quartile of EQ-VAS with an OR of 1.832 (95% CI 1.187–2.827, p = 0.006) and the first quartile of EQ-5D index with an OR of 1.992 (95% CI 1.266–3.132, p = 0.003). The multivariate OR for the low EQ-VAS and the low EQ-5D index comparing the vita-min D deficiency with vitavita-min D normal groups were 1.677 ( p = 0.022) and 1.701 (p = 0.021) after adjustment for age and sex which were important demographic fac-tors in HRQOL(Model1). The multivariate ORs for the low EQ-VAS and EQ-5D index as poor HRQOL indices in vitamin D deficiency group versus vitamin D normal group were 1.585 (p = 0.041) and 1.485(p = 0.103), re-spectively, after adjustment for marital status and KL grade which showed significantly different characteristics by vitamin D status in addition to age and sex in Model 2. Although statistical significance were not remained in EQ-5D index, they still showed a trend of higher preva-lence of poor HRQOL in vitamin D deficiency group (OR 1.618, p = 0.056) after combined adjustment for other covariates (Model3). Furthermore, the multivariate ORs for the lowest quartile of EQ-VAS in vitamin D de-ficiency group versus vitamin D normal group was 1.562 (p = 0.044) after combined adjustment for other possible covariates (Model3).
Additionally, vitamin D deficiency group showed a sig-nificant association with poor HRQOL indices such as EQ-VAS (OR = 2.360, p = 0.024 in Model 1, OR = 2.291,
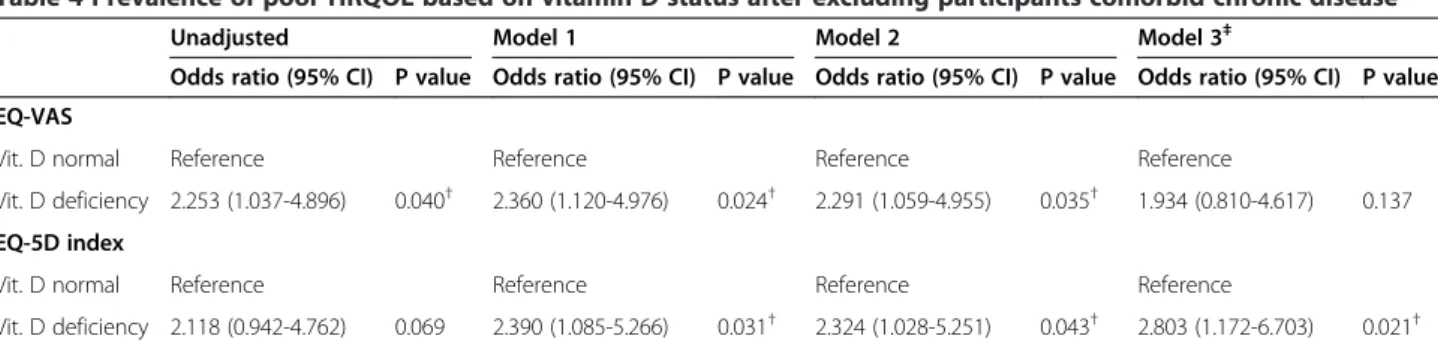
p = 0.035 in Model 2, and OR = 1.934, p = 0.137 in Model 3) and EQ-5D index (OR =2.390, p = 0.031 in Model 1, OR = 2.324, p = 0.043 in Model 2, and OR = 2.803, p = 0.021 in Model 3) when we re-analyzed after excluding participants comorbid with chronic diseases to control the impact of other chronic diseases completely (Table 4). Their sample size were 903(95.3%) for vitamin D normal group and 46(4.7%) for vitamin D deficiency group, respectively.
Discussion
In this nationwide cross-sectional study, we examined a possible association between vitamin D status and HRQOL using a representative sample of an older Ko-rean population (≥50 years) with radiographically con-firmed knee osteoarthritis. We found that vitamin D deficiency was associated with poor QOL independently of other covariates and possible confounders, including age, sex, BMI, waist circumference, education, income, residence, exercise, marital status, smoking status, co-morbidity of chronic disease, and KL grade, in an older Korean population with knee osteoarthritis.
Recently, a role of vitamin D in QOL was identified in various disease groups, as well as the general population. However, many results are inconclusive and often contradictory [10,11,27-29]. The methodologic inconsist-encies for measurement of vitamin D and HRQOL, dif-ferences in study design, and the great heterogeneity in study populations (healthy vs diseased) would make it difficult to draw conclusions [12]. To the best of our knowledge, this is the first study that investigated the as-sociation between vitamin D and HRQOL limited in an older population with knee osteoarthritis.
Table 3 Prevalence of poor HRQOL based on vitamin D status
Unadjusted Model 1 Model 2 Model 3‡§
Odds ratio (95% CI) P value Odds ratio (95% CI) P value Odds ratio (95% CI) P value Odds ratio (95% CI) P value EQ-VAS
Vit. D normal Reference Reference Reference Reference
Vit. D deficiency 1.832 (1.187-2.827) 0.006† 1.667 (1.077-2.580) 0.022† 1.585 (1.019-2.465) 0.041† 1.562 (1.011-2.413) 0.044† EQ-5D index
Vit. D normal Reference Reference Reference Reference
Vit. D deficiency 1.992 (1.266-3.132) 0.003† 1.701 (1.083-2.670) 0.021† 1.485 (0.922-2.392) 0.103 1.618 (0.988-2.650) 0.056
To see the association between vitamin D deficiency and poor HRQOL, we compared the prevalence of poor HRQOL (the first quartile of EQ-VAS and EQ-5D index) based on vitamin D status. Vitamin D status were classified into 2 groups according to serum 25(OH)D concentration : Vitamin D normal (≥10 ng/mL)
and deficiency(<10 ng/mL).
†Statistically significant p-value≤ 0.05. P-values were determined by multivariate logistic regression analysis.
Model1: Adjusted for age & gender.
Model2: Adjusted for age, gender + marital status, KL grade.
Model3: Adjusted for age, gender + marital status, KL grade + education, income, residence, smoking, regular exercise‡, comorbidity of chronic diseases§
, BMI, WC.
‡Regular exercise was defined as participating in vigorous exercise (strenuous or gasping activities, such as running, high-speed cycling, and swimming) more than
3 times per week for≥20 min at a time or moderate-intensity exercise (slightly strenuous or gasping activities, such as slow swimming, badminton, and table tennis) more than 5 times per week for≥30 min at a time, or walking more than 5 times per week for ≥30 min at a time.
§
Comorbidity of chronic disease included subjects with hypertension, diabetes, dyslipidaemia, cerebrovascular accident, chronic renal disease, or liver cirrhosis. Abbreviation: CI, confidence interval; BMI, body mass index; EQ-5D, EuroQOL-5 dimension; EQ-VAS, EuroQOL-visual analogue scale; HRQOL, health-related quality of life; KL grade, Kellgren-Lawrence grade; QOL, quality of life; Vit. D, vitamin D; WC, waist circumference.
The prevalence of vitamin D deficiency in our study population was 5.3% lower than other studies. These may resulted from a different definition of vitamin D deficiency and different study populations. Also, inter-method vari-ability in 25(OH)D measurements seems to contribute to this result [30,31]. Therefore, standardization of methods for the quantification of 25(OH)D on a human-based sam-ple panel would be required to reduce the inter-method variability and establish reference values for 25(OH)D in further studies.
Although we could not determine causality with our cross-sectional study, we suggest three possible underlying mechanisms. First, comparing clinical characteristics ac-cording to vitamin D status, the vitamin D deficiency group included a higher proportion of subjects with the severe form of radiographic osteoarthritis (higher KL grade). This finding is in line with previous studies show-ing that low vitamin D levels were associated with struc-tural changes and progression of radiographic knee osteoarthritis [16]. Although the pathogenesis of osteo-arthritis is not clear, recent studies suggested that an im-balance of the subchondral bone remodeling may initiate the degenerative change [32]. Vitamin D deficiency may contribute to this degenerative change in such a way that the decrease in serum 25(OH)D concentration accelerates osteoclastogenesis and bone resorption [1]. Therefore, vitamin D deficiency may aggravate pathologic knee osteo-arthritis changes, and this may be one mechanism to explain HRQOL impairment in this population.
Muscular weakness may be another physiological ex-planation for the association between vitamin D deficiency and impaired QOL. Several previous studies demonstrated
that vitamin D supplementation reduced the risks of falls and fractures, and these results were explained by the beneficial effect of vitamin D on muscle strength, balance, and bone health in older populations [33,34]. These find-ings were partly consistent with other studies in subjects with knee osteoarthritis [35]. Furthermore, muscular weakness is a well-known risk factor for decreased QOL in older populations with and without knee osteoarthritis [36-38]. Although the precise relationship between mus-cular weakness and QOL is not fully understood, declines in mobility [39] and daily activity performance [40] due to muscular weakness is considered to contribute to im-paired QOL in elderly subjects. We found that the vitamin D deficiency group showed a higher proportion of prob-lems with mobility and usual activities compared with the vitamin D normal group, which is in line with previous studies reporting a positive association of vitamin D with muscle strength and physical performance [35,41]. There-fore, muscular weakness induced by vitamin D deficiency may affect HRQOL in this population.
The third possible physiological mechanism that could explain the relationship between vitamin D deficiency and poor QOL is impairment of self-care and usual activities related to cognitive function. A recent study revealed that vitamin D levels were associated with cognitive function, which is an important factor affecting QOL in older people with chronic conditions [41]. Furthermore, previ-ous studies have reported significant declines of self-care [42] and usual activities in patients with cognitive impair-ment [43,44]. Although we could not evaluate cognitive function in our study population, our results showed sig-nificant impairment of self-care and usual activities in the
Table 4 Prevalence of poor HRQOL based on vitamin D status after excluding participants comorbid chronic disease*
Unadjusted Model 1 Model 2 Model 3‡
Odds ratio (95% CI) P value Odds ratio (95% CI) P value Odds ratio (95% CI) P value Odds ratio (95% CI) P value EQ-VAS
Vit. D normal Reference Reference Reference Reference
Vit. D deficiency 2.253 (1.037-4.896) 0.040† 2.360 (1.120-4.976) 0.024† 2.291 (1.059-4.955) 0.035† 1.934 (0.810-4.617) 0.137 EQ-5D index
Vit. D normal Reference Reference Reference Reference
Vit. D deficiency 2.118 (0.942-4.762) 0.069 2.390 (1.085-5.266) 0.031† 2.324 (1.028-5.251) 0.043† 2.803 (1.172-6.703) 0.021†
To control the impact of other chronic diseases, we compared the prevalence of poor HRQOL (the first quartile of EQ-VAS and EQ-5Dindex) based on vitamin D status after excluding participants comorbid chronic disease*. Vitamin D status were classified into two groups according to serum 25(OH)D concentration: Vitamin D normal (≥10 ng/mL) and deficiency (<10 ng/mL).
*Participancts comorbid chronic disease included subjects with hypertension, diabetes, dyslipidaemia, cerebrovascular accident, chronic renal disease, or liver cirrhosis.
†Statistically significant p-value≤ 0.05. P-values were determined by multivariate logistic regression analysis.
Model1: Adjusted for age & gender.
Model2: Adjusted for age, gender + marital status, KL grade.
Model3: Adjusted for age, gender + marital satus, KL grade + education, income, residence, smoking, regular exercise‡, BMI, WC.
‡Regular exercise was defined as participating in vigorous exercise (strenuous or gasping activities, such as running, high-speed cycling, and swimming) more than
3 times per week for≥20 min at a time or moderate-intensity exercise (slightly strenuous or gasping activities, such as slow swimming, badminton, and table tennis) more than 5 times per week for≥30 min at a time, or walking more than 5 times per week for ≥30 min at a time.
Abbreviation: CI, confidence interval; BMI, body mass index; EQ-5D, EuroQOL-5 dimension; EQ-VAS, EuroQOL-visual analogue scale; HRQOL, health-related quality of life; KL grade, Kellgren-Lawrence grade; QOL, quality of life; Vit. D, vitamin D; WC, waist circumference.
vitamin D deficiency group compared with the control group. Therefore, it is possible to hypothesise that prob-lems with self-care and usual activities related to cognitive impairment may affect the QOL in population with knee osteoarthritis. Further prospective interventional studies that assess cognitive function are needed to investigate the precise role of cognitive function in association with vita-min D and QOL in osteoarthritis patients.
Unlike several previous studies [9,45], we did not find a difference in the proportion of subjects with pain/dis-comfort and depression/anxiety between the vitamin D deficiency and normal groups. These inconsistencies may result from an underestimation for problems with ‘pain or discomfort’ in subjects with knee osteoarthritis due to their use of analgesics, small sample size in vita-min D deficiency group, and different populations. Therefore, further studies are necessary to assess the contribution of vitamin D status to physical and mental components of QOL in a large number of subjects with knee osteoarthritis.
Our study has several limitations. First, this was a cross-sectional study and is thus unable to establish a causal relationship between vitamin D and HRQOL. Sec-ond, although we adjusted for possible confounding co-variates, we acknowledge that other factors may have affected the association between vitamin D and HRQOL because of inadequacies in data use. For example, the nutrition status, sun exposure, and comorbidity of osteo-porosis were not included, despite their known influ-ences on vitamin D status and HRQOL [46-48]. The third limitation is related to the use of self-reported questionnaires that are prone to error, even though the EQ-5D and EQ-VAS are well-established, validated instruments.
Despite these limitations, this is the first study to in-vestigate the association between vitamin D and the five HRQOL dimensions in an older population with knee osteoarthritis using population-based data. We suggested that vitamin D measurement at the time of diagnosing osteoarthritis and vitamin D supplementation for vita-min D deficient patients with knee osteoarthritis would be considered to prevent the QOL decline if well-founded studies have been collected.
Conclusion
In conclusion, vitamin D status was independently asso-ciated with HRQOL in an older Korean population with knee osteoarthritis. Although we could not determine causality, our results collectively suggested that the maintenance of sufficient vitamin D status may be im-portant to prevent QOL decline in an older population with knee osteoarthritis. Further studies to investigate a possible causal relationship and to clarify the precise mechanisms underlying the association of vitamin D
with HRQOL should be performed by randomized con-trolled trials and cohort studies. Additionally, it is neces-sary to determine the sufficient level of vitamin D considering the effects of nutritional status and to iden-tify other nutritional factors potentially affecting HRQOL in those with knee osteoarthritis.
Additional file
Additional file 1: Comparison of the EQ-5 Dimensions, EQ-VAS, and EQ-5D index among vitamin D subgroups.
Competing interests
The authors declare that they have no competing interests. Authors’ contributions
HJK and JYL led the design and conception of the study concept and design, performed data analysis, and wrote the manuscript. TJK contributed of the study concept and design. JWL contributed of the study concept and design, reviewing and final editing of the manuscript. All authors read and approved the final manuscript.
Acknowledgement
This research was supported by the Bio & Medical Technology Development Program of the National Research Foundation (NRF) funded by the Ministry of Science, ICT & Future Planning, Republic of Korea
(NRF-2013M3A9B6046416).
Received: 2 September 2014 Accepted: 11 April 2015
References
1. Adams JS, Hewison M. Update in vitamin D. J Clin Endocrinol Metab. 2010;95:471–8.
2. Holick MF. Vitamin D deficiency. N Engl J Med. 2007;357:266–81. 3. De Rui M, Toffanello ED, Veronese N, Zambon S, Bolzetta F, Sartori L, et al.
Vitamin D deficiency and leisure time activities in the elderly: are all pastimes the same? PLoS One. 2014;9:e94805.
4. Christodoulou S, Goula T, Ververidis A, Drosos G. Vitamin D and bone disease. Biomed Res Int. 2013;2013:396541.
5. Christakos S, Hewison M, Gardner DG, Wagner CL, Sergeev IN, Rutten E, et al. Vitamin D: beyond bone. Ann N Y Acad Sci. 2013;1287:45–58. 6. Holick MF, Chen TC. Vitamin D deficiency: a worldwide problem with health
consequences. Am J Clin Nutr. 2008;87:1080s–6s.
7. Hoogendijk WJ, Lips P, Dik MG, Deeg DJ, Beekman AT, Penninx BW. Depression is associated with decreased 25-hydroxyvitamin D and increased parathyroid hormone levels in older adults. Arch Gen Psychiatry.
2008;65:508–12.
8. Rafiq R, Swart KM, van Schoor NM, Deeg DJ, Lips P, de Jongh RT. Associations of serum 25-hydroxyvitamin D concentrations with quality of life and self-rated health in an older population. J Clin Endocrinol Metab. 2014;99(9):3136–43.
9. Chao YS, Ekwaru JP, Ohinmaa A, Griener G, Veugelers PJ. Vitamin D and health-related quality of life in a community sample of older Canadians. Qual Life Res. 2014;23(9):2569–75.
10. Witham MD, Crighton LJ, Gillespie ND, Struthers AD, McMurdo ME. The effects of vitamin D supplementation on physical function and quality of life in older patients with heart failure: a randomized controlled trial. Circ Heart Fail. 2010;3:195–201.
11. Chlebowski RT, Johnson KC, Kooperberg C, Pettinger M, Wactawski-Wende J, Rohan T, et al. Calcium plus vitamin D supplementation and the risk of breast cancer. J Natl Cancer Inst. 2008;100:1581–91.
12. Hoffmann MR, Senior PA, Mager DR. Vitamin D supplementation and health-related quality of life: a systematic review of the literature. J Acad Nutr Diet. 2015;115(3):406–18.
13. Felson DT. Clinical practice. Osteoarthritis of the knee. N Engl J Med. 2006;354:841–8.
14. Vos T, Flaxman AD, Naghavi M, Lozano R, Michaud C, Ezzati M, et al. Years lived with disability (YLDs) for 1160 sequelae of 289 diseases and injuries 1990–2010: a systematic analysis for the Global Burden of Disease Study 2010. Lancet. 2012;380:2163–96.
15. Shane Anderson A, Loeser RF. Why is osteoarthritis an age-related disease? Best Pract Res Clin Rheumatol. 2010;24:15–26.
16. YS J, AJ S. Health status, health behavior, and quality of life in the elderly with osteoarthritis. Nursing Science. 2011;23:23–33.
17. Cao Y, Winzenberg T, Nguo K, Lin J, Jones G, Ding C. Association between serum levels of 25-hydroxyvitamin D and osteoarthritis: a systematic review. Rheumatology (Oxford). 2013;52:1323–34.
18. Moon KH. New view on the initial development site and radiographic classification system of osteoarthritis of the knee based on radiographic analysis. Int J Biomed Sci. 2012;8:233–43.
19. Dahaghin S, Bierma-Zeinstra SM, Ginai AZ, Pols HA, Hazes JM, Koes BW. Prevalence and pattern of radiographic hand osteoarthritis and association with pain and disability (the Rotterdam study). Ann Rheum Dis. 2005;64:682–7.
20. Schiphof D, Boers M, Bierma-Zeinstra SM. Differences in descriptions of Kellgren and Lawrence grades of knee osteoarthritis. Ann Rheum Dis. 2008;67:1034–6.
21. Rabin R, de Charro F. EQ-5D: a measure of health status from the EuroQol Group. Ann Med. 2001;33:337–43.
22. Prevention and management of osteoporosis. World Health Organ Tech Rep Ser. 2003;921:1–164.
23. Schiller A, Apetrii M, Onofriescu M, Siriopol D, Veisa G, Schiller O, et al. Prognostic significance of 25-hydroxivitamin D entirely explained by a higher comorbidity burden: experience from a South-Eastern European dialysis cohort. Hemodial Int. 2015;19(2):249–55.
24. Laslett LL, Quinn S, Burgess JR, Parameswaran V, Winzenberg TM, Jones G, et al. Moderate vitamin D deficiency is associated with changes in knee and hip pain in older adults: a 5-year longitudinal study. Ann Rheum Dis. 2014;73:697–703.
25. Schoenmakers I, Goldberg GR, Prentice A. Abundant sunshine and vitamin D deficiency. Br J Nutr. 2008;99:1171–3.
26. Muller-Nordhorn J, Muckelbauer R, Englert H, Grittner U, Berger H, Sonntag F, et al. Longitudinal association between body mass index and health-related quality of life. PLoS One. 2014;9:e93071.
27. Anand S, Kaysen GA, Chertow GM, Johansen KL, Grimes B, Dalrymple LS, et al. Vitamin D deficiency, self-reported physical activity and health-related quality of life: the Comprehensive Dialysis Study. Nephrol Dial Transplant. 2011;26:3683–8.
28. Basaran S, Guzel R, Coskun-Benlidayi I, Guler-Uysal F. Vitamin D status: effects on quality of life in osteoporosis among Turkish women. Qual Life Res. 2007;16:1491–9.
29. Ulitsky A, Ananthakrishnan AN, Naik A, Skaros S, Zadvornova Y, Binion DG, et al. Vitamin D deficiency in patients with inflammatory bowel disease: association with disease activity and quality of life. JPEN J Parenter Enteral Nutr. 2011;35:308–16.
30. Holmes EW, Garbincius J, McKenna KM. Analytical variability among methods for the measurement of 25-hydroxyvitamin D: still adding to the noise. Am J Clin Pathol. 2013;140:550–60.
31. Holick MF. Vitamin D status: measurement, interpretation, and clinical application. Ann Epidemiol. 2009;19:73–8.
32. Kwan Tat S, Lajeunesse D, Pelletier JP, Martel-Pelletier J. Targeting subchondral bone for treating osteoarthritis: what is the evidence? Best Pract Res Clin Rheumatol. 2010;24:51–70.
33. Bischoff-Ferrari HA, Dawson-Hughes B, Willett WC, Staehelin HB, Bazemore MG, Zee RY, et al. Effect of Vitamin D on falls: a meta-analysis. Jama. 2004;291:1999–2006.
34. Bischoff-Ferrari HA, Willett WC, Wong JB, Giovannucci E, Dietrich T, Dawson-Hughes B. Fracture prevention with vitamin D supplementation: a meta-analysis of randomized controlled trials. Jama. 2005;293:2257–64. 35. Barker T, Henriksen VT, Rogers VE, Aguirre D, Trawick RH, Lynn Rasmussen G,
et al. Vitamin D deficiency associates with gamma-tocopherol and quadriceps weakness but not inflammatory cytokines in subjects with knee osteoarthritis. Redox Biol. 2014;2:466–74.
36. Rantanen T. Muscle strength, disability and mortality. Scand J Med Sci Sports. 2003;13:3–8.
37. Takata Y, Ansai T, Soh I, Awano S, Yoshitake Y, Kimura Y, et al. Quality of life and physical fitness in an 85-year-old population. Arch Gerontol Geriatr. 2010;50:272–6.
38. Al-Johani AH, Kachanathu SJ, Ramadan Hafez A, Al-Ahaideb A, Algarni AD, Meshari Alroumi A, et al. Comparative study of hamstring and quadriceps strengthening treatments in the management of knee osteoarthritis. J Phys Ther Sci. 2014;26:817–20.
39. Reid KF, Callahan DM, Carabello RJ, Phillips EM, Frontera WR, Fielding RA. Lower extremity power training in elderly subjects with mobility limitations: a randomized controlled trial. Aging Clin Exp Res. 2008;20:337–43. 40. Koopman FS, Beelen A, Gerrits KH, Bleijenberg G, Abma TA, de Visser M,
et al. Exercise therapy and cognitive behavioural therapy to improve fatigue, daily activity performance and quality of life in postpoliomyelitis syndrome: the protocol of the FACTS-2-PPS trial. BMC Neurol. 2010;10:8. 41. Skalska A, Galas A, Grodzicki T. 25-hydroxyvitamin D and physical and cognitive
performance in older people with chronic conditions. Pol Arch Med Wewn. 2012;122:162–9.
42. Hajduk AM, Lemon SC, McManus DD, Lessard DM, Gurwitz JH, Spencer FA, et al. Cognitive impairment and self-care in heart failure. Clin Epidemiol. 2013;5:407–16.
43. Van Schependom J, D’Hooghe MB, De Schepper M, Cleynhens K, D’Hooge M, Haelewyck MC, et al. Relative contribution of cognitive and physical disability components to quality of life in MS. J Neurol Sci. 2014;336:116–21. 44. van Dijk GM, Veenhof C, Lankhorst GJ, Dekker J. Limitations in activities in
patients with osteoarthritis of the hip or knee: the relationship with body functions, comorbidity and cognitive functioning. Disabil Rehabil. 2009;31:1685–91.
45. Costan AR, Vulpoi C, Mocanu V. Vitamin D fortified bread improves pain and physical function domains of quality of life in nursing home residents. J Med Food. 2014;17:625–31.
46. Jimenez-Redondo S, Beltran de Miguel B, Gavidia Banegas J, GuzmanMercedes L, Gomez-Pavon J, Cuadrado Vives C. Influence of nutritional status on health-related quality of life of non-institutionalized older people. J Nutr Health Aging. 2014;18:359–64.
47. Le Goaziou MF, Contardo G, Dupraz C, Martin A, Laville M, Schott-Pethelaz AM. Risk factors for vitamin D deficiency in women aged 20–50 years consulting in general practice: a cross-sectional study. Eur J Gen Pract. 2011;17:146–52.
48. Ohta H, Uemura Y, Nakamura T, Fukunaga M, Ohashi Y, Hosoi T, et al. Serum 25-hydroxyvitamin D level as an independent determinant of quality of life in osteoporosis with a high risk for fracture. Clin Ther. 2014;36:225–35.
Submit your next manuscript to BioMed Central and take full advantage of:
• Convenient online submission
• Thorough peer review
• No space constraints or color figure charges
• Immediate publication on acceptance
• Inclusion in PubMed, CAS, Scopus and Google Scholar
• Research which is freely available for redistribution
Submit your manuscript at www.biomedcentral.com/submit