Original Article
Received: Mar 23, 2016; Revised: May 14, 2016; Accepted: May 23, 2016 Correspondence to: Jun Ho Lee
Department of Urology, National Police Hospital, 123 Songi-ro, Songpa-gu, Seoul 05715, Korea.
Tel: +82-2-3410-1266, Fax: +82-2-431-3192, E-mail: [email protected] Copyright © 2016 Korean Society for Sexual Medicine and Andrology
This is an Open Access article distributed under the terms of the Creative Commons Attribution Non-Commercial License (http://creativecommons.
org/licenses/by-nc/4.0) which permits unrestricted non-commercial use, distribution, and reproduction in any medium, provided the original work is properly cited.
Obesity in Korean Men: Results from the Fourth through Sixth Korean National Health and Nutrition Examination Surveys (2007∼2014)
Yeon Won Park1, Kwi Bok Choi1, Soon Ki Kim1, Dong-Gi Lee2, Jun Ho Lee1
1Department of Urology, National Police Hospital, 2Department of Urology, Kyung Hee University School of Medicine, Seoul, Korea
Purpose: Obesity is related to many diseases, including urological conditions. We investigated the prevalence, risk factors, and treatment of male obesity.
Materials and Methods: This study included 17,485 men older than 20 years of age who participated in the fourth, fifth, and sixth administrations of the Korean National Health and Nutrition Examination Survey. Two main cutoff points for obesity were defined: a body mass index (BMI) ≥25 kg/m2 and a BMI≥30 kg/m2. Additionally, we defined obesity requiring pharma- cotherapy as the presence of a BMI≥30 kg/m2 or a BMI≥27 kg/m2 co-occurring with at least one associated comorbid medical condition, such as hypertension, dyslipidemia, or diabetes.
Results: The prevalence rates of a BMI≥25 kg/m2, a BMI≥30 kg/m2, and obesity requiring pharmacotherapy were 35.7%, 3.4%, and 10.5%, respectively. The prevalence of obesity increased over time for all definitions of obesity. The prevalence of obesity requiring pharmacotherapy was highest in Jeju (12.5%) and lowest in Gangwon-do (7.7%). Having a higher income, being a non-manual worker, and having completed a high level of education were significantly related to obesity requiring pharma- cotherapy. More than 70% of patients with obesity requiring pharmacotherapy reported taking diet pills, eating functional foods, or consuming a one-food diet for weight reduction, but only 13.9% reported exercising for this purpose.
Conclusions: Male obesity is a common condition, the prevalence of which is expected to continue to increase over time. A better strategy is required to manage male obesity in Korea.
Key Words: Body mass index; Obesity; Prevalence
INTRODUCTION
Obesity is known to be an important health problem, and is significantly related to many disorders, such as hy- pertension, diabetes, and dyslipidemia [1,2]. The life ex-
pectancy of obese people has been reported to be up to seven years shorter than that of normal-weight individuals [1,2]. Moreover, obesity is related to urological diseases such as erectile dysfunction [3] and benign prostatic hy- perplasia [4], which may have a significant impact on
http://dx.doi.org/10.5534/wjmh.2016.34.2.129
men’s quality of life.
Some previous studies have evaluated the prevalence of obesity in South Korea. However, previous studies have defined obesity as a body mass index (BMI) ≥25 kg/m2, and few data have been reported regarding severe obesity (e.g., BMI≥30 kg/m2) or obesity requiring pharmaco- therapy. Additionally, few systematic studies have been published regarding overall male obesity and trends in its prevalence, risk factors, and treatment. Since sex-based differences have been identified in the prevalence of obe- sity and related lifestyle factors, the above issues must be addressed in order to promote health and mobilize obe- sity-related healthcare services. Therefore, we carried out the present study, in which we used data from the Korea National Health and Nutrition Examination Survey (KNHANES) to investigate adult male obesity in Korea.
MATERIALS AND METHODS
1. Study participants
The KNHANES is regularly performed by the Korea Centers for Disease Control and Prevention to examine the general health and nutritional status of Koreans. In or- der to obtain representative data regarding the Korean population, the study uses a stratified three-stage clustered probability design (local district → enumeration district → household). To date, six surveys have been completed: I (1998), II (2001), III (2005), IV (2007∼2009), V (2010∼
2012), and VI (2013∼2015). In order to identify serial trends in male obesity, we used data from the KNHANES IV, V, and VI because the intervals between the KNHANES I, II, and III were irregular. The KNHANES IV, V, and VI en- rolled 31,705, 31,596, and 19,814 individuals, re- spectively, of whom 24,971, 25,553, and 15,568 people participated in the survey, respectively. In order to de- termine the prevalence, characteristics, and health behav- iors of obese adult males, data from females and partic- ipants younger than 20 years of age were excluded.
Participants with missing BMI data (n=1,573) were also excluded, as were those with missing data concerning hy- pertension, diabetes, or dyslipidemia (n=2,323). Ultimately, 17,485 men were included in this study.
2. Participant characteristics
Places of residence were classified as urban (dong) or rural (eup/myeon). Household income was divided into quartiles according to standard income charts. Partici- pants were classified by occupation as manual workers or non-manual workers according to the Korean Standard Classification of Occupations. Service workers, managers, professionals, salespeople, clerical workers, and pro- fessors were included in the non-manual worker category.
Those who performed simple labor or worked in the sec- tors of agriculture, forestry, fishery, or manufacturing were classified as manual workers. Cohabitation was defined as current cohabitation regardless of marriage. Additionally, education level was determined according to the highest level of education.
3. Evaluation of body mass index, obesity, and comorbidities
A portable stadiometer was used to measure height to the nearest 0.1 cm, and a calibrated balance-beam scale was used to measure weight to the nearest 0.1 kg. The BMI was calculated using the following formula: weight (kg)/
height squared (m2). Obesity was defined using multiple criteria: a BMI ≥25 kg/m2 and a BMI ≥30 kg/m2 accord- ing to the Korean Society for the Study of Obesity [5], as well as a BMI ≥27.5 kg/m2 according to the World Health Organization guidelines for Asians [5]. Waist circumfe- rence was measured to the nearest 0.1 cm midway bet- ween the lowest rib and the iliac crest. Additionally, obe- sity requiring pharmacotherapy was defined as the pres- ence of a BMI ≥30 kg/m2 or the co-occurrence of a BMI ≥ 27 kg/m2 with at least one associated comorbid medical condition, such as hypertension, dyslipidemia, diabetes, or obstructive sleep apnea [6]. Hypertension was defined as a systolic blood pressure ≥140 mmHg, a diastolic blood pressure ≥90 mmHg, or the current use of antihyperten- sive drugs. Diabetes was defined as a fasting blood sugar level ≥126 mg/dL, a current prescription for antidiabetic drugs or insulin, or a diagnosis by a doctor. Hyperchole- sterolemia was defined as total cholesterol ≥240 mg/dL or the use of anti-hypercholesterolemia drugs. The data contained in the KNHANES did not allow us to incorpo- rate an analysis of obstructive sleep apnea into the study.
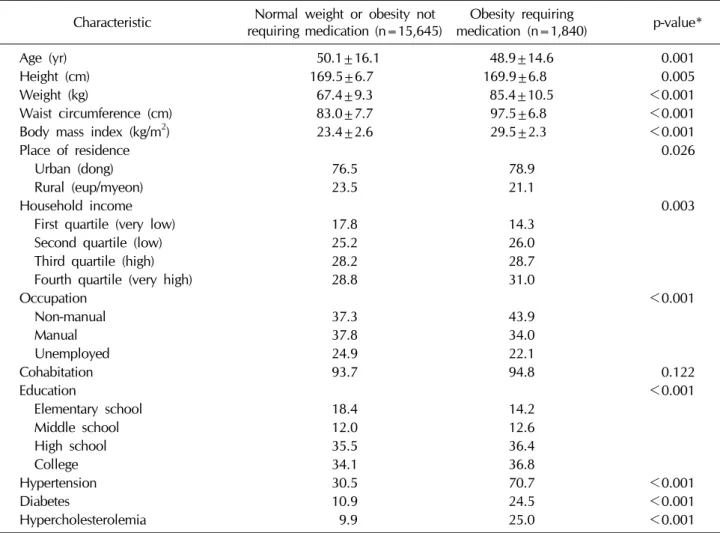
www.wjmh.org Table 1. Participant characteristics
Characteristic Normal weight or obesity not
requiring medication (n=15,645) Obesity requiring
medication (n=1,840) p-value*
Age (yr) 50.1±16.1 48.9±14.6 0.001
Height (cm) 169.5±6.7 169.9±6.8 0.005
Weight (kg) 67.4±9.3 85.4±10.5 <0.001
Waist circumference (cm) 83.0±7.7 97.5±6.8 <0.001
Body mass index (kg/m2) 23.4±2.6 29.5±2.3 <0.001
Place of residence 0.026
Urban (dong) 76.5 78.9
Rural (eup/myeon) 23.5 21.1
Household income 0.003
First quartile (very low) 17.8 14.3
Second quartile (low) 25.2 26.0
Third quartile (high) 28.2 28.7
Fourth quartile (very high) 28.8 31.0
Occupation <0.001
Non-manual 37.3 43.9
Manual 37.8 34.0
Unemployed 24.9 22.1
Cohabitation 93.7 94.8 0.122
Education <0.001
Elementary school 18.4 14.2
Middle school 12.0 12.6
High school 35.5 36.4
College 34.1 36.8
Hypertension 30.5 70.7 <0.001
Diabetes 10.9 24.5 <0.001
Hypercholesterolemia 9.9 25.0 <0.001
Values are presented as mean±standard deviation or percent only. *t-test or chi-square test.
4. Statistical analysis
Participant characteristics, including age, height, weight, waist circumference, BMI, place of residence, household income, occupation, cohabitation status, edu- cation, hypertension, diabetes, and hypercholesterolemia, were listed and compared between normal or obese par- ticipants who did not require medication versus obese re- spondents who required medication. These comparisons were made using the t-test, the chi-square test, and the lo- gistic regression test. We then calculated the prevalence of obesity according to age group, study year, and place of residence. Trends in the prevalence of obesity were ana- lyzed using the Mantel-Hazel extension test. Third, we in- vestigated the relationship between age and BMI using a scatter plot and trend curve. Additionally, awareness of
obesity and treatment strategies in men with obesity re- quiring medication were assessed using questions regard- ing self-image, weight change during the last year, efforts to reduce weight, and methods of weight reduction (exercise, fasting, skipping meals, medication, and diet).
All tests were two-sided, and the threshold for statistical significance was set at p<0.05. Analyses were conducted using the R Statistical Package v.2.13.1 (R Foundation for Statistical Computing, Vienna, Austria).
RESULTS
1. Participant characteristics
Table 1 presents the characteristics of the participants in this study. Participants with a normal weight or who were obese but did not require pharmacotherapy were sig-
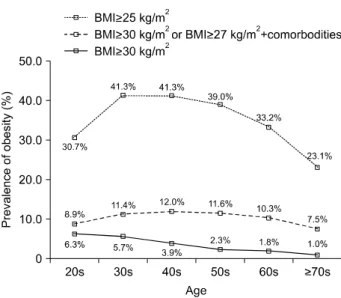
Fig. 1. The prevalence of obesity according to age group. BMI:
body mass index.
Fig. 2. Scatter plot and trend curve for the relationship between age and body mass index (BMI).
nificantly older than those with obesity requiring pharma- cotherapy. Obesity-related parameters, including weight, waist circumference, and BMI, had higher values in partic- ipants with obesity requiring pharmacotherapy. A higher household income, being a non-manual worker, and hav- ing a high level of education were significantly related to obesity requiring pharmacotherapy. Logistic regression analysis was performed using the confounding factors of age, height, cohabitation, occupation, household income, education, and place of residence, and significant rela- tionships with obesity requiring pharmacotherapy were found for the following parameters: age (adjusted odds ra- tio [OR]=0.994, 95% confidence interval [CI]=0.989∼
0.999; p=0.031); occupation (unemployed: adjusted OR=1.000; manual worker: adjusted OR=1.270, 95%
CI=1.056∼1.528, p=0.011; non-manual worker: ad- justed OR=0.924, 95% CI=0.781∼1.095, p=0.362), and educational level (elementary school: adjusted OR=
1.000; middle school: adjusted OR=0.978, 95% CI=
0.795∼1.203, p=0.834; high school: adjusted OR=1.235, 95% CI=1.015∼1.503, p=0.035; college: adjusted OR=1.117, 95% CI=0.971∼1.284, p=0.120). Additionally, diabetes, hypertension, and hypercholesterolemia were related to obesity requiring pharmacotherapy.
2. Prevalence of obesity
The prevalence rates of a BMI≥25 kg/m2, a BMI≥27.5
kg/m2, a BMI≥30 kg/m2, and obesity requiring pharmaco- therapy were 35.7% (n=6,425), 12.7% (n=2,222), 3.4%
(n=600), and 10.5% (n=1,840), respectively. Fig. 1 pres- ents the prevalence of obesity according to age group. The prevalence of a BMI≥25 kg/m2 and obesity requiring pharmacotherapy increased from the age of 20s to 50s and then decreased. Similarly, the scatter plot and trend curve (Fig. 2) show that BMI increased from age 20s to 50s and then decreased. The prevalence of a BMI≥30 kg/m2 was highest in respondents in their 20s and decreased with age (Fig. 2). BMI≥27.5 kg/m2 peaked among participants in their 30s and then decreased (20s, 14.3%; 30s, 17.1%;
40s, 14.7%; 50s, 12.3%; 60s, 10.0%; and 70s, 6.6%).
The prevalence of obesity defined using the criteria of a BMI≥25 kg/m2, a BMI≥30 kg/m2, and obesity requiring pharmacotherapy significantly increased over time (Fig.
3). Additionally, the prevalence of a BMI≥27.5 kg/m2 in- creased over time (2007, 11.6%; 2008, 11.5%; 2009, 12.0%; 2010, 12.2%; 2011, 12.2%; 2012, 13.1%; 2013, 15.0%; 2014, 14.4%; and p for trend <0.001).
Fig. 4 shows the geographic distribution of the number of obese participants who required pharmacotherapy.
This group was the most numerous in Gyeonggi-do (n=429), followed by Seoul (n=378), Incheon (n=112), Gyeongsangbuk-do (n=112), Busan (n=96), Gyeong- sangnam-do (n=92), Chungcheongnam-do (n=80), Daegu (n=77), Daejeon (n=73), Gangwon-do (n=68), Jeollabuk-do (n=65), Jeollanam-do (n=61), Chungcheongbuk-do (n=
58), Jeju (n=51), Gwangju (n=44), and Ulsan (n=44).
www.wjmh.org Fig. 5. Geographic distribution of the prevalence of obesity re- quiring pharmacotherapy. Values are presented as percent.
Fig. 3. Prevalence of obesity according to survey year. Mantel- Hazel extension test. Comorbidities included hypertension, dia- betes, and hypercholesterolemia. BMI: body mass index.
Fig. 4. Geographic distribution of the number of participants with obesity requiring pharmacotherapy.
The prevalence of obesity requiring pharmacotherapy (Fig. 5) was highest in Jeju (12.5%), followed by Daejeon (12.3%), Seoul (11.5%), Incheon (11.5%), Gyeonggi-do (11.3%), Gangwon-do (11.1%), Ulsan (10.8%), Chung- cheongnam-do (10.0%), Gyeongsangbuk-do (9.9%), Jeolla- buk-do (9.6%), Chungcheongbuk-do (9.2%), Busan (9.0%), Daegu (9.0%), Gyeongsangnam-do (8.9%), Chung- cheongnam-do (8.2%), and Gangwon-do (7.7%).
3. Participant awareness and management of obesity requiring pharmacotherapy
We found that 59.7% participants with obesity requir-
ing pharmacotherapy regarded themselves as slightly obese, while 32.0% thought that they were very obese (Table 2). A total of 59.3% of the participants reported that they had experienced no changes in weight during the last year. Among the participants with obesity requiring phar- macotherapy, 64.8% had tried to reduce their weight, and surprisingly, 34.5% had tried to maintain their weight or had never tried to manage their weight. Additionally, only 13.9% exercised for weight reduction, whereas 72.8% re- ported fasting for longer than 24 hours to reduce their weight. More than 70% of the participants with obesity re- quiring pharmacotherapy took pills for weight reduction, ate functional foods, or adhered to a one-food diet. Overall, participants with obesity requiring pharmacotherapy used diet pills, a one-food diet, and fasting for weight reduction, but did not exercise.
DISCUSSION
Some previous studies have examined the prevalence of obesity in South Korea. However, those studies have defined obesity as a BMI≥25 kg/m2, and adequate data are not available concerning the prevalence of BMI≥30 kg/m2 or obesity requiring pharmacotherapy. Our results are meaningful because we investigated the prevalence of severe obesity (BMI≥30 kg/m2 or obesity requiring phar- macotherapy) as well as general obesity (BMI≥25 kg/m2) in men. In this study, the prevalence rates of a BMI≥25 kg/m2, a BMI≥30 kg/m2, and obesity requiring pharmaco-
Table 2. Continued
Variable Obesity requiring medication
(n=1,840) Weight reduction method: functional food
Yes 1,332 (72.4)
No 43 (2.3)
Not applicable 459 (24.9)
Unaware 6 (0.3)
Weight reduction method: one-food diet
Yes 1,357 (73.8)
No 18 (1.0)
Not applicable 459 (24.9)
Unaware 6 (0.3)
Values are presented as number (%).
Table 2. Awareness and management of obesity among men with obesity requiring pharmacotherapy
Variable Obesity requiring medication
(n=1,840) Self-image
Very skinny 5 (0.3)
Slightly skinny 8 (0.4)
Normal 134 (7.3)
Slightly obese 1,099 (59.7)
Very obese 588 (32.0)
Unaware 6 (0.3)
Weight change during the last year
No change 1,092 (59.3)
Weight reduction 248 (13.5)
Weight gain 494 (26.8)
Unaware 6 (0.3)
Management of obesity
Tried to reduce weight 1,193 (64.8) Tried to maintain weight 182 (9.9) Tried to increase weight 6 (0.3) Never tried to manage weight 452 (24.6)
Unaware 7 (0.4)
Weight reduction method: exercise
Yes 256 (13.9)
No 1,119 (60.8)
Not applicable 459 (24.9)
Unaware 6 (0.3)
Weight reduction method: fasting for longer than 24 hours
Yes 1,339 (72.8)
No 36 (2.0)
Not applicable 459 (24.9)
Unaware 6 (0.3)
Weight reduction method: skipping meals
Yes 655 (35.6)
No 720 (39.1)
Not applicable 459 (24.9)
Unaware 6 (0.3)
Weight reduction method: diet pill (over-the-counter)
Yes 1,368 (74.3)
No 7 (0.4)
Not applicable 459 (24.9)
Unaware 6 (0.3)
Weight reduction method: diet pill (prescribed)
Yes 1,365 (74.2)
No 10 (0.5)
Not applicable 459 (24.9)
Unaware 6 (0.3)
Weight reduction method: diet pill (oriental medicine)
Yes 1,356 (73.7)
No 19 (1.0)
Not applicable 459 (24.9)
Unaware 6 (0.3)
therapy were 35.7%, 3.4%, and 10.5%, respectively.
National population data [7] from the United States re- vealed that 74.1% of adult men had a BMI≥25 kg/m2, while 35.5% were found to have a BMI≥30 kg/m2. Another study [8] from the United Kingdom reported that 24.4% of men had a BMI≥30 kg/m2. In Asia, a pop- ulation-based cross-sectional study [9] conducted in Tianjin, China, reported that the prevalence rates of over- weight (BMI 24.0∼27.9 kg/m2) and obesity (BMI≥28.0 kg/m2) were 38.0% and 11.3% in men, respectively. A re- cent study [2] conducted in Korea using the KNHANES from 1998 to 2009 reported that the prevalence of obesity (BMI≥25 kg/m2) was 25.1% to 35.7% across the study years. The prevalence of obesity in Korean is considerably lower than that in the United States and the United Kingdom, but comparable to that of China. Cultural, nutri- tional, and racial differences appear to contribute to the differences in the prevalence of male obesity in these countries.
However, male obesity increased over time in this study. Few studies have been conducted on the preva- lence of obesity in Korea, and the results of those studies have been inconsistent. A cross-sectional study [10] using the KNHANES from 1998 to 2011 reported that the preva- lence of obesity (BMI≥25 kg/m2) stopped increasing in 2005. Another study [2] that used the KNHANES from 1998 to 2009 reported that the prevalence of obesity (BMI≥25 kg/m2) increased from 25.1% to 35.7% in Korean males, but did not increase in Korean females, during the study
www.wjmh.org
period. These previous two studies did not include recent data from the 2012 to 2014 KNHANES, and one of the studies [10] did not consider sex differences when evaluat- ing the prevalence of obesity. These two issues have con- tributed to the inconsistency of results across studies.
According to our findings, both severe male obesity (BMI
≥30 kg/m2 or obesity requiring pharmacotherapy) and overall obesity (BMI≥25 kg/m2) increased over time.
Therefore, we think that an effective health policy regard- ing male obesity in Korea is needed.
Previous data have shown that the prevalence of obesity first increases and then decreases with age [11]. In that study, the prevalence of a BMI≥25 kg/m2 and obesity re- quiring pharmacotherapy increased with age until 50 and then decreased thereafter. Men in their 40s had the highest prevalence of general obesity (BMI≥25 kg/m2) and obe- sity requiring pharmacotherapy. We confirmed those results. Interestingly, in our study, the prevalence of all types of obesity (BMI≥25 kg/m2, obesity requiring phar- macotherapy, and BMI≥30 kg/m2) in people older than 70 years was lower than in people 20 to 69 years of age, similarly to previous results [11]. Moreover, severe obesity (BMI≥30 kg/m2) decreased with age in this study, imply- ing that older people typically exhibit only mild obesity, which may be partly due to the effects of obesity-related mortality [11,12]. It is well known that obesity is asso- ciated with significantly higher all-cause mortality in com- parison to normal weight [11,12]. Therefore, health policy for obesity in men should be primarily focused on the younger age group to prevent obesity-related morality.
Socioeconomic factors have also been found to be re- lated to obesity in previous studies. High income has been associated with higher BMI in men in developing nations [13]. A study recently conducted in China showed that age-standardized overweight/obesity prevalence in men was related to a high education level and being a non- manual worker [14]. In the present study, obesity requir- ing pharmacotherapy was related to high income, being a non-manual worker, and having a high level of education, similarly to the results of previous studies. Additionally, the prevalence of male obesity differed according to area of residence, as exemplified by a comparison between Jeju (12.5%) and Gangwon-do (7.7%). We confirmed that socioeconomic factors influenced obesity, and we found
regional differences in male obesity prevalence. The re- sults of our study may be helpful in identifying obesity re- quiring medication as a priority when establishing health policy for male obesity in Korea.
Recent guidelines [6] for obesity management have rec- ommended that diet, exercise, and behavioral mod- ifications be included in all obesity-management ap- proaches for people with BMI≥25 kg/m2, and that other tools, such as pharmacotherapy (in patients with a BMI≥
27 kg/m2 with a comorbidity or BMI≥30 kg/m2) and bari- atric surgery (in patients with a BMI≥35 kg/m2 with a co- morbidity or a BMI≥40 kg/m2), be used as adjuncts to be- havioral modification. In order to promote long-term weight maintenance, the guidelines [6] also suggest the use of approved weight-loss medication to ameliorate co- morbidities and amplify adherence to behavior changes, as such medications may improve physical functioning and allow for greater physical activity in patients with obe- sity requiring pharmacotherapy. However, in this study, only 13.9% of participants with obesity requiring medi- cation exercised for weight reduction. This is the most likely explanation for the fact that 59.3% of our population reported no changes in weight during the last year, al- though more than 70% of participants with obesity requir- ing pharmacotherapy used diet pills, ate functional foods, or consumed a one-food diet for weight reduction. A bet- ter-organized strategy emphasizing physical activity is therefore required for obese Korean men.
One limitation of the present study warrants mention.
Namely, the cross-sectional nature of the dataset limits the ability to form causal inferences. Nevertheless, our study is meaningful since it was a systemic study of a large repre- sentative Korean population.
CONCLUSIONS
Male obesity increased over time in this study. Having a high income, being a non-manual worker, and having a high level of education were all found to be significantly related to obesity requiring pharmacotherapy. Participants with obesity requiring pharmacotherapy were found to depend on medication and diet for weight reduction, but for the most part they did not exercise. A better-organized strategy is required to reduce obesity in Korean men.
CONFLICT OF INTEREST
No potential conflict of interest relevant to this article was reported.
REFERENCES
1. Kopelman PG. Obesity as a medical problem. Nature 2000;
404:635-43.
2. Rhee SY, Park SW, Kim DJ, Woo J. Gender disparity in the secular trends for obesity prevalence in Korea: analyses based on the KNHANES 1998-2009. Korean J Intern Med 2013;
28:29-34.
3. Park HJ, Moon KH, Lee SW, Lee WK, Kam SC, Lee JH, et al.
Mirodenafil for the treatment of erectile dysfunction: a sys- tematic review of the literature. World J Mens Health 2014;
32:18-27.
4. Park YW, Kim SB, Kwon H, Kang HC, Cho K, Lee KI, et al.
The relationship between lower urinary tract symptoms/be- nign prostatic hyperplasia and the number of components of metabolic syndrome. Urology 2013;82:674-9.
5. Oh SW, Shin SA, Yun YH, Yoo T, Huh BY. Cut-off point of BMI and obesity-related comorbidities and mortality in mid- dle-aged Koreans. Obes Res 2004;12:2031-40.
6. Apovian CM, Aronne LJ, Bessesen DH, McDonnell ME, Murad MH, Pagotto U, et al. Pharmacological management of obesity: an Endocrine Society clinical practice guideline.
J Clin Endocrinol Metab 2015;100:342-62.
7. Flegal KM, Carroll MD, Kit BK, Ogden CL. Prevalence of obesity and trends in the distribution of body mass index among US adults, 1999-2010. JAMA 2012;307:491-7.
8. Zaninotto P, Head J, Stamatakis E, Wardle H, Mindell J.
Trends in obesity among adults in England from 1993 to 2004 by age and social class and projections of prevalence to 2012. J Epidemiol Community Health 2009;63:140-6.
9. Xu W, Zhang H, Paillard-Borg S, Zhu H, Qi X, Rizzuto D.
Prevalence of overweight and obesity among Chinese adults:
role of adiposity indicators and age. Obes Facts 2016;9:17-28.
10. Kim CS, Ko SH, Kwon HS, Kim NH, Kim JH, Lim S, et al.
Prevalence, awareness, and management of obesity in Korea:
data from the Korea National Health and Nutrition Examina- tion Survey (1998-2011). Diabetes Metab J 2014;38:35-43.
11. Wang K, Wang D, Pan L, Yu Y, Dong F, Li L, et al. Preva- lence of obesity and related factors among Bouyei and Han peoples in Guizhou province, southwest China. PLoS One 2015;10:e0129230.
12. Clinical guidelines on the identification, evaluation, and treatment of overweight and obesity in adults: the evidence report. National Institutes of Health. Obes Res 1998;6 Suppl 2:51S-209S.
13. Lawson RA, Murphy RH, Williamson CR. The relationship between income, economic freedom, and BMI. Public Health 2016;134:18-25.
14. Lao XQ, Ma W, Chung RY, Zhang Y, Xu Y, Xu X, et al. The diminishing socioeconomic disparity in obesity in a Chinese population with rapid economic development: analysis of serial cross-sectional health survey data 2002-2010. BMC Public Health 2015;15:1282.