Body Fat Percentile Curves for Korean Children and Adolescents:
A Data from the Korea National Health and Nutrition Examination Survey 2009-2010
A valid assessment of obesity in children and adolescents is important due to significant change in body composition during growth. This study aimed to develop percentile curves of body fat and fat free mass using the Lambda, Mu, and Sigma method, and to examine the relationship among body mass index (BMI), fat mass and fat free mass in Korean children and adolescents, using the Korea National Health and Nutrition Examination Survey (KNHANES) 2009-2010. The study subjects were 834 for boys and 745 for girls aged between 10 and 18 yr. Fat mass and fat free mass were measured by dual-energy x-ray absorptiometry. The patterns of development in body fat percentage, fat mass and fat free mass differed for boys and girls, showing a decreased fat mass with an increased fat free mass in boys but gradual increases with age in girls. The considerable proportion of boys and girls with relatively normal fat mass appeared to be misclassified to be at risk of overweight based on the BMI criteria. Therefore, the information on the percentiles of body fat and fat free mass with their patterns would be helpful to complement assessment of overweight and obesity based on BMI for Korean children and adolescents.
Key Words: Body Mass Index; Fat Mass; Fat Free Mass; Children and Adolescents;
KNHANES; DXA; Overweight Kirang Kim,1 Sung Ha Yun,2
Myoung Jin Jang,2 and Kyung Won Oh2
1Department of Food Science and Nutrition, Dankook University, Yongin; 2Division of Health and Nutrition Survey, Korea Centers for Disease Control and Prevention, Cheongwon, Korea
Received: 2 July 2012 Accepted: 20 December 2012 Address for Correspondence:
Kyung Won Oh, PhD
Division of Health and Nutrition Survey, Korea Centers for Disease Control and Prevention, 187 Osongsaengmyeong-2-ro, Osong-eup, Cheongwon 363-951, Korea
Tel: +82.43-719-0667, Fax: +82.43-719-7527 E-mail: [email protected]
http://dx.doi.org/10.3346/jkms.2013.28.3.443 • J Korean Med Sci 2013; 28: 443-449
INTRODUCTION
Given that the prevalence of childhood obesity is rapidly increas- ing worldwide including Korea (1, 2), assessment of obesity in children and adolescents is important. One of the relevant com- ponents to consider in the screening and assessment of their obesity is body composition. Especially, body fat mass and dis- tribution have been known to be important determinants in obe- sity related negative health outcomes (3, 4). In addition, child- hood obesity is characterized by excessive accumulation of body fat and adipose tissue development (5).
Among many direct and indirect methods to assess body fat, body mass index (BMI) is used as the most popular index for evaluation of obesity because of its simplicity and low cost. Sev- eral sets of reference values for BMI in children and adolescents have been published (6, 7). However, many studies addressed its limitation for representing the body fat and a considerable level of misclassification (8-13). They found that the accuracy of BMI was dependent on degree of fatness in growing children (9-13). Thus, recently several countries have measured body fat by whole-body, dual-energy x-ray absorptiometry (DXA), bio- electrical impedance analysis or skinfold measurement in chil-
dren and adolescents and tried to provide its age- and gender- specific percentile values for references (13-18). The findings could be important for early intervention and treatment of child- hood obesity in the light of the significant change in body com- position during growth and development. Therefore, the objec- tive of this study is to develop percentile curves of body fat mass and fat free mass, and to examine the relationship among BMI, fat mass and fat free mass in Korean children and adolescents, using data of the Korea National Health and Nutrition Exami- nation Survey (KNHANES) 2009-2010.
MATERIALS AND METHODS Subjects
The subjects were participants in the 2009-2010 KNHANES which was a nationwide cross-sectional survey to assess the health and nutritional status of adults and children living in Korea and ad- ministered by the Ministry of Health and Welfare and the Korea Centers for Disease Control and Prevention (KCDC).The data was collected with a year-round, using a stratified multi-stage clustered probability sampling to select a representative sample of the non-institutionalized civilian Korean population. The num-
ber of study subjects was 1,579 who aged between 10 and 18 yr old (834 for boys and 745 girls).
Body composition
The BMI was then calculated as weight divided by height squared (kg/m2). Height was measured using a stadiometer (SECA, Hamburg, Germany) and weight using a balance beam scale (G-TECH, Uijeongbu, Korea) with participants wearing a stan- dardized gown. Percentage body fat was measured by whole- body DXA scans, using a QDR Discovery (formerly, the QDR 4500A) fan beam densitometer (Hologic, Inc., Bedford, MA, USA). The examination was performed in accordance with man- ufacturer’s acquisition procedures. The results of DXA were an- alyzed using industry standard techniques at the Korean Soci- ety of Osteoporosis; and the Hologic Discovery software (ver- sion 13.1) was used to analyze the scans. The DXA measure- ments included bone mineral content, bone mineral density, fat mass, lean mass including bone mineral content, and body fat percentage (%BF, fat mass/total mass × 100). From these data, fat mass index (FMI, fat mass excluding the head area/height[m]2) and fat free mass index (FFMI, lean mass/height[m]2) were cal- culated.
Statistical methods
The analysis was separately performed by gender. The differ- ences of mean values for anthropometric and body composi- tion measurements for each age between sex were tested by t- test. The %BF, FMI, and FFMI percentile curves were calculated by using Cole’s Lamba, Mu, and Sigma (LMS) method LMSChart-
Maker Pro Version 2.54, Medical Research Council, London, UK) (19). The LMS method assumes that the data can be nor- malized by using power transformation. The percentile curves are the results of smoothing the age specific curves: L for skew- ness, M for median and S for coefficient of variation (20, 21).
The LMS model fitting was performed using sample weights.
The final percentile curves were chosen by selecting more par- simonious models over more complex models based on devi- ance measurements among the models satisfying the goodness of fit based on Q tests. The Q statistic is considered adequate if the Q statistics curves for L, M, and S are within the range -2 and +2. All analyses were done using SAS version 9.2 (SAS Institute, Cary, NC, USA).
The percentile curves of %BF, fat mass and fat free mass were also plotted according to BMI level using the LMS. The BMI level was categorized into two groups; normal (< 85th percentile for age and sex) and at risk of overweight (≥ 85th percentile for age and sex) based on the Standard Growth Charts of Korean chil- dren and adolescents in 2007 published by the KCDC and Ko- rean Pediatric Society (22). To examine the distribution of fat mass and fat free mass according to BMI group for age and sex, fat mass and fat free mass were classified into two groups based on the criteria of 75th percentile (the highest quartile)of each index.
Ethics statement
The study protocol was reviewed and approved by the KCDC’s institutional review board (2009-01CON-03-2C, 2010-02CON- 21-C), and written consent was obtained from the subjects. Fur- Table 1. Anthropometric and body composition characteristics by sex and age
Age (yr) No.
Anthropometric and body composition measurements Height
(cm) Weight
(kg) BMI
(kg/cm2) %BF Fat mass
(kg) Fat free mass
(kg) FMI
(kg/m2) FFMI (kg/m2) Boys
10 11 12 13 14 15 16 17 18
96 108 106 90 118 84 76 88 68
143.0 ± 0.7 149.4 ± 0.8 157.0 ± 0.8 162.1 ± 1.0† 169.7 ± 0.8‡ 171.5 ± 0.9‡ 173.6 ± 0.7‡ 173.7 ± 0.8‡ 172.6 ± 1.0‡
40.0 ± 1.2 45.8 ± 1.3 50.2 ± 1.4 54.4 ± 1.4*
62.1 ± 1.5‡ 61.2 ± 1.7† 64.0 ± 1.5‡ 65.8 ± 1.4‡ 65.4 ± 1.2‡
19.4 ± 0.5† 20.4 ± 0.5† 20.2 ± 0.5 20.6 ± 0.4 21.5 ± 0.4 20.7 ± 0.5 21.2 ± 0.4 21.7 ± 0.4 22.0 ± 0.5
29.3 ± 1.0 29.6 ± 1.0 26.2 ± 1.3*
24.2 ± 0.9‡ 22.1 ± 0.8‡ 19.9 ± 0.9‡ 19.7 ± 1.0‡ 21.0 ± 0.8‡ 21.0 ± 0.8‡
12.2 ± 0.8 14.1 ± 0.9 13.7 ± 1.0 13.6 ± 0.8*
14.3 ± 0.9† 12.7 ± 0.9‡ 13.1 ± 0.9‡ 14.2 ± 0.7† 13.9 ± 0.7‡
27.5 ± 0.5*
31.4 ± 0.6† 36.0 ± 0.7† 40.3 ± 0.8‡ 47.1 ± 0.8‡ 47.8 ± 0.9‡ 50.3 ± 0.9‡ 51.0 ± 1.0‡ 50.9 ± 0.7‡
5.9 ± 0.3 6.3 ± 0.4 5.5 ± 0.4 5.1 ± 0.3† 4.9 ± 0.3‡ 4.3 ± 0.3‡ 4.3 ± 0.3‡ 4.7 ± 0.2‡ 4.7 ± 0.3‡
13.4 ± 0.2‡ 14.0 ± 0.2‡ 14.5 ± 0.2‡ 15.2 ± 0.2‡ 16.3 ± 0.2‡ 16.2 ± 0.2‡ 16.6 ± 0.3‡ 16.8 ± 0.3‡ 17.1 ± 0.3‡ Girls
10 11 12 13 14 15 16 17 18
87 95 80 99 89 77 81 79 58
144.8 ± 0.8 150.4 ± 0.8 155.5 ± 0.8 158.2 ± 0.8 159.9 ± 0.5 161.0 ± 0.6 159.2 ± 0.6 161.6 ± 0.8 162.0 ± 0.9
37.8 ± 0.8 42.4 ± 1.1 47.7 ± 1.4 50.5 ± 1.0 52.8 ± 1.1 53.8 ± 1.5 54.1 ± 1.3 56.4 ± 2.1 55.4 ± 1.4
17.9 ± 0.3 18.6 ± 0.3 19.6 ± 0.5 20.1 ± 0.3 20.6 ± 0.4 20.7 ± 0.5 21.3 ± 0.4 21.6 ± 0.7 21.1 ± 0.5
30.7 ± 0.7 30.1 ± 0.6 29.3 ± 0.7 30.7 ± 0.9 33.0 ± 0.7 32.8 ± 0.8 33.2 ± 0.7 34.1 ± 0.9 33.5 ± 0.9
11.6 ± 0.5 12.9 ± 0.5 14.3 ± 0.7 15.6 ± 0.6 17.6 ± 0.7 17.9 ± 1.0 18.2 ± 0.8 19.5 ± 1.3 18.9 ± 0.9
25.7 ± 0.5 29.1 ± 0.6 32.9 ± 0.7 34.4 ± 0.6 34.6 ± 0.5 35.5 ± 0.6 35.5 ± 0.5 36.5 ± 0.9 36.4 ± 0.7
5.5 ± 0.2 5.7 ± 0.2 5.8 ± 0.3 6.2 ± 0.3 6.9 ± 0.3 6.9 ± 0.4 7.1 ± 0.3 7.5 ± 0.5 7.2 ± 0.4
12.2 ± 0.1 12.8 ± 0.2 13.5 ± 0.2 13.7 ± 0.2 13.5 ± 0.2 13.7 ± 0.2 14.0 ± 0.2 14.0 ± 0.3 13.8 ± 0.2 Mean ± standard error. BMI, Body mass index = weight (kg)/height (m)2; %BF, body fat percentage = fat mass/total mass × 100; FMI, fat mass index = fat mass (kg)/height (m)2; FFMI, fat free mass index = fat free mass (kg)/height (m)2. *P < 0.05, †P < 0.01, ‡P < 0.001 for the significant difference between sex for each age.
ther ethical approval for use of open KNHANES data was ex- empted from institutional review board.
RESULTS
Table 1 shows mean values of height, weight, BMI, %BF, fat mass, fat free mass, FMI, FFMI in each age and sex. Generally, height, weight and fat free mass were higher in boys but %BF and fat mass were lower than girls. Especially, fat mass appeared to be higher in boys than girls until 11 yr old, but since then, girls have had a significant higher fat mass than boys.
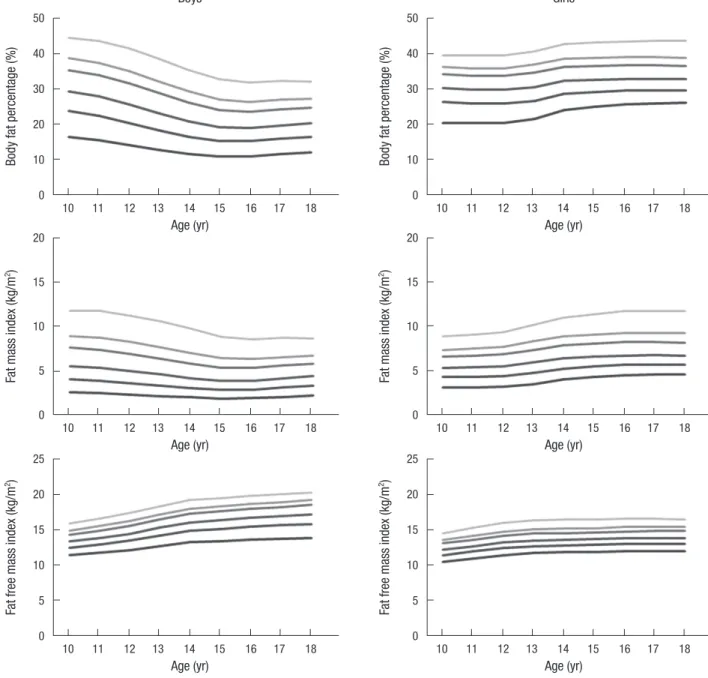
Smoothed LMS curves for the 15th, 25th, 50th, 75th, 85th, and 95th percentiles of %BF, FMI, and FFMI for boys and girls are
presented in Fig. 1. For boys, %BF and FMI were the highest at age 10 yr and decreased until age 15 and then showed relatively flat pattern, whereas FFMI was the lowest at age 10 yr and grad- ually increased through adolescence. Girls had a relatively flat
%BF and FMI at approximately age 13 yr and then increased between 13 and 14 yr old and then relatively stable and their FFMI also slightly increased at approximately age 16 yr and then were stable.
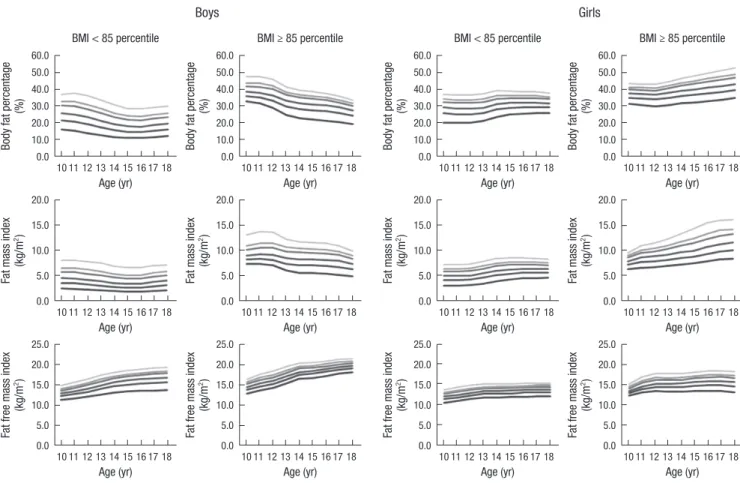
Fig. 2 shows the smoothed LMS curves of %BF, FMI, and FFMI according to BMI level. Generally, the patterns of curves for %BF, FMI and FFMI were similar between BMI groups in both boys and girls. Boys had relatively greater difference in each percen- tile value between BMI groups for %BF and FMI than girls dur-
Body fat percentage (%) Body fat percentage (%)
Age (yr) Age (yr)
10 11 12 13 14 15 16 17 18 10 11 12 13 14 15 16 17 18
50 40 30 20 10 0
50 40 30 20 10 0
Fat mass index (kg/m2) Fat mass index (kg/m2)
Age (yr) Age (yr)
10 11 12 13 14 15 16 17 18 10 11 12 13 14 15 16 17 18
20 15 10 5 0
20 15 10 5 0
Fat free mass index (kg/m2) Fat free mass index (kg/m2)
Age (yr) Boys
Age (yr) Girls
10 11 12 13 14 15 16 17 18 10 11 12 13 14 15 16 17 18
25 20 15 10 5 0
25 20 15 10 5 0
Fig. 1. Percentile curves of the 5th, 25th, 50th, 75th, 85th, and 95th for body fat percentage (%BF), fat mass index (FMI) and fat free mass index (FFMI) by sex and age. FMI, fat mass (kg)/height (m)2; FFMI, fat free mass (kg)/height (m)2.
ing early adolescence (until around 13 or 14 yr old) but in the period of late adolescence, girls had greater difference than boys.
For example, for FMI at 10 yr old, boys had the range of 2.4 (5th percentile) to 8.0 (95th percentile) in normal group versus 7.3 to 13.0 in group at risk of overweight based on BMI criteria but girls had 3.0 to 7.1 vs 6.4 to 9.6, respectively. However, FMI of boys at 18 yr old had 2.1 to 7.1 in normal group versus 4.7 to 9.8 in group at risk of overweight but girls had 4.6 to 8.2 vs 8.4 to
16.1, respectively. The percentile values of FFMI were slightly higher in overweight group than in normal group over the en- tire age range in both boys and girls.
The distribution of FMI and FFMI according to BMI level by sex and age group is shown in Table 2. Boys and girls who were classified as normal by the BMI criteria were mostly included in the group below the 75th percentile of both FMI and FFMI (97%- 100%). However, about 20% (boys aged 10-12 yr)-33% (girls Fig. 2. Percentile curves of the 5th, 25th, 50th, 75th, 85th and 95th for body fat percentage (%BF), fat mass index (FMI) and fat free mass index (FFMI) according to body mass index (BMI) level by sex and age. FMI, fat mass (kg)/height (m)2; FFMI, fat free mass (kg)/height (m)2.
Body fat percentage (%)
Age (yr) BMI < 85 percentile
10 11 12 13 14 15 16 17 18 60.0
50.0 40.0 30.0 20.0 10.0
0.0 Body fat percentage (%)
Age (yr) BMI < 85 percentile
10 11 12 13 14 15 16 17 18 60.0
50.0 40.0 30.0 20.0 10.0 Body fat percentage (%) 0.0
Age (yr) BMI ≥ 85 percentile
10 11 12 13 14 15 16 17 18 60.0
50.0 40.0 30.0 20.0 10.0
0.0 Body fat percentage (%)
Age (yr) BMI ≥ 85 percentile
10 11 12 13 14 15 16 17 18 60.0
50.0 40.0 30.0 20.0 10.0 0.0
Fat mass index (kg/m2)
Age (yr) 10 11 12 13 14 15 16 17 18 20.0
15.0
10.0 5.0 0.0
Fat mass index (kg/m2)
Age (yr) 10 11 12 13 14 15 16 17 18 20.0
15.0
10.0 5.0 0.0 Fat mass index (kg/m2)
Age (yr) 10 11 12 13 14 15 16 17 18 20.0
15.0
10.0 5.0 0.0
Fat mass index (kg/m2)
Age (yr) 10 11 12 13 14 15 16 17 18 20.0
15.0
10.0 5.0 0.0
Fat free mass index (kg/m2)
Age (yr) 10 11 12 13 14 15 16 17 18 25.0
20.0 15.0 10.0 5.0
0.0 Fat free mass index 2(kg/m)
Age (yr) 10 11 12 13 14 15 16 17 18 25.0
20.0 15.0 10.0 5.0 Fat free mass index 2(kg/m) 0.0
Age (yr) 10 11 12 13 14 15 16 17 18 25.0
20.0 15.0 10.0 5.0
0.0 Fat free mass index 2(kg/m)
Age (yr) 10 11 12 13 14 15 16 17 18 25.0
20.0 15.0 10.0 5.0 0.0
Boys Girls
Table 2. Distribution of FMI and FFMI level according to BMI level by sex and age
Criteria
BMI < 85 percentile BMI ≥ 85percentile
< 75th percentile of FMI and FFMI
< 75th percentile of
FMI and
≥ 75 percentile of FFMI
≥ 75th percentile of
FMI and
< 75 percentile of FFMI
≥ 75th percentile of FMI and FFMI
< 75th percentile of FMI and FFMI
< 75th percentile of
FMI and
≥ 75 percentile of FFMI
≥ 75th percentile of
FMI and
< 75 percentile of FFMI
≥ 75th percentile of FMI and FFMI
Boys 10-12 13-15 16-18
97.3 ± 1.1 98.2 ± 0.9 97.6 ± 1.1
2.4 ± 1.1 0.9 ± 0.7 1.2 ± 0.7
0.0 0.5 ± 0.4 1.1 ± 0.8
0.2 ± 0.2 0.3 ± 0.3
0.0
60.4 ± 7.3 55.8 ± 8.0 55.5 ± 9.4
18.7 ± 5.2 22.5 ± 7.0 17.9 ± 6.2
9.0 ± 3.3 13.6 ± 5.6 19.6 ± 7.3
11.9 ± 5.4 8.2 ± 3.8 7.0 ± 3.7 Girls
10-12 13-15 16-18
99.1 ± 0.9 100.0 99.6 ± 0.5
0.0 0.0 0.0
0.4 ± 0.4 0.0 0.0
0.4 ± 0.4 0.0 0.4 ± 0.5
56.4 ± 7.7 62.2 ± 7.6 57.1 ± 9.3
15.7 ± 6.0 13.4 ± 5.2 9.5 ± 4.9
15.9 ± 5.3 11.2 ± 5.0 16.0 ± 6.5
12.1 ± 5.1 13.3 ± 6.3 17.4 ± 5.7 All values are percentage ± standard error. BMI, Body mass index = weight (kg)/height (m)2; FMI, fat mass index = fat mass (kg)/height (m)2; FFMI, fat free mass index = fat free mass (kg)/height (m)2.
aged 16-18 yr) of those at risk of overweight was classified as having FMI above the 75th percentile regardless of FFMI.
Among boys and girls who were at risk of overweight, the per- centage of those below the 75th percentile of FMI and above the 75th percentile of FFMI ranged from 9.5% (girls aged 16-18 yr) to 22.5% (boys aged 13-15 yr).
DISCUSSION
Given lack of information in the smoothed reference data for body fat composition indices for Korean children and adoles- cents, this study presented age and gender-specific percentile curves of body composition including %BF, FMI and FFMI, us- ing nationally representative data. The pattern of %BF and fat mass development differed for boys and girls between 10 and 18 yr old. Among boys, there was a decrease in %BF and FMI during early adolescence but girls had an increase in the period of late adolescence. The pattern was more pronounced in the group at risk of overweight than normal group. Especially, the percentile distribution of FMI became more dispersed with age in girls at risk of overweight than other groups. Regarding fat free mass, boys and girls had consistent pattern, showing a gradual- ly increased pattern with age.
The finding of different pattern for body fat mass between sex during childhood and adolescence was similar to those of other countries. Most of studies showed that boys had an increased fat mass until around 10-12 yr old and then a decreased pattern but girls showed a gradually increase in fat mass with age (14- 17). In this study, because data were not available before 10 yr old, we could not examine the pattern during the period but the previous study for Korean children and adolescents observed that the pattern during the period was found to be similar to those of other countries (23). As the mean values of %BF in this study were compared with those of other studies measured by DXA, the mean value of %BF was similar to nationally repre- sentative US children showing 28.2% and 22.6% at age 10 yr and 18 yr for boys and 32.7% and 35.5% for girls, respectively. For the comparison with those of Chinese children and adolescents, the values of %BF in normal boys and girls in this study were slightly higher than those of normal Chinese boys and girls but other FMI and FFMI values by BMI level were similar to those of Chinese boys and girls in both normal and obese group (15).
In normal growth and development in children, boys gain more muscle and lean tissue than fat at puberty while girls gain more fat (24). The changes that occur at puberty were reflected in the curves of percentile for %BF, FMI, and FFMI in this study.
These findings could suggest that the increases in BMI are attrib- utable predominantly to increase in fat free mass of BMI (FFMI) in growing children, particularly in adolescent boys. Indeed, Maynard et al. (25) observed that the increase of fat free mass contributed to increases in BMI until late adolescence and the
contribution of fat mass increase to BMI increase was higher in girl than in boys. Other studies have also examined that age-re- lated increase in BMI during childhood was attributed to in- creasing fat free mass rather than fat mass (10, 12, 24). Thus, BMI which is often used to determine overweight and obesity of children and adolescents could not take into account the ac- tual composition of body fat, leading to have a limitation in dis- tinguishing between fat and lean mass. Since the pathology as- sociated with obesity is driven by excessive fat mass, an index to directly assess adiposity is important in screening of overweight and obesity. Several studies reported that Asians have a lower BMI but a higher %BF compared to age-matched Caucasians (25-27), suggesting inappropriate use of universal BMI cut-off points as a proxy of adiposity related obesity assessment. In ad- dition, a study assessing the ability of weight-and-height-based anthropometric indices like BMI for obesity screening among Asian adolescents showed that the indices had a low sensitivity to detect the obese adolescents (28).
These findings were also observed in this study. Because of no standard criteria for fat mass classifying overweight and obe- sity for children and adolescents, we defined the group with the highest quartile level (≥ 75th percentile) of FMI and FFMI as a relatively higher fat mass and fat free mass group. The magni- tude of agreement between group at risk of overweight based on BMI and a relatively higher fat mass group (≥ 75th percentile of both FMI and FFMI or ≥ 75th percentile of FMI and < 75 per- centile of FFMI) was low. The considerable proportion of boys and girls at risk of overweight was classified into the relatively normal fat mass group. Even among those at risk of overweight, the percentage of subject whose fat mass was relatively normal but fat free mass was relatively high was considerable, especial- ly in boys. Given that several studies addressed to consider the fat mass reference in evaluations of BMI-based classification to assess overweight and obesity for children and adolescents be- cause of the limitation of BMI (13-18), the information on the percentile values of body fat and their pattern during growth in this study would be helpful to complement assessment of over- weight and obesity based on BMI.
This study has some limitations to interpret the results. First- ly, although the data was representative sample of Korean chil- dren and adolescents, the sample size was not enough to pro- vide the reference value of %BF, FMI, and FFMI for each age.
Thus, further large-scale studies are needed to establish appro- priate reference values for age- and sex-specific %BF, fat mass and fat free mass percentiles and to verify their magnitude and pattern by BMI status. Secondly, because there is no standard fat mass cut-off value to assess overweight and obesity for chil- dren and adolescents, we choose the arbitrary cut-off value of the highest quartile level (≥ 75th percentile) to decide the high- er fat mass and fat free mass group, and the cut-off value based on the quartile level has been used in other Asian children and
adolescents studies (15, 29). Lastly, this study could not take into account the contribution of puberty on the change of fat mass and fat free mass because there was no specific staging infor- mation with respect to puberty.
Despite these limitations, the study has several strengths. For growing children and adolescents, the levels of both fat mass and fat free mass are influenced by body size such as stature (30). Thus, several studies have suggested FMI and FFMI nor- malized for stature, dividing by square of height as BMI is nor- malized for stature in order to increase comparability among fat mass, fat free mass and BMI (15, 31-34). This study exam- ined the indices to consider the problems. Another strength is that DXA is known to more accurately quantify the body fat de- pot than other anthropometric measurements such as bioelec- trical impedance analysis or skinfold measurement (35). This study provided more valid measurements of %BF, fat mass and fat free mass by DXA.
In conclusion, the study developed the smoothed percentile curves of %BF, fat mass and fat free mass for Korean children and adolescents. The results from percentile curves showed that the pattern of %BF, fat mass and fat free mass development dif- fered for boys and girls between 10 and 18 yr old. In addition, when only BMI is used for screening overweight and obesity for children and adolescents, those with normal fat mass and high fat free mass appeared to be misclassified to overweight or obe- sity. Thus, in order to further control the weight of obese children, not only BMI change but also FFMI and FMI change should be used as monitoring indices. Further studies are needed to focus on developing gender and age specific cut-off values of these indices that are valid for the health risk-based definitions of pe- diatric obesity.
ACKNOWLEDGMENTS
The authors declare no conflicts of interest to disclose.
REFERENCES
1. Lobstein T, Baur L, Uauy R; IASO International Obesity Task Force. Obe- sity in children and young people: a crisis in public health. Obes Rev 2004;
5: 4-104.
2. Oh K, Jang MJ, Lee NY, Moon JS, Lee CG, Yoo MH, Kim YT. Prevalence and trends in obesity among Korean children and adolescents in 1997 and 2005. Korean J Pediatr 2008; 51: 950-5.
3. Aronne LJ, Segal KR. Adiposity and fat distribution outcome measures:
assessment and clinical implications. Obes Res 2002; 10: 14S-21S.
4. Lee J, Chung DS, Kang JH, Yu BY. Comparison of visceral fat and liver fat as risk factors of metabolic syndrome. J Korean Med Sci 2012; 27: 184-9.
5. Lafortuna CL, Maffiuletti NA, Agosti F, Sartorio A. Gender variations of body composition, muscle strength and power output in morbid obesity.
Int J Obes (Lond) 2005; 29: 833-41.
6. Cole TJ, Bellizzi MC, Flegal KM, Dietz WH. Establishing a standard defi-
nition for child overweight and obesity worldwide: international survey.
BMJ 2000; 320: 1240-3.
7. Ogden CL, Kuczmarski RJ, Flegal KM, Mei Z, Guo S, Wei R, Grummer- Strawn LM, Curtin LR, Roche AF, Johnson CL. Centers for Disease Con- trol and Prevention 2000 growth charts for the United States: improve- ments to the 1977 National Center for Health Statistics version. Pediat- rics 2002; 109: 45-60.
8. Sweeting HN. Measurement and definitions of obesity in childhood and adolescence: a field guide for the uninitiated. Nutr J 2007; 6: 32.
9. Brann LS. Classifying preadolescent boys based on their weight status and percent body fat produces different groups. J Am Diet Assoc 2008;
108: 1018-22.
10. Freedman DS, Wang J, Maynard LM, Thornton JC, Mei Z, Pierson RN, Dietz WH, Horlick M. Relation of BMI to fat and fat-free mass among children and adolescents. Int J Obes (Lond) 2005; 29: 1-8.
11. Freedman DS, Wang J, Thornton JC, Mei Z, Sopher AB, Pierson RN Jr, Dietz WH, Horlick M. Classification of body fatness by body mass index- for-age categories among children. Arch Pediatr Adolesc Med 2009; 163:
805-11.
12. Demerath EW, Schubert CM, Maynard LM, Sun SS, Chumlea WC, Pickoff A, Czerwinski SA, Towne B, Siervogel RM. Do changes in body mass index percentile reflect changes in body composition in children?
data from the Fels Longitudinal Study. Pediatrics 2006; 117: e487-95.
13. Neovius M, Rasmussen F. Evaluation of BMI-based classification of ad- olescent overweight and obesity: choice of percentage body fat cutoffs ex- erts a large influence: the COMPASS Study. Eur J Clin Nutr 2008; 62:
1201-7.
14. Kurtoglu S, Mazicioglu MM, Ozturk A, Hatipoglu N, Cicek B, Ustunbas HB. Body fat reference curves for healthy Turkish children and adoles- cents. Eur J Pediatr 2010; 169: 1329-35.
15. Ma J, Feng N, Zhang SW, Pan YP, Huang YB. Comparison of changes in body composition during puberty development of obese and normal- weight children in China. Biomed Environ Sci 2009; 22: 413-8.
16. Ogden CL, Li Y, Freedman DS, Borrud LG, Flegal KM. Smoothed per- centage body fat percentiles for U.S. children and adolescents, 1999-2004.
Natl Health Stat Report 2011; 1-7.
17. McCarthy HD, Cole TJ, Fry T, Jebb SA, Prentice AM. Body fat reference curves for children. Int J Obes (Lond) 2006; 30: 598-602.
18. Laurson KR, Eisenmann JC, Welk GJ. Body fat percentile curves for U.S.
children and adolescents. Am J Prev Med 2011; 41: S87-92.
19. Cole TJ, Pan H; LMSChartmaker. Tyne and Wear. England: Harlow Healthcare, 2005. Available at http://www.healthforallchildren.co.uk [accessed on 1 March 2012].
20. Cole TJ, Green PJ. Smoothing reference centile curves: the LMS method and penalized likelihood. Stat Med 1992; 11: 1305-19.
21. Cole TJ. The LMS method for constructing normalized growth standards.
Eur J Clin Nutr 1990; 44: 45-60.
22. Korea Centers for Disease Control and Prevention. Standard growth charts of Korean children and adolescents in 2007. Seoul: Korea Centers for Disease Control and Prevention, 2007.
23. Lee K, Lee S, Kim SY, Kim SJ, Kim YJ. Percent body fat cutoff values for classifying overweight and obesity recommended by the International Obesity Task Force (IOTF) in Korean children. Asia Pac J Clin Nutr 2007;
16: 649-55.
24. Wells JC. Body composition in childhood: effects of normal growth and
disease. Proc Nutr Soc 2003; 62: 521-8.
25. Maynard LM, Wisemandle W, Roche AF, Chumlea WC, Guo SS, Siervo- gel RM. Childhood body composition in relation to body mass index.
Pediatrics 2001; 107: 344-50.
26. Deurenberg P, Deurenberg-Yap M, Guricci S. Asians are different from Caucasians and from each other in their body mass index/body fat per- cent relationship. Obes Rev 2002; 3: 141-6.
27. Wang J, Thornton JC, Russell M, Burastero S, Heymsfield S, Pierson RN Jr. Asians have lower body mass index (BMI) but higher percent body fat than do whites: comparisons of anthropometric measurements. Am J Clin Nutr 1994; 60: 23-8.
28. Deurenberg-Yap M, Niti M, Foo LL, Ng SA, Loke KY. Diagnostic accura- cy of anthropometric indices for obesity screening among Asian adoles- cents. Ann Acad Med Singapore 2009; 38: 3-6.
29. Nakao T, Komiya S. Reference norms for a fat-free mass index and fat mass index in the Japanese child population. J Physiol Anthropol Appl Human Sci 2003; 22: 293-8.
30. Wells JC. A critique of the expression of paediatric body composition data. Arch Dis Child 2001; 85: 67-72.
31. VanItallie TB, Yang MU, Heymsfield SB, Funk RC, Boileau RA. Height- normalized indices of the body’s fat-free mass and fat mass: potentially useful indicators of nutritional status. Am J Clin Nutr 1990; 52: 953-9.
32. Wells JC, Coward WA, Cole TJ, Davies PS. The contribution of fat and fat-free tissue to body mass index in contemporary children and the ref- erence child. Int J Obes Relat Metab Disord 2002; 26: 1323-8.
33. Park H, Park K, Kim MH, Kim GS, Chung S. Gender differences in rela- tionship between fat-free mass index and fat mass index among Korean children using body composition chart. Yonsei Med J 2011; 52: 948-52.
34. Kim HI, Kim JT, Yu SH, Kwak SH, Jang HC, Park KS, Kim SY, Lee HK, Cho YM. Gender differences in diagnostic values of visceral fat area and waist circumference for predicting metabolic syndrome in Koreans. J Korean Med Sci 2011; 26: 906-13.
35. Helba M, Binkovitz LA. Pediatric body composition analysis with dual- energy X-ray absorptiometry. Pediatr Radiol 2009; 39: 647-56.