저작자표시-비영리-변경금지 2.0 대한민국 이용자는 아래의 조건을 따르는 경우에 한하여 자유롭게
l 이 저작물을 복제, 배포, 전송, 전시, 공연 및 방송할 수 있습니다. 다음과 같은 조건을 따라야 합니다:
l 귀하는, 이 저작물의 재이용이나 배포의 경우, 이 저작물에 적용된 이용허락조건 을 명확하게 나타내어야 합니다.
l 저작권자로부터 별도의 허가를 받으면 이러한 조건들은 적용되지 않습니다.
저작권법에 따른 이용자의 권리는 위의 내용에 의하여 영향을 받지 않습니다. 이것은 이용허락규약(Legal Code)을 이해하기 쉽게 요약한 것입니다.
Disclaimer
저작자표시. 귀하는 원저작자를 표시하여야 합니다.
비영리. 귀하는 이 저작물을 영리 목적으로 이용할 수 없습니다.
변경금지. 귀하는 이 저작물을 개작, 변형 또는 가공할 수 없습니다.
7 7+
1.) ,'8 2 ,&
0,# ;9 ,4030
"/ :6$ 8 %
First Principles Study on the Polyanion based Transition Metal Oxide Materials as Rechargeable
Battery Electrode and Water Oxidation Catalyst
*
!(7 7)
/ 7
- 5
Abstract
First Principles Study on the Polyanion based Transition Metal Oxide
Materials as Rechargeable Battery Electrode and Water Oxidation
Catalyst
Park, Inchul Department of Materials Science and Engineering College of Engineering Seoul National University
Endless increase in energy demand and the depletion of fossil fuels has accelerated progress in the development of alternative energy sources. To cope the ever-growing energy requirements and to provide sustainable energy, large energy storage systems (ESS) have become an important research area in recent years. Among the various candidates, chemical energy storage systems are regarded as the optimum choice for these applications because of the pollution free operation, the high throughput efficiency, and the flexible power and energy characteristics to meet different functions, long cycle life, and low maintenance. In this context, the search for new
materials for ESSs based on cost-effective redox couples has been intensively implemented in recent years. For better materials for ESSs, my main interest is in designing new polyanionic compounds with desirable properties.
In Chapter 2, introduce a new method to remove anti-site defects in olivine crystals for lithium ion battery (LIB), using electrochemical charge carrier injection process at a room temperature. The Fe anti-site defects in LiFePO4 are effectively reduced by the electrochemical recombination of Li/Fe anti-sites. The healed crystal structure of lithium iron phosphate recovers its specific capacity and high-power capabilities. In this chapter, various configuration of anti-site defects and its recombination mechanisms are discussed.
In Chapter 3, a new iron-based mixed polyanion compound, Na4Fe3(PO4)2(P2O7), for NIBs is introduced. Structural characterization of a newly synthesized mixed-polyanion compound with three-dimensional Na pathways was performed using combined X-ray and neutron diffraction studies. The electrode exhibited average potential ~ 3.2 V (vs. Na+/Na) and energy density of 320 Wh kg-1. Also, the reversible electrode operation was found from ion-exchanged sample of Li3NaFe3(PO4)2(P2O7) in Li-ion cells. The electrode delivers about 92 % of theoretical capacity (~140 mAh g-1) with an average voltage of 3.4 V (vs. Li+/Li).
This research firstly suggested that a significant opportunity exists to explore new open-framework electrodes for NIBs with high electrochemical performances by combination of (PO4)3- and (P2O7)4- polyanions.
In Chapter 4, investigated the electrochemical mechanism of NaxFe3(PO4)2(P2O7) (1 ≤ x ≤ 4) in Na-ion cells using first principles calculations and experiments. I discovered that the de/sodiation of the NaxFe3(PO4)2(P2O7) electrode occurs via one- phase reaction with a reversible Fe2+/Fe3+ redox reaction. The electrode accompanies an exceptionally small volumetric change of less than 4% during electrochemical cycling, which is attributed to the open framework of polyanion compounds with flexible P2O7 dimer in the structure. Although the structural distortion in NaFe3(PO4)2(P2O7) reduces Na de/intercalation kinetics at the last step of charge resulting in incomplete utilization of Na (~ 82 % of theoretical capacity), high rate capability was confirmed with the negligible capacity reduction from C/20 to C/5.
Also, stable cycle retention up to 20 cycles were confirmed. In situ X-ray diffraction (XRD) and differential scanning calorimetry (DSC) revealed that the partially charged electrodes, NaxFe3(PO4)2(P2O7) (1 ≤ x ≤ 4), are thermally stable up to 530 °C.
The understanding of electrochemical mechanism of NaxFe3(PO4)2(P2O7) (1 ≤ x ≤ 4) shown here will give a direction to the optimization of the new Na4Fe3(PO4)2(P2O7) electrode for Na rechargeable batteries.
In Chapter 5, introduce an amorphous cobalt phyllosilicate (ACP) with layered crystalline motif prepared by a simple room-temperature precipitation as a new efficient OER catalyst for hydrogen fuel; this material exhibits a remarkably low overpotential (η) among cobalt-based catalysts as well as long-term stability. A structural investigation based on X-ray absorption spectroscopy and Fourier- transform infrared spectra reveals that the silicate layer maintains its structure after
electrolysis. In addition, density functional theory calculations indicate that the layered crystalline motif in the ACP, which is similar to that in CoOOH, is responsible for the OER mechanism; however, the local environment of the active site is significantly modulated by the silicate group, leading to a substantial reduction in the OER η. This work proposes that a new material group of phyllosilicates could be efficient OER catalysts and that tuning of the catalytic activity by controlling the redox-inert groups can pave an explored avenue toward the design of novel high- performance catalysts.
Keywords : Energy Storage, Lithium rechargeable battery, Sodium rechargeable battery, water oxidation catalyst, polyanion compound, Density Functional Theory
Table of Contents
Abstract ··· i
Table of Contents ··· v
List of Figures ··· viii
List of Tables ··· xviii
Introduction ··· 1
1.1 General Background ··· 1
1.2 Lithium ion Battery system ··· 2
1.3 Sodium ion Battery system ··· 3
1.4 Electrochemical Water Splitting for Hydrogen Fuel ··· 5
1.5 References ··· 8
Anti-site reordering in LiFePO4 using charge carrier injection ··· 15
2.1 Introduction ···15
2.2 Experimental ··· 18
2.3 Results and Discussion ··· 21
2.4 Conclusion ··· 44
2.5 References ··· 45
New iron-Based Mixed-Phosphate Cathodes for Lithium and
Sodium Rechargeable Batteries ··· 49
3.1 Introduction ··· 49
3.2 Experimental ··· 52
3.3 Results and Discussion ··· 56
3.4 Conclusion ···81
3.5 References ··· 82
Understanding the electrochemical mechanism of the new iron-based mixed-phosphate Na4Fe3(PO4)2(P2O7) in a Na rechargeable battery ··· 86
4.1 Introduction ··· 86
4.2 Experimental ··· 89
4.3 Results and Discussion ··· 93
4.4 Conclusion ··· 127
4.5 References ··· 128
Amorphous cobalt phyllosilicate with layered crystalline motifs as water oxidation catalyst ··· 131
5.1 Introduction ··· 131
5.4 Conclusion ··· 192
5.5 References ··· 193
Summary ··· 201
Abstract in Korean ··· 203
List of Figures
Figure 2-1. Calculated formation energy of anti-site defect in LiFePO4 and its configuration corresponding to the distance between Li+ on Fe2+ site and Fe2+ on Li+ site. Near anti-site defect has lower formation energy. (a) Edge-shared anti-site defect with the lowest formation energy (about 390 meV) (b), (c) Corner-shared anti- site defect with the formation energy of about 490 meV.
Figure 2-2. Formation energies for 45 different vacancy-Fe defect configurations of the single-phase Li1-xFePO4 from first principles calculations. The most stable energy is observed in (a) the corner-shared configuration and the second most stable configurations is shown as (b) the edge-shared configuration.
Figure 2-3. Energy curve and schematics of the Fe-Li cation site re-ordering process during discharge. The black line is the Fe/Li recombination route with no charge carrier injection. The red line is the hypothetical Fe/Li recombination route with a charge carrier (electron) injection. Schematics 1 – 4 schematics are Fe-Li cation site re-ordering processes at each point.
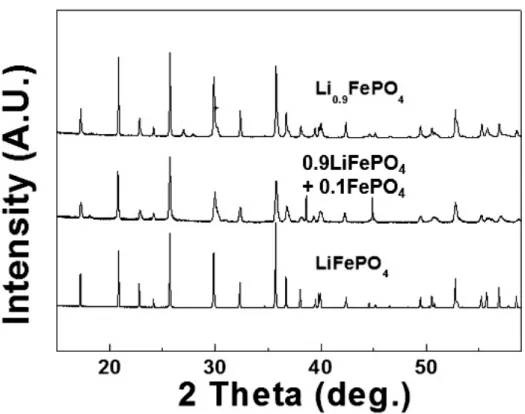
Figure 2-4. The 15 ~ 55° high resolution powder diffraction patterns of prepared by hydrothermal synthesis
Figure 2-5. (a) Magnified (200) peak of high resolution powder diffraction patterns of the prepared samples. (b) Rietveld refinement results of solid-solution Li0.9FePO4. The inset figure is an SEM image of micro-size Li0.9FePO4.
Figure 2-6. Rietveld refinement of hydrothermally prepared LiFePO4. Figure 2-7. Rietveld refinement result of electrochemically treated LiFePO4. Figure 2-8. Defect characterization (a) Black: GITT result of Li0.9FePO4, red: qusai- OCV result of Li0.9FePO4, blue: qusai-OCV of conventional LiFePO4. (b) Lattice
change as a function of anti-site ratio. The inset figure is shown the unit cell volume change as a function of anti-site ratio. Red line : trend line, blue line : confidence band, green line : prediction band. The interval coverage probability is set as 95 %.
The star points symbolized stand for hydrothermal synthesized LiFePO4 and electrochemically treated LiFePO4. The data are taken from references 20, 30, 40 and 42. (d) FT-IR results of prepared samples PO43-
spectra.
Figure 2-9. Lattice parameter with change modification with anti-site ratio at room temperature. Red line: trend line, blue line: confidence band, green line: prediction band. The interval coverage probability is set as 95 %. This figure used reference number 25, 35, 47 and 49.
Figure 2-10. The electrochemical profile of solid-solution Li0.9FePO4 at C/100. The 1st discharge profile showed unexpected high polarization, however, the 2nd profile did not show overpotential during charging/discharging.
Figure 2-11. 15 ~ 55° XRD patterns of prepared by solid-state method samples (left) and magnified (200) peak of samples (right). red line: (200) peak of LiFePO4, blue line: (200) peak of FePO4. All samples are well synthesized without remarkable impurities.
Figure 2-12. SEM image of prepared LiFePO4. (a) Hydrothermal synthesis LiFePO4
(b) 380 °C heated hydrothermal synthesis Li0.9FePO4 (c) 600 °C solid-state synthesis LiFePO4 (d) 380 °C heated solid-state 600 °C synthesis Li0.9FePO4.
Figure 2-13. (a) First charge/discharge profile at C/200 of electrochemically treated micro-LiFePO4 and hydrothermally grown micro-LiFePO4. (b) C-rate capability of electrochemically treated nano-LiFePO4 (red) and conventional nano-LiFePO4
(black).
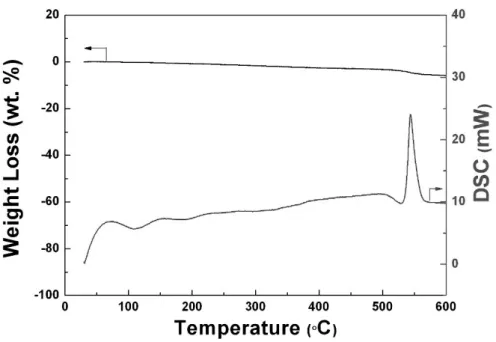
Figure 3-1. Thermogravimetric analysis and differential scanning calorimetry (TGA/DSC) of the precursor used for the solid-state synthesis of Na4Fe3(PO4)2(P2O7).
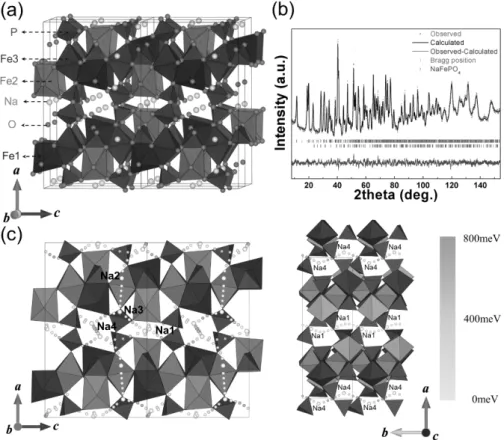
Figure 3-2. (a) Schematic representation of Na4Fe3(PO4)2(P2O7). (b) Rietveld refinement of the neutron diffraction patterns of Na4Fe3(PO4)2(P2O7). The observed
and calculated intensities are represented by the red markers and the black solid line, respectively. The bottom blue line represents the difference between the observed and calculated patterns. Bragg positions for Na4Fe3(PO4)2(P2O7) are represented as green markers, and the NaFePO4 (4%) impurity is shown as purple markers. (c) The 3D sodium diffusion paths in the Na4Fe3(PO4)2(P2O7) structure.
Figure 3-3. Detailed schematics of the Na channel along the b−c plane and the diphosphate connection between the [Fe3P2O13]∞ layers are presented in (a). The sodium sites along the a- and b-axes in the structure of Na4Fe3(PO4)2(P2O7) are shown in (b) and (c), respectively. The four different Na sites in the structure of Na4Fe3(PO4)2(P2O7) are shown in (d).
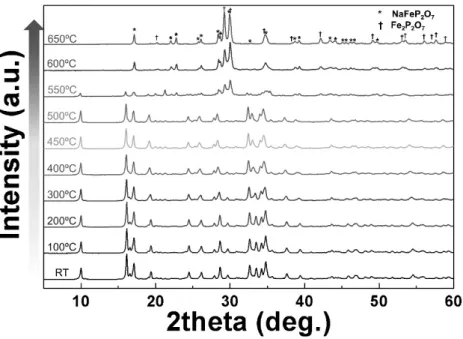
Figure 3-4. In-situ high-temperature X-ray diffraction (XRD) patterns of Na4Fe3(PO4)2(P2O7) in the temperature range of 25−650°C under an Ar atmosphere.
The NaFePO4 peaks start to significantly evolve above 550°C.
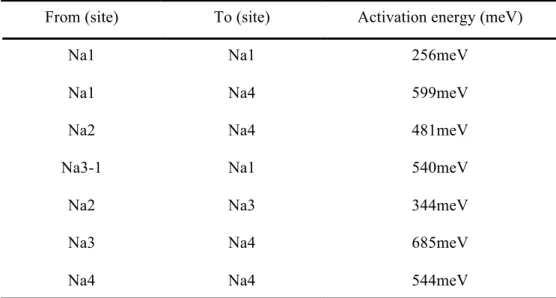
Figure 3-5. Calculated main diffusion motion along the b-axis as illustrated in (a) and (b). (c) The activation barrier of sodium from one Na1 site to another Na1 site.
Figure 3-6. (a) Galvanostatic charge/discharge profiles of Na4Fe3(PO4)2(P2O7) under a C/40 rate and the calculated average voltage at each region. The inset shows the dQ/dV curve of initial charge/discharge profiles. (b) Cycle performance of a Na cell under C/40 and C/20 rates.
Figure 3-7. XRD patterns of NaxFe3(PO4)2(P2O7) (x = 1, 4).
Figure 3-8. Mössbauer spectra of NaxFe3(PO4)2(P2O7) (x = 1, 4).
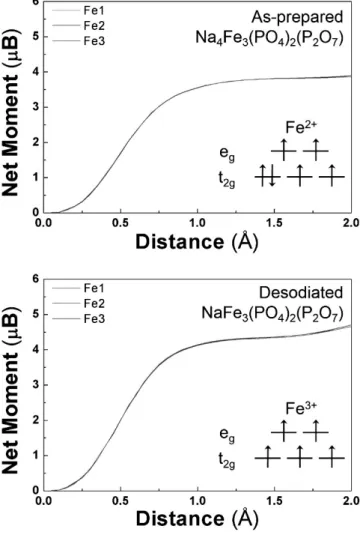
Figure 3-9. Integrated spin as a function of integration radius around Fe in Na4−xFe3(PO4)2(P2O7) (x = 0, 3).
Figure 3-10. TGA/DSC analysis of the desodiated phase of NaFe3(PO4)2(P2O7).
Figure 3-11. In-situ high-temperature XRD patterns of NaFe3(PO4)2(P2O7) for a
Figure 3-12. (a) XRD patterns of Li3NaFe3(PO4)2(P2O7). The reference sodium phase of Na4Fe3(PO4)2(P2O7) is represented below. (b) Calculated voltage and galvanostatic charge/discharge profiles of the Li cell under a C/20 rate at 298 K and calculated voltage profiles; (c) cyclability of the Li-ion cell under C/5 at 333 K. (d) The rate capability of Li3NaFe3(PO4)2(P2O7) in the Li-ion cell.
Figure 4-1. (a) Rietveld refinement of Na4Fe3(PO4)2(P2O7) using XRD. A schematic representation of Na4Fe3(PO4)2(P2O7) is illustrated in the inset. (b) Galvanostatic charge/discharge profiles of Na4Fe3(PO4)2(P2O7) in a Na-ion cell at the C/20 rate.
The inset presents the cycle performance at various C-rates (C/20, C/10, and C/5).
Figure 4-2. (a) Scanning electron microscopy (SEM) and (b) transmission electron microscopy (TEM) images of Na4Fe3(PO4)2(P2O7) showing that the primary particle sizes are about 100 – 200 nm and that the crystallinity is good.
Figure 4-3. (a) Ex situ XRD patterns of Na4Fe3(PO4)2(P2O7) in a Na-ion cell during the charge/discharge process. Amplified XRD patterns in the 2θ range of 8 to 19° are illustrated in (b).
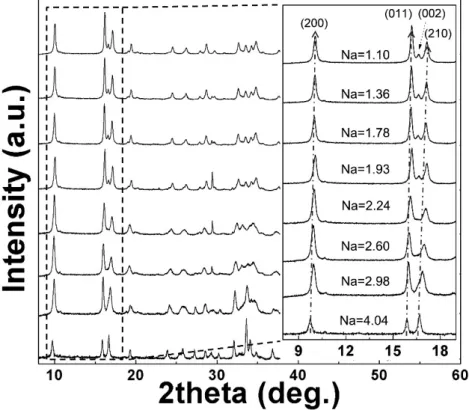
Figure 4-4. X-ray diffraction (XRD) patterns of NaxFe3(PO4)2(P2O7) (1 ≤ x ≤ 4) powder samples synthesized by chemical desodiation.
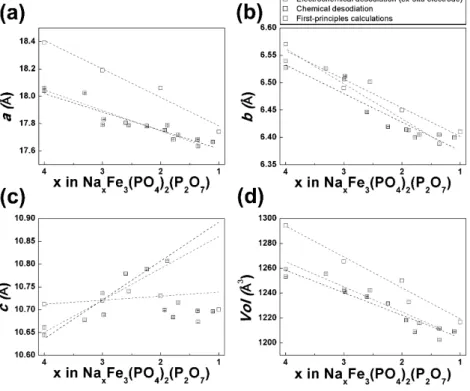
Figure 4-5. (a) a, (b) b, (c) c lattice parameters and (d) lattice volume change of NaxFe3(PO4)2(P2O7) as a function of Na composition (x).
Figure 4-6. (a) a, (b) b, (c) c lattice parameters, and (d) lattice volume change of NaxFe3(PO4)2(P2O7) as a function of Na composition (x). The black, blue, and red rectangle markers represent the lattice parameters of ex situ electrode samples during the initial charge, discharge, and second charge, respectively.
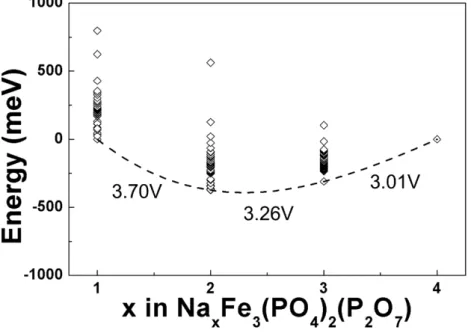
Figure 4-7. DFT formation energies of NaxFe3(PO4)2(P2O7) at various configurations of x.
Figure 4-8. (a) Local structure schematics of NaxFe3(PO4)2(P2O7) around Fe sites and integrated spin as a function of integration radius around Fe in NaxFe3(PO4)2(P2O7) ((b) x = 4, (c) x = 3, (d) x = 2, and (e) x = 1).
Figure 4-9. Structure schematics of NaxFe3(PO4)2(P2O7) at (a) x = 2 and (b) x = 1 from first principles calculations.
Figure 4-10. (a) Rietveld refinement of NaFe3(PO4)2(P2O7) using ND. (b) Local structure schematics around Fe1 and P(3) – O – P(4) bond angle comparison table as a function of Na content (x) in NaxFe3(PO4)2(P2O7) from ND analysis.
Figure 4-11. XANES spectra during first (a) charge and (b) discharge. XANES spectra of the as-prepared state and of the end of charge and end of discharge states are shown in (c).
Figure 4-12. X-ray absorption near-edge structure (XANES) spectra of the NaxFe3(PO4)2(P2O7) electrode during the second charge.
Figure 4-13. XANES spectra of chemically prepared NaxFe3(PO4)2(P2O7) (1 ≤ x ≤ 4) samples.
Figure 4-14. PITT measurements of Na4Fe3(PO4)2(P2O7) during (a) charging and (b) discharging.
Figure 4-15. Differential scanning calorimetry (DSC) spectra of NaxFe3(PO4)2(P2O7) (1 ≤ x ≤ 4).
Figure 4-16. In situ high-temperature XRD of desodiated powder samples of NaxFe3(PO4)2(P2O7) at (a) x = 3.2, (b) x = 2.72, (c) x = 2.21, and (d) x = 1.71.
Figure 4-17. Phase diagram of NaxFe3(PO4)2(P2O7) (1 < x < 4).
Figure 5-1. Crystal structure of phyllosilicate. (Inset: two kinds of phyllosilicate) Figure 5-2. SEM image of ACP prepared by co-precipitation method
Figure 5-4. Fourier transform infrared (FT-IR) of the ACP and heated ACP by hydrothermal method.
Figure 5-5. The variation of the Co/Si ratio with different precursor ratio.
Figure 5-6. Powder X-ray diffraction patterns of ACP with different precursor ratio.
Figure 5-7. Polarization curves of ACP in 1 M KOH electrolyte with different precursor ratio.
Figure 5-8. Schematic representation of CoOOH and ACP structure. CoOOH and the ACP consist of edge-sharing CoO6 octahedra. The silicate layer of ACP features Si- deficient structure in contrast with the ideal phyllosilicate structure composed of hexagonal tetrahedral ring.
Figure 5-9. Structure of cobalt phyllosilicate Co3Si2O9H4. Co3Si2O9H4 consist of cobalt hydroxide layer and perfect hexagonal silicate chains at one sides of cobalt layers. The other side is terminated with hydrogen. Co, Si, O, and H are shown as blue, green, red and white spheres, respectively.
Figure 5-10. Structure of cobalt phyllosilicate Co3Si4O12H2. Co3Si4O12H2 consist of cobalt hydroxide layer and perfect hexagonal silicate chains at both sides of cobalt layers. Co, Si, O, and H are shown as blue, green, red and white spheres, respectively.
Figure 5-11. Calculated structure of ACP (Co3Si3O12H6). From reported structures of cobalt phyllosilicate (Co3Si2O9H4 and Co3Si4O12H2), we predicted structural motif of ACP with Co:Si:O = 1:1:4 using DFT calculations. Hydrogen atoms added to maintain Co oxidation state as 2+. (a) Homogeneous model with Si deficient chain at both side of cobalt hydroxide layer shows much stable energy (7.5 meV per atom) than that of (b) Inhomogeneous model with Si deficient chain at one side of cobalt hydroxide layer. Co, Si, O, and H are shown as blue, green, red and white spheres, respectively.
Figure 5-12. Oxygen evolution properties of prepared cobalt based catalysts. (a) iR- corrected polarization curves in 1 M KOH at scan rate of 10 mV s-1 and (c) the
corresponding tafel plots. (b) OER overpotentials required for 10 mA cm-2. (d) The plots of differences in current density (Δj = ja – jc) at 1.05 V vs. RHE against scan rate due to evaluate electrochemical double layer capacitance. (e) Long-term stability of the ACP performed under constant current density at j = 10 mA cm-2 for 24 h.
Figure 5-13. Powder X-ray diffraction pattern of CoOOH nanoplates.
Figure 5-14. SEM image of CoOOH nanoplates.
Figure 5-15. Powder X-ray diffraction pattern of Co3O4 nanoparticles.
Figure 5-16. SEM image of Co3O4 nanoparticles.
Figure 5-17. (a) XANES cobalt K-edge spectra of the as-prepared ACP and the after 1st CV ACP. For comparison, CoO and LiCoO2 also shown for reference samples of Co2+ and Co3+, respectively. (b) Oscillations of the EXAFS spectra and (c) Fourier transformed k3-weighted EXAFS spectra of the as-prepared, after electrolysis ACP and CoOOH. (d) Comparison between experimental Fourier transformed EXAFS spectrum (dotted line) of the ACP after electrolysis and theoretical fit (red line).
Figure 5-18. Comparison between experimental Fourier transformed EXAFS spectrum (dotted line) of the CoOOH nanoplates and theoretical fit (red line).
Figure 5-19. Comparison between experimental Fourier transformed EXAFS spectrum (dotted line) of as-prepared ACP and theoretical fit (red line).
Figure 5-20. Surface structures of OER active surface from (a, c) CoOOH surface and (b, d) ACP surface. (a) Side view for the CoOOH () surface which is most active surface for OER. (b) Side view for the CoOOH surface with similar atomic configuration to the CoOOH () surface. The ACP surface has longer interlayer distance than CoOOH. Top view for active surface of (c) CoOOH and (d) ACP shows active sites for OER. Co, Si, O, and H are shown as blue, green, red and white spheres, respectively. To clarify, we reveal only topmost atoms.
Cleavage line for ACP has similar atomic configuration to the CoOOH () surface and silicate tetrahedron is preserved.
Figure 5-22. Surface termination of ACP surface (model 1) corresponds to the potential. (a) Surface phase diagram as a function of applied potential for ACP surface model. Stable surface structures with adsorbates corresponds to applied potential: (b) with 1 monolayer (ML) of co-adsorbed H2O (below 1.1 V), (c) with 1 ML of OH and 3/4 ML of H (from 1.1 V to 1.8 V), and (d) with 1 ML of OH and 1/4 ML (above 1.8 V). To clarify, only topmost atoms are shown.
Figure 5-23. Surface structures of another surface of ACP model (model 2). Different from ACP surface model in the Figure 5-20, silicates are adsorbed at the bridge site rather than terminal site. (a) Side view for the CoOOH surface with similar atomic configuration to the CoOOH (101 ̅4) surface. (b) Top view for active surface of ACP shows active sites for OER. Co, Si, O, and H are shown as blue, green, red and white spheres, respectively. To clarify, only topmost atoms are shown.
Figure 5-24. Surface termination of another ACP surface (model 2) corresponds to the potential. (a) Surface phase diagram as a function of applied potential for ACP surface model. Stable surface structures with adsorbates corresponds to applied potential: (b) with 1 monolayer (ML) of co-adsorbed H2O (below 1.1 V), (c) with 1 ML of OH and 3/4 ML of H (from 1.1 V to 1.8 V), and (d) with 1 ML of OH and 1/4 ML (above 1.8 V). To clarify, only topmost atoms are shown.
Figure 5-25. DFT calculation results for OER at CoOOH and ACP surfaces. (a) Theoretical overpotentials for OER of plausible sites. Some bridge site on ACP surface show much lower overpotential than active sites of CoOOH. (b) Free energy landscape for OER at 1.23 V (ideal potential for OER). Black, cyan and blue line indicate free energy of ACP bridge 1 site, CoOOH bridge site, and CoOOH terminal site, respectively. Comparison of the structures for OOH* forming step (rate- determining step for these cases) at the (c) ACP bridge 1 site, (d) CoOOH bridge site,
and (e) CoOOH terminal site. More adjustment in bond-length at the ACP surface lower the OER overpotential.
Figure 5-26. OER pathways and calculated minimum overpotential for terminal 1 site on ACP surface (model 1). Deprotonation from terminal 1 site needs more than 2.33 eV, therefore overpotential for OER is higher than 1.1 V.
Figure 5-27. OER pathways and calculated minimum overpotential for terminal 2 site on ACP surface (model 1). Vacancy at terminal 2 site is unstable, therefore OH*
adsorption step is spontaneous with ΔG = - 2.62 eV. Because ΔG1 + ΔG2 is -1.54 eV, overpotential is higher than 2.00 V. (ΔG3 + ΔG4 = 6.46 eV)
Figure 5-28. OER pathways and calculated minimum overpotential for bridge 1 site on ACP surface (model 1). All the reaction steps at bridge 1 site are stable, therefore OER at bridge 1 site has much lower overpotential than other sites on ACP surface or CoOOH surface.
Figure 5-29. OER pathways and calculated minimum overpotentials for bridge 2 site on ACP surface (model 1). Different from that of bridge 1 site, deprotonation from bridge 2 site needs higher than 1.92 eV, therefore overpotential for OER is higher than 0.69 V.
Figure 5-30. OER pathways and calculated minimum overpotential for terminal 3 site on ACP surface (model 2). Deprotonation from terminal 3 site needs high potential of 1.94 V, thus overpotential for OER is higher than 0.71 V.
Figure 5-31. OER pathways and calculated minimum overpotential for terminal 4 site on ACP surface (model 2). OER from terminal 4 site shows moderate overpotential of 0.54 V which is similar to the CoOOH case.
Figure 5-32. OER pathways and calculated minimum overpotential for bridge 3 site on ACP surface (model 2). OER at bridge 3 site shows overpotential of 0.81 V. Rate determining step is OOH* formation step because silicate group does not stabilize
Figure 5-33. OER pathways and calculated minimum overpotential for bridge 4 site on ACP surface (model 2). Different from that of bridge 3 site, deprotonation from bridge 4 site needs higher than 2.12 eV, therefore overpotential for OER is higher than 0.89 V.
List of Tables
Table 2-1. Detailed structural information of hydrothermally prepared LiFePO4
analyzed by Rietveld refinement.
Table 2-2. Detailed structural information of solid-solution Li0.9FePO4 analyzed by Rietveld refinement.
Table 2-3. Detailed structural information of electrochemically treated LiFePO4
analyzed by Rietveld refinement.
Table 3-1. The detailed data for the structural refinement of Na4Fe3(PO4)2(P2O7) using ND patterns.
Table 3-2. Sodium vacancy activation barriers in the Na4Fe3(PO4)2(P2O7) structure.
Table 3-3. Lattice parameters of NaxFe3(PO4)2(P2O7) (x = 4, 1).
Table 3-4. Quadruple splitting, isomer shift values, and the ratio of each iron site in NaxFe3(PO4)2(P2O7) (x = 4, 1).
Table 3-5. Volumetric energy density of iron-based polyanion compounds.
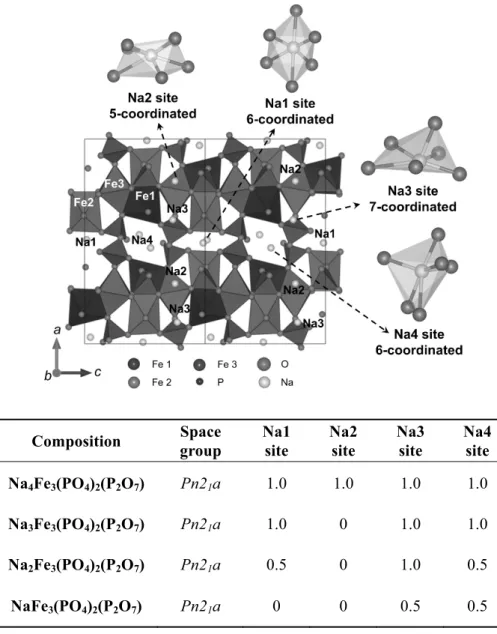
Table 4-1. Schematic representations of Na4Fe3(PO4)2(P2O7) and order of sodium extraction from the structure of NaxFe3(PO4)2(P2O7) (1 ≤ x ≤ 4).
Table 4-2. Detailed structural information of NaFe3(PO4)2(P2O7) analyzed by Rietveld refinement of the ND pattern.
Table 4-3. Bond valence parameters of each atom in NaxFe3(PO4)2(P2O7) (x = 1, 4).
Table 5-1. Element ratio of ACP prepared by Co/Si precursor ratio 3:4.
Table 5-2. Element ratio of ACP prepared by Co/Si precursor ratio 3:2.
Table 5-3. Element ratio of ACP prepared by Co/Si precursor ratio 3:3.
Table 5-5. Structural parameters of the theoretically fitted FT-EXAFS in Figure 5-17d.
Introduction
1.1 General Background
Continuous increase of energy demand and exhaustion of fossil fuel concerns accelerate developments of alternative energy such as photovoltaic power generation, wind power generation, hydroelectric power generation, geothermal power generation. In this respect, large-scale energy storage is an important issue in dealing with the generation and demand of uneven energy.1 The largest technology group of the energy storage system (ESS) is chemical storage systems such as batteries and hydrogen fuel. It efficiently stores electricity in chemical substances and can release reversibly on demand. Generally, chemical energy storage has many desirable features including non-polluting operation, high reciprocating efficiency, and flexible power and energy characteristics to satisfy different functions, long cycle life, and low maintenance. Chemical energy storage systems store energies through a redox reaction of a material. Simple transition metal oxide materials have been extensively studied as redox active materials for chemical energy storage (See below for explanation of each system). However, since the types of transition metal oxides are limited, it is difficult to satisfy various needs such as cost, stability, appropriate oxidation-reduction potential. In this regard, polyanionic transition metal oxide compounds have been extensively studied as an important group of potential redox- active materials for chemical energy storage systems due to their chemical diversity.2-4
1.2 Lithium ion Battery system
Lithium ion battery (LIB) system is one of the most promising ESS. LIB stores electric energy while lithium ions deintercalates from the cathode materials.5 At the same time, transition metal ions in the cathode material are reduced. Important properties of LIB such as energy density, stability, and power are determined by the composition and the framework of the transition metal containing material.6-8 Simple metal oxides materials were intensively investigated. Simple metal oxide materials exhibit high energy density but low safety and cyclability disadvantages. Otherwise, lithium ion phosphate (LFP), which is the one of the promising polyanion-based transition metal oxide electrode material for LIB, shows promising electrochemical properties for applying a large scale energy storage system.9-12 Theoretically, the LFP could release and insert Li ion on their crystal structure with a theoretical gravimetric energy density of 580 Wh kg-1(theoretical capacity of ~ 169 mAh g-1, Fe2+/3+
redox voltage of 3.42 V (vs. Li/Li+)) through the 1-D channels being along the [010]
direction of crystal structure (Pnma).13 However, in practice, the Li-Fe cation site exchange defect (anti-site) in Li diffusion channel always forms with 1 ~ 5 % ratio depending on synthesize route, resulting in denying LFP to reach at a desired energy and power density.7 For example, the presence of 0.1 % anti-site ratio in micro size LFP makes statically its energy density to almost half of original value and reduces ionic conductivity with two or three orders.15 Since the nano-sizing or post crystal structural treatment on LFP has been widely applied to avoid immobile Fe anti-site
because anti-site still remains under 1% in their structure.15,17 In addition, the nano- synthesis leads to other problems, such as lowering tap density of electrode, generating other surface defects, surface side reaction during cycling and additional cost problem at synthesizing.18,19 Therefore, it is difficult for these approaches to be an ultimate solution as satisfying high gravimetric/volumetric energy density and low cost active materials. Chapter 2 in this thesis deals with a new defect control method using an electrochemical procedure at room temperature. By tailoring the local environment around defects according to a strategy suggested by first principles calculations, it was found that the energy level of defects and the activation barrier for recombination could be lowered significantly. Experimental verification with a case study of LiFePO4 revealed that significant defect annihilation occurred from a structural analysis, which substantially boosted the power capability of the material.
In this work, an effective way to reduce Li-Fe defects is proposed using a simple electrochemical treatment at room temperature.
1.3 Sodium ion Battery system
Another promising alternative to conventional LIB is sodium ion battery (NIB) because of the unlimited Na resources and similar electrochemistry to LIB.
Furthermore, the electrodes composed of Na guest ion and redox couples based on low cost transition metals such as Fe would be an optimal design for large scale ESSs.2-4 However, only a limited number of such materials have been reported to date.
Recent studies have identified several important types of potential electrode materials such as layered oxides, Prussian blue analogues and transition metal-free organic electrodes.2-4 There are numerous researches on layered oxide electrodes.20-
23 Although these layered-type materials possess merits such as high capacity and energy density, the large volume change (>10%) during electrochemical cycling and the phase instability of the charged structure are largest obstacles.24-25 Also, general sodium layered oxides are very hygroscopic, therefore they exhibit irreversible phase transformation in the air at room temperature.26
The polyanion-based compounds have been extensively studied as an important group of potential electrode materials due to their structural stability and chemical diversity.27 The general structure based on the polyanions provides the structural stability due to the strong X-O (X = P, S, B, Si) covalent bonding in the structure, and the open rigid framework is beneficial for a small volume change upon electrochemical cycling with a fast ionic mobility compared common layered materials. Moreover, its diversity in chemistry in terms of polyanion species, transition metals and the crystal structure offers many opportunities to find new electrode materials with high-performance and low-cost. To date, the search for cost efficient polyanion electrodes has focused on the phosphate, pyrophosphate, fluorophosphates, fluorosulfate and sulfate containing iron-based materials.
However, low voltage below 3.0 V is problematic.
In the search for new Na-containing polyanion compounds, there has been
structure, namely, a mixed-polyanion system. This system was firstly examined by pioneering work of A. K. Pahdi et al., and they showed that the combination between two different Li3Fe2(PO4)3 and Fe2(PO4)3 phases produces new electrode material of LiFe2(SO4)2(PO4).28 Recent synthesis of new mixed-polyanion compounds, Na7V4(P2O7)4PO4 and Na3MnPO4CO3, showed that variety of combinations may lead to the discovery of a new open crystal framework with promising electrochemical properties.29-30
In this thesis, a new mixed-polyanion compounds based on (PO4)3- and (P2O7)4- as well as low cost transition metal redox couples of Fe2+/Fe3+ were designed. I revealed redox mechanism and diffusion kinetics of a new iron-based mixed- polyanion compound, Na4Fe3(PO4)2(P2O7), for the first time using first principles.
Detailed researches on this material is discussed in Chapter 3 and Chapter 4.14,16
1.4 Electrochemical Water Splitting for Hydrogen Fuel
Electrochemical water splitting has been viewed as a promising and eco- accommodating way to deal with create hydrogen, a spotless fuel, by keeping away from a reliance on fossil energizes.31-37 The oxygen evolution reaction (OER) is the bottleneck of the general water splitting reaction in view of the slow multi-electron response and O–O bond formation.38-41 The precious metal based catalysts, for example, RuO2 and IrO2 have been broadly considered as prime catalyst for OER due to the superior catalytic activity.42-46 However, the rarity and the high cost of
precious metals restrict the commercialization of these catalysts; accordingly, tremendous researches for the efficient and inexpensive OER catalyst using non- precious transition metals have proceeded. 47-56 Nocera group reported that the Co- or Ni- based materials such as amorphous cobalt phosphates and nickel borates show the comparable performance or outperform that of the precious metal-based catalysts even in neutral and weak basic electrolyte.39, 56 Likewise, later researches have revealed that layered metal (oxy)hydroxides can be successful electrocatalysts, among which layered double hydroxides (LDHs) containing Ni, Fe, or Co can show amazingly high OER catalytic activity that can outperform that of precious metal- based catalysts.57-61
Unveiling the origin of high catalytic activity in such transition metal based OER catalysts would provide a hint to effectively design new efficient catalysts. While the local environment of the redox active element is highly related with the activity of OER catalysts, studies have proposed that the coordination number of transition metals (MOx), the local distortion of MOx and how they are connected (i.e. edge- shared or corner-shared) can sensitively influence on the catalytic activity. 53,62-67 Furthermore, neighboring redox inert elements can alter the redox activity of catalysts, for example, anions such as phosphate and borate enable efficient proton- coupled electron transfer (PCET) 46-48, or capping anion species determine the domain size of electrodeposited amorphous catalysts62,63,71,72
, significantly affecting the catalysis. Also, in our recent study, it was shown that the phosphate or
Na2CoP2O7 can offer the structural flexibility stabilizing the transition metal, thus enhances the OER activity, 53,73,74 indicative of the importance of the relationship between the structure and catalytic properties.
In chapter 5, I report an amorphous cobalt phyllosilicate (ACP) with layered crystalline motif for a new efficient OER catalyst. The ACP catalyst can be prepared using a simple, fast, and low-cost precipitation method at room temperature and exhibits one of the highest OER activities among known cobalt-based catalysts. In our investigation to elucidate the origin of the catalysis, it is revealed that the OER activity stems from the layered crystalline motif in the ACP, which resembles the structure of CoOOH. Nevertheless, silicate groups present in the interlayer space of the layered crystalline motif significantly modulate the local environment of the active sites and substantially reduce the overall OER overpotential (η) compared with that of conventional layered metal (oxy)hydroxides, as demonstrated by density functional theory (DFT) calculations. This finding suggests that structural modulation by introducing redox-inert groups in the layer space of metal (oxy)hydroxides can be a viable strategy to tune the catalytic activity and that transition-metal-based phyllosilicates can be new candidates for low-cost and efficient OER catalysts.
1.5 References
(1) H. Chen, T. N. Cong, W. Yang, C. Tan, Y. Li, Y. Ding Prog. Nat. Sci. 2009, 19, 291.
(2) S.-W. Kim, D.-H. Seo, X. Ma, G. Ceder, K. Kang, Adv. Energy Mater. 2012, 2, 710-721.
(3) H. Pan, Y.-S. Hu, L. Chen, Energy Environ. Sci. 2013, 6, 2338-2360.
(4) D. Kundu, E. Talaie, V. Duffort, L. F. Nazar, Angew. Chem. Int. Ed. 2015, 54, 3431-3448.
(5) M. Armand and J.M. Tarascon, Nature 2008, 451, 652-657.
(6) K. Kang and G. Ceder, Phy. Rev. B, 2006, 74, 094105.
(7) J. Chen and J. Graetz, ACS Applied Materials & Interfaces, 2011. 3, 1380-1384.
(8) G.K.P. Dathar, D. Sheppard, K.J. Stevenson and G. Henkelman, Chem. Mater.
2011, 23, 4032-4037.
(9)_P. Gibot, M. Casas-Cabanas, L. Laffont, S. Levasseur, P. Carlach, S. Hamelet, J.M. Tarascon and C. Masquelier, Nat. Mater. 2008, 7, 741-747.
(10) W. Dreyer, J. Jamnik, C. Guhlke, R. Huth, J. Moškon, and M. Gaberšček, Nat.
Mater. 2010, 9, 448-453.
(11) T. Sasaki, Y. Ukyo, and P. Novák, Nat. Mater. 2013, 12, 569-575.
(12) C. Delacourt, J.M. Tarascon and C. Masquelier, Nat. Mater. 2005, 4, 54-260.
(13) A.K. Padhi, K.S. Nanjundaswamy, and J.B. Goodenough, J. Electrochem. Soc.
1997, 144, 1188-1194.
(14) H. Kim, I. Park, D.-H. Seo, S. Lee, S.-W. Kim, W. J. Kwon, Y.-U. Park, C. S.
Kim, S. Jeon, K. Kang, J. Am. Chem. Soc. 2012, 134, 10369-10372.
(15) R. Malik, D. Burch, M. Bazant, and G. Ceder, Nano Letters, 2010, 10, 4123- 4127.
(16) H. Kim, I. Park, S. Lee, H. Kim, K.-Y. Park, Y.-U. Park, H. Kim, J. Kim, H.-D.
Lim, W.-S. Yoon, K. Kang, Chem. Mater. 2013, 25, 3614-3622.
(17) J. Chen and M.S. Whittingham, Electrochem. Commun. 2006, 8, 855-858.
(18) C. M. Julien, A. Mauger, and K. Zaghib, J. Mater. Chem. 2011, 21, 9955-9968.
(19) J. Wang et al., Nat. Commun. 2014, 5.
(20) N. Yabuuchi, M. Kajiyama, J. Iwatate, H. Nishikawa, S. Hitomi, R. Okuyama, R. Usui, Y. Yamada and S. Komaba, Nat. Mater., 2012, 11, 512-517.
(21) B. Mortemard de Boisse, D. Carlier, M. Guignard, C. Delmas, J. Electrochem.
Soc. 2013, 150, A569-A574.
(22) D. Kim, E. Lee, M. Slater, W. Lu, S. Rood, C. S. Johnson, Electrochem.
Commun. 2012, 18, 66-69.
(23) S. –M. Oh, S. –T. Myung, C. S. Yoon, J. Lu, J. Hassoun, B. Scrosati, K. Amine, Y. –K. Sun, Nano Lett. 2014, 14, 1620-1626.
(24) R. Berthelot, D. Carlier and C. Delmas, Nat. Mater., 2011, 10, 74-80.
(25) S. Komaba, N. Yabuuchi, T. Nakayama, A. Ogata, T. Ishikawa and I. Nakai, Inorg. Chem., 2012, 51, 6211-6220.
(26) V. Duffort, E. Talaie, R. Black, and L.F. Nazar, Chem. Mater. 2015, 27, 2515- 2524.
(27) C. Masquelier and L. Croguennec, Chem. Rev. 2013, 113, 6552-6591.
(28) A. K. Padhi, V. Manivannan, J. B. Goodenough, J. Electrochem. Soc. 1998, 145, 1518-1520.
(29) S. Y. Lim, H. Kim, J. Chung, J. H. Lee, B. G. Kim, J.-J. Choi, K. Y. Chung, W.
Cho, S.-J. Kim, W. A. Goddard, Y. Jung and J. W. Choi, Proc. Nat. Acad. Sci. U. S.
A., 2013, A111, 599-604.
(30) H. Chen, Q. Hao, O. Zivkovic, G. Hautier, L.-S. Du, Y. Tang, Y.-Y. Hu, X. Ma, C. P. Grey, G. Ceder, Chem. Mater. 2013, 25, 2777-2786.
(31) Lewis, N. S.; Nocera, D. G. Proc. Natl. Acad. Sci. U.S.A. 2006, 103, 15729.
(32) Grätzel, M. Nature 2001, 414, 338.
(33) Gust, D.; Moore, T. A.; Moore, A. L. Acc. Chem. Res. 2009, 42, 1890.
(34) Swierk, J. R.; Mallouk, T. E. Chem. Soc. Rev. 2013, 42, 2357.
(35) Tachibana, Y.; Vayssieres, L.; Durrant, J. R. Nat. Photonics 2012, 6, 511.
(36) Kudo, A.; Miseki, Y. Chem. Soc. Rev. 2009, 38, 253.
(37) Faunce, T.; Styring, S.; Wasielewski, M. R.; Brudvig, G. W.; Rutherford, A. W.;
(38) Hurst, J. K. Science 2010, 328, 315.
(39) Kanan, M. W.; Nocera, D. G. Science 2008, 321, 1072.
(40) Suntivich, J.; May, K. J.; Gasteiger, H. A.; Goodenough, J. B.; Shao-Horn, Y.
Science 2011, 334, 1383.
(41) Betley, T. A.; Wu, Q.; Van Voorhis, T.; Nocera, D. G. Inorg. Chem. 2008, 47, 1849.
(42) Galizzioli, D.; Tantardini, F.; Trasatti, S. J. Appl. Electrochem. 1974, 4, 57.
(43) Horkans, J.; Shafer, M. J. Electrochem. Soc. 1977, 124, 1202.
(44) Tilley, S. D.; Cornuz, M.; Sivula, K.; Grätzel, M. Angew. Chem., Int. Ed. 2010, 122, 6549.
(45) Youngblood, W. J.; Lee, S.-H. A.; Kobayashi, Y.; Hernandez-Pagan, E. A.;
Hoertz, P. G.; Moore, T. A.; Moore, A. L.; Gust, D.; Mallouk, T. E. J. Am. Chem.
Soc. 2009, 131, 926.
(46) Tong, L.; Duan, L.; Xu, Y.; Privalov, T.; Sun, L. Angew. Chem., Int. Ed. 2011, 50, 445.
(47) Gorlin, Y.; Jaramillo, T. F. J. Am. Chem. Soc. 2010, 132, 13612.
(48) Wang, H.; Lee, H.-W.; Deng, Y.; Lu, Z.; Hsu, P.-C.; Liu, Y.; Lin, D.; Cui, Y. Nat.
Commun. 2015, 6.
(49) Luo, J.; Im, J.-H.; Mayer, M. T.; Schreier, M.; Nazeeruddin, M. K.; Park, N.-G.;
Tilley, S. D.; Fan, H. J.; Grätzel, M. Science 2014, 345, 1593.
(50) Kim, J.; Kim, J. S.; Baik, H.; Kang, K.; Lee, K. RSC Adv. 2016, 6, 26535.
(51) Lee, S. W.; Carlton, C.; Risch, M.; Surendranath, Y.; Chen, S.; Furutsuki, S.;
Yamada, A.; Nocera, D. G.; Shao-Horn, Y. J. Am. Chem. Soc. 2012, 134, 16959.
(52) Chemelewski, W. D.; Lee, H.-C.; Lin, J.-F.; Bard, A. J.; Mullins, C. B. J. Am.
Chem. Soc. 2014, 136, 2843.
(53) Park, J.; Kim, H.; Jin, K.; Lee, B. J.; Park, Y.-S.; Kim, H.; Park, I.; Yang, K. D.;
Jeong, H.-Y.; Kim, J. J. Am. Chem. Soc. 2014, 136, 4201.
(54) Friebel, D.; Louie, M. W.; Bajdich, M.; Sanwald, K. E.; Cai, Y.; Wise, A. M.;
Cheng, M.-J.; Sokaras, D.; Weng, T.-C.; Alonso-Mori, R. J. Am. Chem. Soc. 2015, 137, 1305.
(55) Song, F.; Hu, X. J. Am. Chem. Soc. 2014, 136, 16481.
(56) Dincă, M.; Surendranath, Y.; Nocera, D. G. Proc. Natl. Acad. Sci. U.S.A. 2010, 107, 10337.
(57) Gong, M.; Li, Y.; Wang, H.; Liang, Y.; Wu, J. Z.; Zhou, J.; Wang, J.; Regier, T.;
Wei, F.; Dai, H. J. Am. Chem. Soc. 2013, 135, 8452.
(58) Long, X.; Li, J.; Xiao, S.; Yan, K.; Wang, Z.; Chen, H.; Yang, S. Angew. Chem., Int. Ed. 2014, 126, 7714.
(59) Song, F.; Hu, X. Nat. Commun. 2014, 5.
(60) Ma, W.; Ma, R.; Wang, C.; Liang, J.; Liu, X.; Zhou, K.; Sasaki, T. ACS Nano 2015, 9, 1977.
(61) Liang, H.; Meng, F.; Cabán-Acevedo, M.; Li, L.; Forticaux, A.; Xiu, L.; Wang,
(62) Kanan, M. W.; Yano, J.; Surendranath, Y.; Dincă, M.; Yachandra, V. K.; Nocera, D. G. J. Am. Chem. Soc. 2010, 132, 13692.
(63) Bediako, D. K.; Lassalle-Kaiser, B.; Surendranath, Y.; Yano, J.; Yachandra, V.
K.; Nocera, D. G. J. Am. Chem. Soc. 2012, 134, 6801.
(64) Zaharieva, I.; Chernev, P.; Risch, M.; Klingan, K.; Kohlhoff, M.; Fischer, A.;
Dau, H. Energy Environ. Sci. 2012, 5, 7081.
(65) Robinson, D. M.; Go, Y. B.; Mui, M.; Gardner, G.; Zhang, Z.; Mastrogiovanni, D.; Garfunkel, E.; Li, J.; Greenblatt, M.; Dismukes, G. C. J. Am. Chem. Soc. 2013, 135, 3494.
(66) Grimaud, A.; Carlton, C. E.; Risch, M.; Hong, W. T.; May, K. J.; Shao-Horn, Y.
J. Phys. Chem. C 2013, 117, 25926.
(67) Stoerzinger, K. A.; Choi, W. S.; Jeen, H.; Lee, H. N.; Shao-Horn, Y. J. Phys.
Chem. Lett. 2015, 6, 487.
(68) Bediako, D. K.; Surendranath, Y.; Nocera, D. G. J. Am. Chem. Soc. 2013, 135, 3662.
(69) Surendranath, Y.; Kanan, M. W.; Nocera, D. G. J. Am. Chem. Soc. 2010, 132, 16501.
(70) Ullman, A. M.; Brodsky, C. N.; Li, N.; Zheng, S.-L.; Nocera, D. G. J. Am. Chem.
Soc. 2016, 138, 4229.
(71) Risch, M.; Klingan, K.; Ringleb, F.; Chernev, P.; Zaharieva, I.; Fischer, A.; Dau, H. ChemSusChem 2012, 5, 542.
(72) Farrow, C. L.; Bediako, D. K.; Surendranath, Y.; Nocera, D. G.; Billinge, S. J.
J. Am. Chem. Soc. 2013, 135, 6403.
(73) Jin, K.; Park, J.; Lee, J.; Yang, K. D.; Pradhan, G. K.; Sim, U.; Jeong, D.; Jang, H. L.; Park, S.; Kim, D. J. Am. Chem. Soc. 2014, 136, 7435.
(74) Kim, H.; Park, J.; Park, I.; Jin, K.; Jerng, S. E.; Kim, S. H.; Nam, K. T.; Kang, K. Nat. Commun. 2015, 6.
Anti-site reordering in LiFePO
4using charge carrier injection
(The content of this chapter has been published in Chemistry of Materilas. Reprinted with permission from [K.-Y Park and I. Park et al. Chem. Mater. 2014, 26 (18) pp.
3545-5351.]. Copyright (2014) American Chemical Society.)
2.1 Introduction
Defects in crystals are an important factor governing the intrinsic properties of materials, such as mechanical strength, electronic conductivity, and mass diffusion rates.1-3 While the concentration of defects in a crystal at a certain temperature and pressure is determined by thermodynamics,4-6 materials synthesized via non- equilibrium routes generally contain higher concentrations of defects. Careful choices of synthesis conditions or post-treatment methods are needed to control the level of defects and to tune the properties of materials.7-10 In conventional semiconductor systems, it is known that the type and concentration of defects determine the electronic properties of materials.11-13 Similarly, in ion mass-transfer systems, they critically affect kinetic properties.14-16
Defects in a crystal can impede ion transport by blocking diffusion pathways in one- (1-D) or two-dimensional (2-D) ionic conductors17-19 LiFePO4, an important material in batteries, is a good example of this. While it has been considered a promising electrode material20-22 due to its stability23,24 and relatively high energy
density,25,26 kinetic issues arising from the restrictive diffusion pathways for lithium ions and the low electronic conductivity have been problematic.27 In particular, lithium ions can diffuse only through a 1-D tunnel in the crystal. Thus, this diffusion is susceptible to the presence of defects that may block the tunnel.3 Since nano-sizing has been conducted widely for this material, the reduction in diffusion length can partly resolve the low-power problem. However, more importantly, nano-sizing is capable of reducing the detrimental effects of the defects blocking the channel. Malik et al. recently revealed that with 0.1% of Li-Fe site exchange in LiFePO4, ~45% of Li ions are trapped, statistically, between the defects in a 1-μm LiFePO4 particle.
However, this drops significantly, to ~5% in a 100-nm LiFePO4 particle.3 For these trapped lithium ions to participate in the battery reaction, they must diffuse through other unfavorable diffusion pathways that require higher activation barriers ( > 1 eV).
27-29
Important practical issue with nano-sized LiFePO4 that needs to be urgently addressed, nevertheless, is the low electrode tap density, which results in a significant reduction in the volumetric energy density. It is simply because the interactions between nanoparticles make it difficult for them to be packed densely. This issue is more serious for LiFePO4, the crystal density of which is only 3.6 g/cm3, which is substantially lower than those of commercial electrodes, such as LiCoO2 (5.1 g/cm3) and LiMn2O4 (4.2 g/cm3).30,31 Using nano-LiFePO4, in this regard, can hardly satisfy the requirements for batteries with high volumetric energy density. In this regards, it
capable of delivering satisfactory performance with reasonably high gravimetric/volumetric energy density. However, previous studies on large-size LiFePO4 particles have shown that the material delivers undesirably low specific capacity or power capabilities.3,32,33
The minimization of defects in micro-LiFePO4 can contribute to enhancing the transport properties because it reduces the possibility of blocking lithium diffusion tunnels. Since the blocking effect becomes more serious in larger particles, as noted, the control of anti-site defects becomes more critical in developing larger LiFePO4
particles having fast transport properties. Previous approaches to reducing defects in crystals have mainly used high temperatures, with post heat treatment to recombine defects.18 Here, we report a novel way to reduce anti-site (Li-Fe) defects in LiFePO4
electrochemically at room temperature. In this approach, we intentionally introduced a vacancy in the lithium channel by partial charging, and carried out a deep discharge below the conventional voltage cut-off. As a result, we observed significant FeLi- defect annihilation, resulting in defect-less LiFePO4 from a structural analysis.
Furthermore, the electrochemical performance could be enhanced markedly in the
‘healed’ sample. Density functional theory calculations suggest that FeLi-defect migration and annihilation could be facilitated by the introduction of vacancies near defects and the injection of excess electrons during over-discharge, which lowers the migration barrier for Fe defects.
2.2 Experimental
Hydrothermal synthesis of LiFePO4: LiFePO4 with a high concentration of defects was synthesized by a hydrothermal method. LiOH (Sigma Aldrich, 99.9%), FeSO4·7H2O (Sigma Aldrich, 99.8%), and H3PO4 (Sigma Aldrich, 85 wt% in water base) were used as precursors at a molar ratio of 3:1:1 in deionized water. The mixture was heated to 180°C in an autoclave and maintained for 2 h in an air atmosphere. The synthesized powder was filtered and then moved to a drying oven at 120°C for 24 h to remove water.
Solid-state synthesis of LiFePO4: The solid-state synthesis of LiFePO4 used precursors such as Li2CO3 (Sigma Aldrich, 99.9%), FeC2O4·H2O (Sigma Aldrich, 99%), NH3HPO4 (Aldrich, 98%), and pyromellitic acid hydrate (Fluka, 6 wt%, PA, 99%) as the organic additive. The powders were ball-milled in acetone for 14 h and dried at 70°C. The mixture was first calcined at 500°C in an Ar atmosphere for 10 h.
For additional carbon coating, 6 wt% of pyromellitic acid hydrate and 1 wt% of ferrocene (Aldrich, 98%) were mixed with the calcined powder using a ball-mill in acetone for 2 h. The acetone was then evaporated at 70°C in a drying oven. The dried mixture was pelletized under 200 kg cm–2 pressure in a disk-shaped mold, and then sintered again at 600°C under Ar for 10 h.
Synthesis of Li1-xFePO4: The prepared LiFePO4 powders and NO2BF4 powder were mixed in acetonitrile for 4 h at a molar ratio of 1:0.1 for chemical delithiation. After the drying process, partially de-lithiated powder was heated again to 380°C for 4 h
powders, pre-mixed with super P (22 wt%) in a ball mill for 24 h, and polyvinylidene fluoride (PVDF, 10 wt%) in N-methly-2-pyrrolidone (NMP). The mixture was cast on Al foil and dried at 120°C for 2 h. Electrochemical cells were assembled using a CR2016-type coin cell with lithium metal as the counter electrode, a separator (Celgard 2400), and 1 M LiPF6 in ethyl carbonate/dimethyl carbonate (Panax, EC/DMC, 1:1 v/v) as the electrolyte in an Ar-filled glove box.
First principles calculation method: First principle calculations were performed
using the Perdew–Burke–Ernzerhof exchange-correlation parameterization to density functional theory (DFT) with the spin-polarized generalized gradient approximation (GGA).34 A plane-wave basis set and the projector-augmented wave (PAW) method, as implemented in the Vienna ab initio simulation package (VASP), were used. Hubbard parameters (GGA+U) were added to correct the incomplete cancellation of the self-interaction of GGA.35,36 A U value of 4.3 eV (the on-site Coulomb term) and a J value of 1.0 eV (the exchange term) were used for the Fe atoms.37 To study the defect configuration in LixFePO4 (x = 1/16), we considered all possible orderings within the 1 × 2 × 2 supercell of LiFePO4 (112 atoms)generated with the CASM program, which contains defects of one Li in the M2 site, one Fe in the M1 site, and one vacancy in the M1 site.38 All plausible configurations of Li-Fe cation site-exchange and a Li-vacancy within the 16-formula unit were considered.
Activation energies for the ionic diffusion were calculated using the nudged-elastic- band (NEB) method.39 Appropriate replicate systems were used as starting points for
the NEB method, with linear interpolation between the initial and final states of the diffusion pathways.
Characterization: High-resolution powder diffraction patterns were recorded using
synchrotron X-ray radiation (the 8C2-HRPD beam-line at the Pohang Accelerator Laboratory, Korea). The incident X-rays were collimated using a mirror and monochromatized to a wavelength of ~1.5495 Å using a Si (111) mono-chromator.
The diffraction data were collected in the 10 to 130° range with a step size of 0.01°.
Rietveld refinement of the HRPD results was conducted using the “Fullprof”
program.40 The size and morphology of the powders were observed using field emission scanning electron microscopy (FE-SEM, Philips, XL 30 FEG).
2.3 Results and Discussion
In perfect olivine LiFePO4, all Li and Fe ions occupy M1 and M2 octahedral sites, respectively. However, Li/Fe cation site exchange may lead to Li ions in M2 sites and Fe ions in M1 sites.20,41 This type of cation disorder can be an edge-shared Li/Fe defect or a corner-shared Li/Fe defect, as shown in Figure 2-1.17,41 Calculation of the defect formation energies indicates that both defects are comparable in energy, but the edge-shared Li/Fe defect (~390 meV) is slightly more probable than the corner- shared one (~490 meV), consistent with previous observations.17 It has also been noted that the defect formation energy tends to decrease as the FeLi – LiFe distance decreases among the types of anti-site. This indicates that an effectively attractive interaction does exist between FeLi and LiFe defects (see the formation energies for various defect types in Figure 2-1). Generally, it is known that these types of Li/Fe site exchange do not recombine during charging/discharging process or at room temperature due to the relatively high activation energy for recombination.41
The types of stable anti-site configurations differ with the introduction of a lithium vacancy, i.e., Li1–xFePO4. DFT calculations on various anti-site configurations showed that the corner-shared Li/Fe defect becomes more probable in Li-deficient olivine, even though both corner-shared (Figure 2-2a) and edge- shared (Figure 2-2b) Li/Fe defects are comparably stable. However, it has been noted that all the stable anti-site configurations contain the vacancy as the first nearest neighbor to the Fe defect at the M1 octahedral site along the b-direction. It is believed that the relatively high valent Fe3+ exhibits stronger electrostatic repulsion, and thus
prefers a vacancy to Li+ as its neighbor. As a consequence of the reduction in the electrostatic repulsion, the defect formation energy becomes lower in Li1–xFePO4
(~100 to 200 meV) than in LiFePO4 (~400 to 500 meV; Figure 2-2). Furthermore, defect formation is energetically more stable than the defect-free Li15/16FePO4 phase (dotted line in Figure 2-2). This suggests that a meta-stable Li15/16FePO4 phase, if any, is likely to contain appreciable amounts of Li/Fe site exchange, although the most stable state is the two-phase coexistence of LiFePO4 and FePO4.
Close examination of the stable anti-site configurations revealed that the major defect type (corner-shared defect, Figure 2-1a) has a plausible re-ordering route. In the possible route, shown in Figure 2-3, Li migrates to the vacant M1 site (inset 1, 2), then Fe moves sequentially to the M2 site (inset 3, 4), annihilating the defect. To assess this possible defect recombination, we calculated the activation energy following the hypothetical migration path using NEB calculations. Figure 2-3 illustrates the energy profile along the recombination path. The recombination involved a relatively high activation energy of ~1.4 eV. When the lithium ion diffuses from M2 to the vacant M1 site, the system becomes destabilized gradually by ~1 eV (inset 2 of Figure 2-3) and iron migration carries an additional ~400 meV barrier (inset 3 of Figure 2-3). The high activation barrier of ~1.4 eV is attributable to the strong electrostatic repulsion among cations during the migration, and implies that the recombination of the defect in such conditions is unlikely to occur at room temperature.28,29 However, we found that a slight reduction of the system can
electrons into the system, Fe3+ in the M2 site becomes reduced locally to Fe2+, leading to a decrease in the activation barrier of iron migration from ~1.4 eV to ~0.8 eV. Considering that the activation barriers in many operable electrodes at room temperature range within several hundreds meV,12,28,41 this indicates that recombination of the defect at room temperature is quite plausible in this case. While the injection of excess charge into the system is purely artificial in the calculations, we suggest that it can occur in the dynamic circumstances of charging or discharging of the electrode in electrochemical systems. A local charge imbalance due to the differing mobilities of the cation (Li ion) and electron during discharge can also induce such a situation. However, the second major defect type, the edge-shared defect (Figure 2-2b), does not have an apparent re-ordering route, indicating that an edge-shared defect would not recombine and would remain, even with this healing process, which we will discuss further below.
Figure 2-1. Calculated formation energy of anti-site defect in LiFePO4 and its configuration corresponding to the distance between Li+ on Fe2+ site and Fe2+ on Li+ site. Near anti-site defect has lower formation energy. (a) Edge-shared anti-site defect with the lowest formation energy (about 390 meV) (b), (c) Corner-shared anti- site defect with the formation energy of about 490 meV.
Figure 2-2. Formation energies for 45 different vacancy-Fe defect configurations of the single-phase Li1-xFePO4 from first principles calculations. The most stable energy is observed in (a) the corner-shared configuration and the second most stable configurations is shown as (b) the edge-shared configuration.