저작자표시-비영리-변경금지 2.0 대한민국 이용자는 아래의 조건을 따르는 경우에 한하여 자유롭게
l 이 저작물을 복제, 배포, 전송, 전시, 공연 및 방송할 수 있습니다. 다음과 같은 조건을 따라야 합니다:
l 귀하는, 이 저작물의 재이용이나 배포의 경우, 이 저작물에 적용된 이용허락조건 을 명확하게 나타내어야 합니다.
l 저작권자로부터 별도의 허가를 받으면 이러한 조건들은 적용되지 않습니다.
저작권법에 따른 이용자의 권리는 위의 내용에 의하여 영향을 받지 않습니다. 이것은 이용허락규약(Legal Code)을 이해하기 쉽게 요약한 것입니다.
Disclaimer
저작자표시. 귀하는 원저작자를 표시하여야 합니다.
비영리. 귀하는 이 저작물을 영리 목적으로 이용할 수 없습니다.
변경금지. 귀하는 이 저작물을 개작, 변형 또는 가공할 수 없습니다.
이학석사학위논문
Typhoon track and extra-tropical transition as the decisive factors for the risk
distribution in South Korea
우리나라에서 태풍 진로와 온대저기압화가 피해 분포의 결정에 끼치는 영향 연구
2017년 2월
서울대학교 대학원
지구환경과학부
남 채 현
Thesis for a Master of Science degree
Abstract
Typhoon track and extra-tropical transition as the decisive factors for the risk
distribution in South Korea
Chaehyeon Chelsea Nam Atmospheric Science Program School of Earth and Environmental Sciences The Graduate School of Seoul National University
The present thesis aims to probe the priority structure in the tropical cyclone (TC) risk realization process in South Korea. So far, most TC risk research and real-time forecasts have been focusing on TC wind intensity. However, our results show that TC track and extra-tropical transition information is more important than TC intensity, to decide whether the TC risk to be activated as a catastrophe or to stay in the potential status. First, weak TCs (WTCs, maximum wind speed <17 m s–1), which is even ignored in the TC warning system of Korean Meteorological Agency for its weak intensity, appeared more damaging than strong TCs (STCs, >17 m s–1)
for western provinces. WTCs have significantly different tracks and landfall locations compared to STCs, so that western provinces of South Korea suffers more from WTCs than from STCs. Secondly, decision tree analysis revealed that track patterns and extra-tropical transition experiences are the most efficient attributes to predict damage occurrences among all the risk elements including maximum wind speed. In other words, the most distinctive differences that divide damaged and non-damaged TCs were 1) for STCs, if the STC is west-approaching or east-approaching to South Korea, and 2) for WTCs, whether the WTC experiences extra-tropical transition around the Korean Peninsula or not. In sum, our findings highlight the discrepancy between dormant hazards of a TC (e.g.
central wind intensity) and local effective hazards (e.g. rainfall) that residents in different areas actually experience. Based on these findings, we suggest that TC warnings should more focus on its local impacts than its central wind intensity, and this requires an accurate TC track forecast and extra-tropical transition prediction most of all.
Keywords : tropical cyclone, typhoon, risk, hazard, South Korea, track, extra- tropical transition
Student Number:2015-20464
Table of Contents
Abstract...i
Table of Contents ... iii
List of Figures ...iv
List of Tables...vi
1. Introduction...1
2. Data and method...5
2.1. Data...5
2.2. Selection of TCs...9
2.3. Statistical analysis...12
3. Highlighting weak TC risk compared to strong TC risk...16
3.1. Damage comparison between weak TC and strong TC...16
3.2. Climate environment comparison between weak TC and strong TC...22
4. Priority structure of TC risk realization process...32
4.1. Extra-tropical transition in weak TC risk realization process...36
4.2. Track pattern in strong TC risk realization process ...42
5. Summary and discussion...68
Reference ...71
국문 초록...78
List of Figures
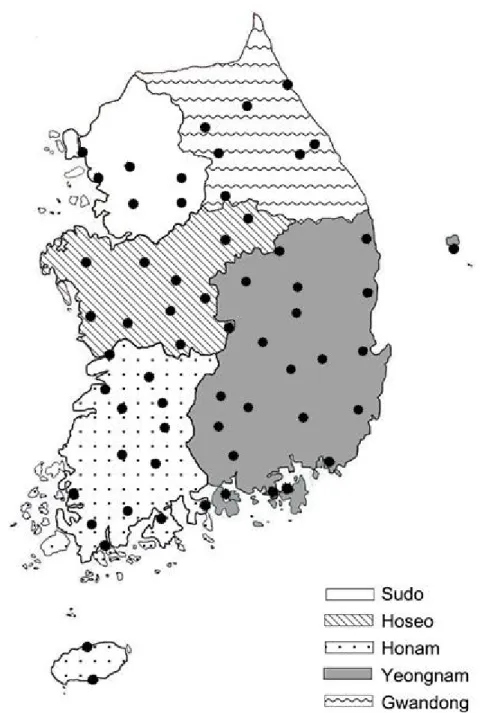
Figure 1.Five classified areas of the Republic of Korea. Dots indicate locations of 60 weather stations recording wind and rainfall.
Figure 2. Boxplots of a near-surface wind and b rainfall caused by weak tropical cyclones (WTCs) and strong tropical cyclones (STCs), classified further into the damaged and non-damaged.
Figure 3.Averages and differences in the number of homelessness, casualties, and property loss caused by weak tropical cyclones (WTCs) and strong tropical cyclones (STCs) for the five areas.
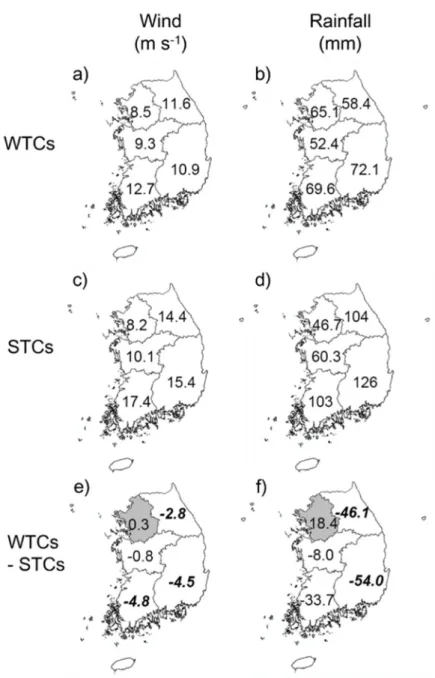
Figure 4. Same as Figure 3 for near-surface wind and rainfall caused by weak tropical cyclones (WTCs) and strong tropical cyclones (STCs).
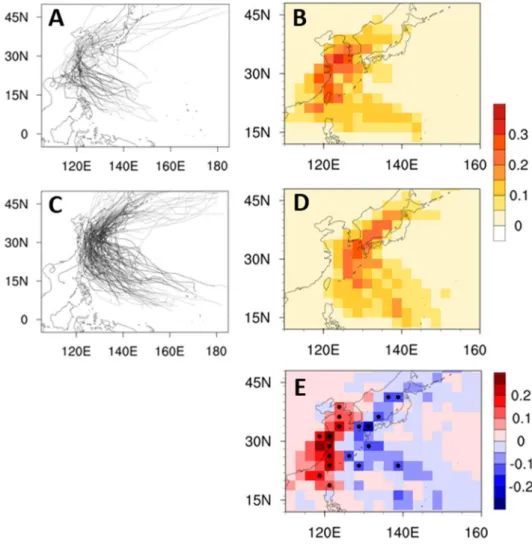
Figure 5.Track comparison between weak tropical cyclones (WTCs) and strong tropical cyclones (STCs). (A) WTC tracks, (B) average track density of one WTC, (C) STC tracks, (D) average track density of one STC, (E) track density differnces (WTC minus STC).
Figure 6.Time series of the number of Weak TC and Strong TC landfall cases over South Korea.
Figure 7.500hPa geopotential height anomaly and steering flow (1000 to 200hPa, pressure weight mean) for a) WTC-frequent years and b) STC-frequent years.
Light (dark) shading indicates significant at 90% (95%) confidence level.
Figure 8. Comparison of the lifetime intensity and track for damaged and non- damaged cases of STCs.
Figure 9.Same as Figure 8 for WTCs.
Figure 10. Four clusters of tropical cyclone tracks that made landfall to South Korea for 1979–2010.
Figure 11. Boxplots of the for track-pattern clusters’ hazards and damages. (a) Maximum wind speed, (b) central pressure, and (c) storm size from RSMC best track data. The storm size is the longest radius of 30 knot winds or greater. (d) Daily max wind speed (10 minute averaged), (e) daily accumulated precipitation, (f) influenced period from 60 weather stations over the nation, and (g) property losses.
Figure 12. Three hazard parameters of wind, precipitation, and duration of tropical cyclones in each cluster (Cluster 1 to 4) observed in 60 stations during the center of each tropical cyclone was within 5-degree distance from South Korea.
Figure 13. The medians of regional economic losses from a tropical cyclone (regional economic losses divided by regional wealth).
Figure 14. Decision tree model for damage occurrence using the four TC best- track attributes (maximum wind speed, central pressure, storm size, and track- cluster) and province information as input variables.
Figure 15.Same as Figure 14 except using two in-situ observation input variables, rainfall and surface wind, not TC best-track variables (intensity, size and track).
Figure 16.Flowchart for local risk materialization process with TC risk elements and their relationship.
List of Tables
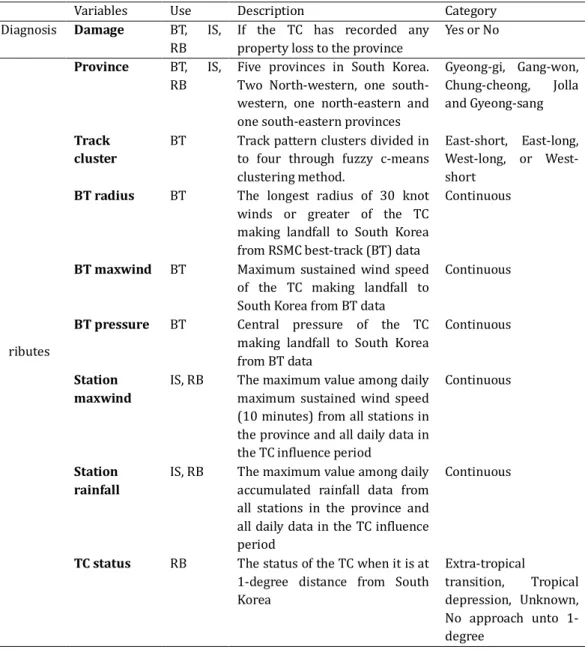
Table 1. Description of decision tree model variables – the diagnosis (target) variable and attribute (input) variables.
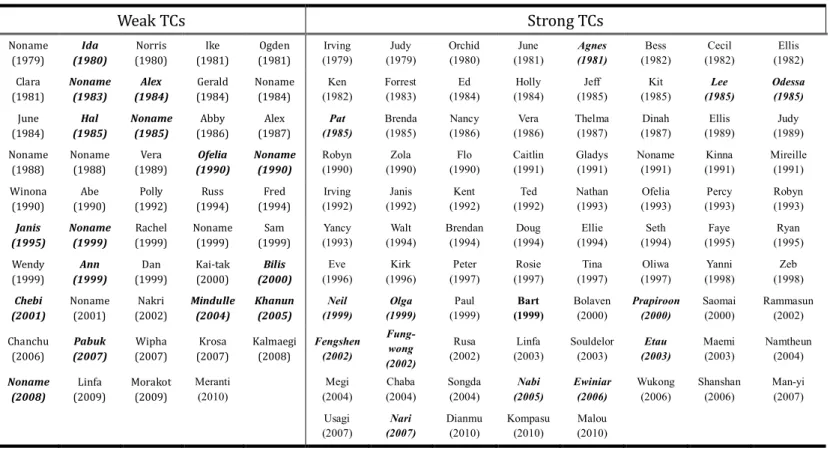
Table 2. List of weak tropical cyclones (WTCs) and strong tropical cyclones (STCs) affecting the Republic of Korea. Parentheses indicate the years of occurrence.
Table 3. Correlation coefficients between damages (the number of people who lost their homes (homelessness), casualties, and property loss) and wind, and between damages and rainfall, caused by weak tropical cyclones (WTCs) and strong tropical cyclones (STCs).
Table 4.Association analysis result confidence values for extra-tropical transition as a Weak TC approaching to Korean coastline.
Table 5. Rule-set model for Weak TC damage occurrence.
Table 6. Statistical measures of the performance of rule-based classifier for Weak TCs.
Table 7.The list of the clustered Strong TCs that made landfall to South Korea for 1979 – 2010.
Table 8. Each Pearson correlation of property losses with maximum daily wind speed, maximum daily precipitation, and sum of influenced periods of all 60 weather stations and maximum wind speed, central pressure, and storm radius (30 knot) of RSMC best-track data by each track cluster.
Table 9. Damage record availability by track-pattern clusters and provinces.
Unavailable damage records are cases that have influence duration longer than five days or overlap of more than two TCs in the period.
Table 10.Statistical measures of the performance of TC best-track based decision tree for Strong TCs.
Table 11.Same as Table 10 of in-situ observation based decision tree for Strong TCs
1. Introduction
Tropical cyclone (TC) is among the biggest concerns for disaster management since TC is the most costly natural disaster as a single natural hazard worldwide (http://emdat.be). Many researchers have tried to understand and predict TC activity and associated risk. In TC risk studies, the risk triangle concept, which describes risk as comprising three major elements (i.e., hazard, exposure, and vulnerability), is widely adopted (Peduzzi et al. 2012, Mendelsohn et al. 2012).
To estimate the risk quantitatively, actual damage is used as a response variable in an empirical statistical model (Pielke et al. 2008, Park et al. 2015), although damage is more likely a materialization of risk in the strictest sense (Cardona et al.
2012). The three risk elements are often used as explanatory variables. Exposure and vulnerability are usually expressed by the number of residents and regional gross domestic product (GDP) in the area of interest, respectively (Pielke et al.
2008). Hazard is typically represented by a TC-based hazard parameter, such as central pressure, maximum wind speed, or TC size (Pielke et al. 2008, Nordhaus 2010, Hsiang and Narita 2012, Czajkowski and Done 2014, Zhai and Jiang 2014).
Using TC-based hazard parameters, however, is insufficient for estimating TC damage since TC-based hazards are more like potential hazards rather than effective hazards. Several different modes of hazards are recognized. Most hazards are ‘dormant’ or ‘potential,’ simply posing a level of threat to life, property, and/or environment, but once a hazard turns ‘active,’ it becomes an incident/emergency
(MacCollum 2007). With this classification, TC-based hazards, which indicate the intensity of a TC regardless of the possibility of actual impact occurrence, are labeled as ‘dormant’ or ‘potential’ mode if the TC is in a position of approaching a settlement. Meanwhile, ‘active’ hazards that are driven by a TC can be listed as rainfall, wind gusts, wind waves, and storm surges, all of which are localized and directly affect residents. Following their definitions, active hazards should be more closely correlated with damage than potential hazards. In addition, using active hazards for risk estimation is advantageous in that active hazards, like the damage caused, are localized. In comparison, TC-based hazards indicate only representative intensity of a TC, found in a limited area near its center. Donat et al.
(2011) showed that the consideration of locality for storm winds could yield much higher accuracy in risk models.
The realization of potential hazards of a TC into active hazards seems to be largely dependent on the TC track. In other words, track has a key role in determining 1) whether the potential hazard of a TC will become active for a given settlement and 2) in how intense the activated hazard would be. Record-breaking rainfall in Gangneung city, South Korea was recorded, because the track of Typhoon Rusa (2002) was optimal to strengthen the orographic effect on precipitation over the region (Park and Lee 2007). Also, the deadliest damage by typhoon Haiyan (2013) in the Philippines was mainly because the TC penetrated Tacloban city, which is located in a low-lying area near the ocean, such that most of the damage arose from storm surge (Ching et al. 2015). In both cases, if the TCs
went through a different area, avoiding the mountains and lowland, respectively, the result could have been much less devastating.
We suggest that more attention should be put on track in TC risk analysis.
One may argue that if tracks are taken into account within a risk framework, they will overlap with the concept of exposure. This rebuttal can arise from the fact that both parameters indicate the possibility of actual influence by a TC. However, exposure refers to population and wealth at a certain fixed point. Track determines active hazards, i.e., how much local wind and rainfall at a fixed point will be caused by a TC with a given track. Track, however, cannot change exposure at a given point. The present study statistically evaluates priority among track, TC- based hazards, and exposure/vulnerability with respect to the realization of TC risk for a given society.
In our TC risk analysis, not only strong TCs (STCs, maximum wind speeds of the best-track data ≥ 17 m s–1), but also relatively weak TCs (WTCs, maximum wind speeds of the best-track data < 17 m s–1) are included. The Korean Meteorological Administration (KMA) does not issue the Typhoon Warning for WTCs, regarding them as not damaging as STCs. However, it has never been clarified if WTCs are really less damaging than STCs. Moreover, maximum wind speeds of WTCs generally are not recorded by the best-track dataset even if they are as strong as STCs. This is because many of WTCs are transformed into extra- tropical lows which are not monitored by the best-track dataset. WTCs can re- intensify under a certain environmental condition, such as the existence of upper-
level trough and high surface baroclinity (Klein 2001; Jones et al. 2003; Hart et al.
2006). About 45% of TCs undergo the extra-tropical transition often characterized by fast translational speed and rapid re-intensification (Jones et al. 2003). The re- intensified WTCs may accompany multiple severe phenomena, such as gust, downpour, storm surge, and wind wave, like STCs. For example, about 0.5 million homelessness, 4 hundred casualties, and 0.8 trillion Korean Won (KRW, 1,000 KRW ≈ 1 USD) of property losses in September 1984 were led by Typhoon June although it weakened into WTCs in advance of influencing on Korea.
Thus, prior to risk process analysis of WTCs and STCs, this thesis examined three major damage types¾number of homelessness, number of casualties, and amount of property loss¾resulting from WTCs and STCs in each province to directly compare the actual destructiveness of WTCs with STCs’. In addition, their wind and rainfall intensities are also compared to each other. Rest of this paper is organized as follows. The data and methods used are described in section 2. The comparison of socio-economic losses and wind/rainfall intensities by WTCs and STCs are shown in section 3. Priority structure in both of WTC and STC risk realization is analyzed in Section 4. Finally, summary and discussion are given in section 5.
2. Data and Method
2.1 Data
We conducted risk comparison analysis for the WTCs and STCs in terms of three risk components - hazards, exposures, and damages. In this study, we view risk as the product of interaction of a potentially damaging event and the vulnerable conditions of a society or element exposed in accordance with the disaster risk research community (e.g. UNISDR 2004, IPCC 2007, and Cardona et al. 2012). In pseudo-mathmatical form, risk as the probability of a loss, can be expressed as (e.g. Granger et al. 1999, Crichton, 1999):
= × ×
If any of the three elements, hazards, exposure and vulnerability, in risk increases/decrease, then risk increases/decreases repectively. In our study, we see TC damage as the materialization of TC risk on the basis of the notion TC risk is the possibility (in other words, latent condition before realization) of TC damage. Thus we used TC damage data for quantative assessment of the total risk.
Hazard parameters are defined as meteorological properties that can indicate the potential destructiveness of the TC to the society. Exposure is represented with regional wealth, which means how much wealth in the region potentially are exposed to TC risk. For vulnerability, we have not evaluateed it independently from other instinctive factors in damage data.
Now we explain how we have estimated each risk element more specifically. Damage data are collected from the National Disaster Information Center (NDIC) of Korean government (http://www.safekorea.go.kr) dataset, and used after some processing. NDIC property loss data consist of monetary damages of industrial, public, and private facilities standardized to the value of money in 2005, taking account of inflation. The loss data is collected by local governmental offices so that most of losses can be collected regardless of insured and uninsured, yet there can be some light losses not reported to the local offices by the victims.
The raw dataset includes loss data caused by all types of extreme weather such as TC, heavy rainfall, heavy snowfall, high waves. Some cases are not classified into specific damage sources, and some cases are stated as high wave damage, which is in fact due to a TC. Therefore, we matched the loss data to each Korea affecting TC comparing the period of damage in the NDIC dataset with the influence period in the White Book and the period a TC stays within 3° from the Korean coastline. If any day of NDIC damage period overlaps with a TC’s RSMC or White Book influence period, a loss is attributed to the TC. Then, to confine the origin of the loss data to one TC, we have excluded the cases whose damage period exceed five days from landfall, as NDIC usually aggregates the damage amounts and periods for multiple successive extreme phenomena.
The TCs’ hazard parameters are obtained from two different data sources.
From the Regional Specialized Meteorological Center (RSMC) best track data, the intensity and storm size values are gathered. For intensity, we use the maximum
wind speed and central pressure data. For storm size, the longest radius of 30 knot winds or greater storm radius data. The 6-hourly interval of RSMC is interpolated into a 1-hour interval to get a precise hazard values at landfall (Park et al. 2011, 2014). Best-track intensity information (both maximum wind speed and central pressure) are the values very concentrated on the center of a TC. Thus best-track data is not sufficient to signify TC inland impacts, and so we have utilized weather station observations too. From 60 weather station data over South Korea, near-surface wind speed and rainfall intensity are gained. The influence duration of each station is also calculated, applying a method of Park et al (2015), by counting the number of days whose daily accumulated rainfall or the daily maximum sustained wind speed exceeded the station’s critical thresholds, which we set as each station’s 90th percentiles. Here the range of duration is limited by the summation of three relevant periods; 1) the period of warning indicated in NTC White Book, 2) the days that TC stayed within 3 degree distance from the Korean coastline based on RSMC dataset and 3) the period of damage in the NDIC dataset.
For exposure, we used province-level aggregated population and wealth data obtained from government statistical surveys (Korean Statistical Information Service, http://kosis.kr/). We analyze exposure dividing into two different dimensions – time and space. First, temporal variation of exposure is considered through normalization of damage data to the reference year of 2005 with wealth per capita following Park et al. (2015 and 2016). In general, wealth of South Korea
has consistently increased and its population is now decreasing. However, there are significant differences in the growth rates of among provinces (See Figure 2 in Park et al (2015)), which would affect TC damage records of provinces. By normalization, this possble impact of regional differences in population/wealth trend can be eliminated. The spatial disparity of exposure at a certain time, i.e.
2005, should be addressed as well. Therefore, we have introduced the regional wealth distribution at 2005 when mapping the damage distribution.
The normalized damages in terms of homelessness, casualties, and property losses caused by the i-th TC are calculated by the following equations.
, , = , , × , , ,
, , = , , × ,
, ,
, , = , , × ( , ×
, × , (1) where Ai,2005,r, Ci,2005,r, and Di,2005,r are the normalized damages in terms of homelessness, casualties, and property losses, respectively, for province, r. Ai,y,r, Ci,y,r, and Di,y,rindicate the actual damages in province rand year y. Py,rand P2005,r
are the population in province rand year yand 2005, respectively. Wyand W2005
represent the wealth per capita in year yand 2005, respectively.
2.2 Selection of TCs
The Typhoon White Book issued by the NTC (NTC 2011) is used to get the list of the TCs that have affected Korea. The Typhoon White Book, that is the official record of TC activity of KMA, defines the influencing TC as a TC whose center is located in the domain of 32°N–40°N and 120°E–138°E with high probability of occurrence of damages on the country. The TC list in the White Book is the most trustworthy compared to other statistical ways for selecting influencing TCs (e.g., Kim et al. 2006; Park et al. 2006) since the list is made by comprehensive consideration of various data available at that time (Kwon and Rhyu 2011). However, the possibility if the TC can make impact or not is determined by weathermen, so it can be subjective. Several WTCs and STCs passing in the vicinity of the country but not predicted to damage Korea at the time of their influence, might have been missed in the list. Moreover, the White Book does not offer the detailed geographical locations and the maximum wind speeds of individual TCs.
To fill these gaps, the TC dataset from the International Best Track Archive for Climate Stewardship (IBTrACS) is also utilized (Knapp et al. 2010).
The IBTrACS dataset has the longest track information and is least likely to miss any TCs since it is made by combining most of available TC best-track datasets from various meteorological agencies (Knapp et al. 2010). Hence, in addition to the TC list in the White Book, several TCs entering the influential area are added
from the IBTrACS dataset into our TC list for analyses. In the authors’ previous study (Park et al. 2015), for the definition of influential area, the line of 5° apart from the coastline was utilized. However, the old definition can include TCs which hardly affected Korea. Therefore, the line of 3° apart from the coast of Korea is newly defined as the influential area although it can miss sizable TCs far from the coast but possibly damaging the country. The TCs missed due to the shrinking influential area defined appear to be complemented by the TC list from the White Book. Meanwhile, prior to the addition of TCs, because the TC information of the IBTrACS is provided at a 6-hour interval which is too coarse to get a precise influential period of TC over Korea, the 6-hourly interval is interpolated into an 1- hour interval (Park et al. 2011, 2014). Based on the 10-minute sustained maximum wind speed from the IBTrACS, TCs are grouped in two types, WTC and STC; a WTC (STC) is defined as a TC with the maximum wind speeds less than (greater than or equal to) 17 m s–1at the time in which the TC firstly goes into the influential area on Korea. The eight TCs which did not enter the influential area but reported in the White Book are classified based on the maximum wind speeds at the time of their closest approach to the Korean coastline.
Figure 1. Five classified areas of the Republic of Korea. Dots indicate locations of 60 weather stations recording wind and rainfall.
2.3 Statistical analysis
The probability distributions of all three types of damages represent strongly skewed distributions toward zero. That is, the damage distributions do not follow the normal distribution so that typical parametric methods to examine statistical significances like the Student’s t-test cannot be applied (Mankiewicz 2004). Hence, all of the significance tests are done by non-parametric ways, which do not assume any probability distributions. The Mann-Whitney U test is used to test significances of differences between two samples (Hollander and Wolfe 1999).
The Mann-Whitney U test is as follows.
= + ( + 1)
2 −
= min( , ), (2) where and are the sample sizes of sample 1 and 2, respectively. is the rank sum of sample m (i.e. 1 or 2). value represented by (2) is compared with a given critical value of ( ) at a given significance level (e.g., 0.05) in the Mann-Whitney Table. If < , the difference is significant. On the other hand, the Spearman’s rank correlation analysis is utilized to get correlation coefficients between damages and intensity parameters (Daniel 1990). The Spearman’s rank correlation analysis is as follows.
= 1 − 6 ∑ ( − 1) (3)
where is the difference between the ranks of corresponding values of each
sample. is the sample size. The statistical significance of the Spearman’s correlation can be determined by the Spearman’s rank correlation table.
Kruskal-Wallis test, in other words one-way Analysis of variance (ANOVA) on ranks, is used to determine if there are statistically significant differences of a variable between track-clusters.
In total, 85 STCs are sorted out to be influential in South Korea over the period from 1979 to 2010. The 85 influential TCs are then clustered according to their track patterns by using the fuzzy c-means clustering method (FCM). The FCM is widely used for classifying the widespread data with amorphous boundaries.
Some previous studies have shown this method to be effective for clustering TC track patterns (e.g. Kim et al. 2011). We have clustered the track patterns, not for the whole tracks from genesis to disappearance, but for the part of the tracks in the domain of 28°N–40°N and 120°E–138°E so that we can divide tracks focusing on the paths near South Korea, whose national TC risk distribution is examined with these clustered track patterns. The TCs are clustered into four. The optimum cluster number was decided by five validity measures - partition coefficient, partition index, separation index, Xie and Beni index and Dunn index (Kim et al.
2011), and the number of four appeared to be the optimum in our case. The indexes have still pointed at four as the optimum number of clusters even we add slight differences on TC lists such as different time window (e.g. 1979 – 2014) or different clustering domain (e.g. 5-degree area from the Korean Peninsula coastline).
We further introduced the decision tree analysis to decompose the relationships among risk elements. The decision tree method, a multi-variable technique, allowed us to explain, describe, classify, or predict a target as a result of the combined effects of multiple input variables beyond a one-cause and one- effect relationship. Compared to other multi-variable techniques, the decision tree method has its own advantage in that it is easy to use, robust with a variety of data, and most of all, intuitively interpretable. It helps decision analysts to structure the decision process in a graphical sequence.
Among several famous decision tree algorithms, this study applied See5/C5.0 as a classification method for TC risk materialization. The See5/C5.0 algorithm is an improved version of C4.5 (34) in terms of accuracy, speed, and computer memory consumption. Also, C4.5 algorithm is advantageous because it can accommodate all of the class, binary, and continuous variable types that we needed (See Table 1). See5/C5.0 calculates the information gain at each node based on the entropy concept in order to choose the most efficient attribute for splitting the training samples into two branches.
To prevent over-fitting, we introduced pruning and cross-validation. First, we required that branches have a sample size of at least five. The number five was determined through retrospective pruning process. Second, a ten-fold cross- validation was conducted, and we checked that the decision tree results (e.g., model accuracy, tree size, or attribute usage) are stable and consistent given the
ten different cross-validation sets.
Table 1. Description of decision tree model variables – the diagnosis (target) variable and attribute (input) variables. Use column indicates the decision trees that use each variable; best-track based model (BT) and in-situ observation based model (IS) for strong TCs and rule-based classifier model (RB) for weakened TCs.
Variables Use Description Category
Diagnosis Damage BT, IS, RB
If the TC has recorded any property loss to the province
Yes or No
ributes
Province BT, IS, RB
Five provinces in South Korea.
Two North-western, one south- western, one north-eastern and one south-eastern provinces
Gyeong-gi, Gang-won, Chung-cheong, Jolla and Gyeong-sang Track
cluster
BT Track pattern clusters divided in to four through fuzzy c-means clustering method.
East-short, East-long, West-long, or West- short
BT radius BT The longest radius of 30 knot winds or greater of the TC making landfall to South Korea from RSMC best-track (BT) data
Continuous
BT maxwind BT Maximum sustained wind speed of the TC making landfall to South Korea from BT data
Continuous
BT pressure BT Central pressure of the TC making landfall to South Korea from BT data
Continuous
Station maxwind
IS, RB The maximum value among daily maximum sustained wind speed (10 minutes) from all stations in the province and all daily data in the TC influence period
Continuous
Station rainfall
IS, RB The maximum value among daily accumulated rainfall data from all stations in the province and all daily data in the TC influence period
Continuous
TC status RB The status of the TC when it is at 1-degree distance from South Korea
Extra-tropical
transition, Tropical depression, Unknown, No approach unto 1- degree
3. Highlighting weak TC risk compared to strong TC risk
3.1 Damage comparison between Weak TC and Strong TC
In 1979–2010, 49 WTCs and 85 STCs have affected Korea. For each year the country almost always has wet seasons, in which steady heavy rainfall occurs (the Changma rainy season) from June to early August (Ho et al. 2003; Ha et al.
2005). Hence, TCs influencing Korea are often coincided with the Changma and its damages can be overestimated by combined effects of TC and Changma. 16 WTCs and 12 STCs have damage periods longer than five days, and the cases possibly accompanied with the Changma. On the other hand, two STCs’ damage period is shorter than five days, but they are successive TC cases having indistinguishable damage records. Thus, total 16 WTCs and 14 STCs are screened so that 33 WTCs and 71 STCs are included in all analyses hereafter. Not surprisingly, the TC cases excluded from the analysis generally caused enormous damages; the median of each damage type by the excluded TCs is 1,935 homelessness, 25 casualties, and 0.14-trillion-KRW property losses. According to the TCs analyzed, approximately 45% of the WTCs caused damage somewhere in the country. On the other hand, approximately 70% of STCs incurred damage, indicating that there is more likelihood of damage occurrence by STCs than WTCs. All WTCs and STCs are listed in Table 2.
As discussed above, the skewed probability distributions particularly come from a lot of zeros, indicating that there are many non-damaged cases.
About 55% and 30% of WTCs and STCs that have affected Korea do not have any records on losses in the NDIC dataset, respectively. It is necessary to check if the zeros are actual signals or just due to missing of the NDIC. Thus, the wind and rainfall intensities for damaged and non-damaged cases are calculated and compared to each other (Figure 2). For both WTCs and STCs, wind and rainfall intensities of the non-damaged cases are significantly weaker than those of the damaged cases. In other words, the intensities for the non-damaged cases are not strong enough to cause any damages. Meanwhile, the average wind in the damaged cases of STCs is significantly larger than that of WTCs while average rainfalls for damaged cases of STCs and WTCs are similar each other.
The discrepancy of wind intensities between WTCs and STCs is because STCs have inherently stronger wind due to their definitions (maximum wind speed of the best-track data ³17 m s-1). In contrast, this discrepancy in wind intensities is not found for non-damaged cases. The mean wind and rainfall intensities of non- damaged cases, about 10 m s–1and 39 mm, respectively, are almost same between WTCs’ and STCs’, meaning that the values 10 m s–1and 39 mm can be regarded as the reference values at which damages do not occur. This implies that there may be critical intensities somewhere near the reference values of the non-damaged cases, to determine if a TC including both WTC and STC is non-damaged or damaged.
Figure 2. Boxplots of a near-surface wind and b rainfall caused by weak tropical cyclones (WTCs) and strong tropical cyclones (STCs), classified further into the damaged and non-damaged. Boxes are for quantiles. Circles on the boxes indicate average values. Dots shown outside of the boxes are all the data whose values are smaller than 1-quantile or larger than 3-quantile.
Table 2. List of weak tropical cyclones (WTCs) and strong tropical cyclones (STCs) affecting the Republic of Korea.
Parentheses indicate the years of occurrence. Bold italic represent the TCs damaged longer than 5 days or affecting the country with successive TCs.
Weak TCs Strong TCs
Noname (1979)
Ida (1980)
Norris (1980)
Ike (1981)
Ogden (1981)
Irving (1979)
Judy (1979)
Orchid (1980)
June (1981)
Agnes (1981)
Bess (1982)
Cecil (1982)
Ellis (1982) Clara
(1981)
Noname (1983)
Alex (1984)
Gerald (1984)
Noname (1984)
Ken (1982)
Forrest (1983)
Ed (1984)
Holly (1984)
Jeff (1985)
Kit (1985)
Lee (1985)
Odessa (1985) June
(1984)
Hal (1985)
Noname (1985)
Abby (1986)
Alex (1987)
Pat (1985)
Brenda (1985)
Nancy (1986)
Vera (1986)
Thelma (1987)
Dinah (1987)
Ellis (1989)
Judy (1989) Noname
(1988)
Noname (1988)
Vera (1989)
Ofelia (1990)
Noname (1990)
Robyn (1990)
Zola (1990)
Flo (1990)
Caitlin (1991)
Gladys (1991)
Noname (1991)
Kinna (1991)
Mireille (1991) Winona
(1990)
Abe (1990)
Polly (1992)
Russ (1994)
Fred (1994)
Irving (1992)
Janis (1992)
Kent (1992)
Ted (1992)
Nathan (1993)
Ofelia (1993)
Percy (1993)
Robyn (1993) Janis
(1995)
Noname (1999)
Rachel (1999)
Noname (1999)
Sam (1999)
Yancy (1993)
Walt (1994)
Brendan (1994)
Doug (1994)
Ellie (1994)
Seth (1994)
Faye (1995)
Ryan (1995) Wendy
(1999)
Ann (1999)
Dan (1999)
Kai-tak (2000)
Bilis (2000)
Eve (1996)
Kirk (1996)
Peter (1997)
Rosie (1997)
Tina (1997)
Oliwa (1997)
Yanni (1998)
Zeb (1998) Chebi
(2001)
Noname (2001)
Nakri (2002)
Mindulle (2004)
Khanun (2005)
Neil (1999)
Olga (1999)
Paul (1999)
Bart (1999)
Bolaven (2000)
Prapiroon (2000)
Saomai (2000)
Rammasun (2002) Chanchu
(2006)
Pabuk (2007)
Wipha (2007)
Krosa (2007)
Kalmaegi (2008)
Fengshen (2002)
Fung- wong (2002)
Rusa (2002)
Linfa (2003)
Souldelor (2003)
Etau (2003)
Maemi (2003)
Namtheun (2004) Noname
(2008)
Linfa (2009)
Morakot (2009)
Meranti (2010)
Megi (2004)
Chaba (2004)
Songda (2004)
Nabi (2005)
Ewiniar (2006)
Wukong (2006)
Shanshan (2006)
Man-yi (2007)
Usagi Nari Dianmu Kompasu Malou
Spatial distributions of the damages are different between WTCs and STCs (Figure 3). WTCs generally bring more damages in the northwestern Korea, i.e. Sudo and Hoseo, than other provinces while STCs incur more damages in the southern and southeastern regions, i.e. Honam, Yeongnam and Gwandong, than other provinces. In terms of national aggregate damages, STCs are more harmful than WTCs (not shown), particularly in the Honam, the Yeongnam, and the Gwandong regions, losses by STCs are significantly larger than those by WTCs (Figure 3). However, in the Sudo and the Hoseo, the damages by STCs and WTCs are comparable and not significantly different from each other. This implies that WTC can bring extreme phenomena as damaging as STCs in the northwestern Korea despite its relatively weak maximum wind speeds recorded in the IBTrACS dataset. This comparability is important because about half of the total population and wealth of Korea are concentrated in the Sudo region in which the capital city, Seoul, is located.
Figure 3. Averages and differences in the number of homelessness, casualties, and property loss caused by weak tropical cyclones (WTCs) and strong tropical cyclones (STCs) for the five areas. Shading indicates that the WTC-induced value is larger than the STC one. Bold italic indicates that the difference is statistically significant at the 90 % confidence level based on the Mann–Whitney U test.
3.2 Climate environment comparison between weak TC and Strong TC
The geographical variations in the socio-economic losses caused by WTCs and STCs can be well explained by that in the near-surface wind speed and rainfall by WTCs and STCs (Figures 3 and 4). WTCs can bring strong winds and torrential rainfall to the Sudo and the Hoseo provinces as vigorous as STCs, representing about 9 m s–1and 50 mm. Hence, the similar amount of losses can be occurred by WTCs and STCs over the northwestern Korea. Meanwhile, compared to WTCs, more violent wind and heavy rainfall of STCs in the southeastern Korea are responsible for larger STC-induced socioeconomic losses therein. The comparability in wind and rainfall intensities between WTCs and STCs over the northwest Korea can be accounted by their different mean tracks. As shown in Figure 1, the coastlines of Sudo and Hoseo are only open to the West Sea of Korea while those of Honam, Yeongnam, and Gwandong are adjacent to the South and East Seas of Korea. Because STCs generally pass by the southeastern coast of Korea (Figure 5), it is hard for STCs to directly affect the West Sea. This is natural when considering the counter-clockwise circulation of TC; TC-induced wind may become weak after penetrating through the Korean peninsula due to surface friction of land. In other words, the western coast of Korea is located in downwind area so that decelerated wind only get there. In contrast, the southeastern coast is located in upwind area so that wind can reach there directly from the ocean
surface without weakening by land friction. Thus, the northwestern Korea can be less threatened by STCs although STCs are stronger systems according to the IBTrACS dataset. Otherwise, since the centers of WTCs generally move closer to the northwestern coast than STCs (Figure 5), WTCs can affect the northwest part of the country as much as STCs despite of their weakness based on the IBTrACS dataset. For the rainfall distribution that appears to be more intense over the south-to-east coastlines particularly in case of STCs (Figure 4), the existence of high mountains along south and east coasts may be responsible related with orographic updraft (Park et al. 2006). On the other hand, the average wind and rainfall intensities for non-damaged TCs over the Sudo are about 7 m s–1and 27 mm, respectively, which are smaller than those of the other provinces (not shown), implying that exposure and/or vulnerability of the Sudo to TCs may be higher than the other provinces because of the largest population and wealth in the Sudo.
Figure 4. Averages and differences in near-surface wind and rainfall caused by weak tropical cyclones (WTCs) and strong tropical cyclones (STCs) for the five areas. Shading indicates the WTC-induced value is larger than the STC one. Bold italic indicates that the difference is statistically significant at the 90 %confidence level based on the Mann–Whitney U test
The analyses above show that WTCs are as influential as STCs at least in the western part of the country. Here, in order to confirm if both wind and rainfall are still major factors to drive damages in case of WTC, the correlation coefficients are calculated between each intensity parameter (i.e. wind and rainfall) and each damage type (i.e. homelessness, casualties, and property losses). The result suggests that both wind and rainfall of WTCs are still significant explanatory variables for all types of damages even though WTCs are weakened systems according to the IBTrACS dataset (Table 3). All of WTCs’ correlation coefficients are statistically significant, just little bit smaller by 0.15 compared to STCs’ (Table 3). This implies that WTCs can induce simultaneous multiple severe phenomena interrelated with wind and rainfall (e.g., gust, downpour, storm surge, and wind wave) as much as STCs. On the other hand, rainfall is more closely correlated with the damages than winds; all of the correlation coefficients of rainfall are higher by about 0.1 than those of wind (Table 3). This result is consistent with Park et al.
(2015), who suggested rainfall is the most influential factor to determine TC- induced damage amount among the other intensity factors including wind and affected number of stations over Korea. However, this does not mean that wind- related damages are small; rather, both winds and rainfall cause serious damages in Korea.
Figure 5. Track comparison between weak tropical cyclones (WTCs) and strong tropical cyclones (STCs). (A) WTC tracks, (B) average track density of one WTC, (C) STC tracks, (D) average track density of one STC, (E) track density differnces (WTC minus STC). Track density is calculated with the grid of 2.5°, and dots indicate 95%
significant differences.
Table 3. Correlation coefficients between damages (the number of people who lost their homes (homelessness), casualties, and property loss) and wind, and between damages and rainfall, caused by weak tropical cyclones (WTCs) and strong tropical cyclones (STCs). Bold italic indicates that the correlation is statistically significant at the 90% confidence level.
Wind Rainfall
Casualty 0.34 0.41
WTCs Homelessness 0.41 0.51
Property loss 0.41 0.58
Casualty 0.50 0.57
STCs Homelessness 0.56 0.68
Property loss 0.62 0.71
Figure 6 shows the time series of STCs and WTCs that made landfall to South Korea. When we conduct the correlation analysis between the two time series. It appears that there is no significant correlation between the two, neither positive nor negative. To look more closely at the differences of the WTC tracks and STC tracks, we analyzed the large-scale steering flow (Figure 7), and its genesis and intensity development (Figure 8). First, for comparing the large-scale circulation, we use the seasonal composite method. For each of STC and WTC, we select the years having anomalously high number of landfall cases (above 1.5 times of standard deviation from mean). Then for those seven years for the two groups, we make composite plots. TC track is 80-90% determined by environmental steering flow. In this case, the subtropical high anomaly well matches with the steering flow, and it explains why WTC tracks are deviated to the west comparing to STC tracks. Also, WTCs experience Chinese mainland and it becomes weakened. So, the track difference further explains the landfall intensity differences.
Figure 6. Time series of the number of WTC and STC landfall cases over South Korea. The correlation between the two is 0.06, which has a p-value larger than 0.7.
Figure 7. 500hPa geopotential height anomaly and steering flow (1000 to 200hPa, pressure weight mean) for a) WTC- frequent years and b) STC-frequent years. Light (dark) shading indicates significant at 90% (95%) confidence level.
Steering flow vector is drawn for only the significantly different grids.
Furthermore, as shown in Figure 5, the genesis location is also significantly different between the strong and weakened groups. The genesis location of WTC is (18N, 130E) and that of STC is (18N, 139E), having significant longitudinal difference but no latitudinal difference. The more west-tilted genesis location can be a factor that WTC makes landfall to China without the help of large-scale circulation difference. Because of the earlier landfall of WTCs, it turned out that they have weaker lifetime maximum intensity (LMI) comparing to STCs (31m s–1comparing to 41 m s–1). The average LMI location of the WTCs and STCs were (22N, 123E) and (24N, 131E) respectively (figure not shown). LMI has a significant positive correlation with development time, and the development time is also shorter among WTCs, which implies that WTCs experience insufficient time to develop its intensity before landfall and get weaker by friction of the land. In addition, the track can is regulated by beta-effect. Given genesis location, 10-20%
of the translation velocity is determined by beta-effect. Thus, beta-effect can be a factor that makes a difference too.
4. Priority structure of TC risk realization process
By comparing the risk of WTCs and STCs, we suggested that even though WTCs have weaker maximum winds than STCs according to the IBTrACS dataset, they cause similar amounts of socioeconomic damages—casualties, homelessness, and property losses—in the northwestern Korea, the most densely populated and richest area in the country. Moreover, in WTCs, both wind and rainfall are still significant factors to determine damages so that WTCs can lead various wind- and rainfall-induced extreme phenomena (e.g., gust, downpour, storm surge, and wind wave) just like STCs. In this section, I would like to compare the damaged and non- damaged cases for WTCs and STCs, and find out the most distinctive difference between the two, which in turn can be the primary factor in deciding the damage occurrence of TCs.
Figure 8. Comparison of the lifetime intensity and track for damaged and non- damaged cases of STCs. Red points indicate TS, blue is for TD, green for ET, and black is for unknown (unclassified).
Figure 9. Same as Figure 8 for WTCs.
From Figure 8, we can say the almost all of non-damaged STCs made landfall on the eastside of South Korea. There are three STCs that went to the west but the non-damaged west-approaching STCs have rather very short track path, or propagated in a far distance from the coastline. This result implies that the track pattern could be a decisive factor in deciding STC damage occurrence. From Figure 9, unlike STCs, the damaged and non-damaged WTCs do not show very different track pattern. Rather, the color, indicating the intensity scale of the TC looks different. Comparing to non-damaged WTCs, there are much more green circles around South Korea for damaged WTCs. This means that the ratio of TCs who experience extra-tropical transition (ET) when making landfall to South Korea is higher in damaged groups. Thus, we hypothesized that whether a TC experiences ET or not is the most decisive factor in deciding WTC damage occurrence. In following sections of 4.1 and 4.2, we investigate if this hypothesis is true.
4.1 Extra-tropical transition in weak TC risk realization process
It is well known that a TC could be re-intensified after ET by previous studies, and this can be the reason why ET becomes a decisive factor for WTC risk. About 45 % of TCs undergo the extra-tropical transition often characterized by fast translational speed and rapid re-intensification (Jone et al. 2003). The re-intensified WTCs may accompany multiple severe phenomena, such as gust, downpour, storm surge, and wind wave. I have analyzed how WTC damage occurrence over South Korea is associated with ET. I checked a simple statistical indices of this relationship, called association analysis. I conducted an association analysis for two association rule “If a WTC experienced ET, then it damaged South Korea (ET ->
damage)” and “If a WTC damaged South Korea, the WTC is under ET”. Note
that association analysis is for concurrence, not for correlation.
Table 4. Association analysis result confidence values for extra-tropical transition (ET) as a TC approaching to Korean coastline.
Confidence ET at 7° ET at 5° ET at 3° ET at 1°
If ET, then damaged 0.57 0.67 0.78 0.9
If damaged, then ET 0.27 0.4 0.47 0.6
In Table 4, the confidence of the two association rules is presented.
Generally when confidence is higher than 0.5, the rule is regarded meaningful. For ET -> Damage rule, the confidence can be calculated as below, and the value will represent the probability of damage occurrence when ET occurs.
Confidence =
##
As a TC approaches closer to South Korea, the confidence of the rule is
getting higher (Table 4). This means ET in closer distance is a better
indicator for risk estimation rather than a far distance. There are in total 31
WTCs excluding 18 unavailable (overlapped) damage cases. Then, 15 WTCs
made an effective damage over South Korea. On the other hand, when we
consider ET at 1-degree distance from the coasts, in total 10 among 31
WTCs was marked as ET, and among them, 9 WTCs were damaged ones. In
turn, we can improve the predictability two (=0.9/0.45) times more than
random chance of damage occurrence. Thus, we can say that ET is certainly
associated with damage occurrence.
Table 5. Rule-set model for Weak TC damage occurrence.
Rule Attribute variable Diagnosis
variable
Number of cases
Hit rate
Lift TC status Station precipitation
1 ET >31mm/day Damaged 43 63% 2.3
2 Unknown ≤44.7mm/day Damaged 23 52% 1.9
3 ≤31mm/day Undamaged 65 98% 1.3
4 No approach to 1-degree Undamaged 60 95% 1.3
5 Unknown >44.7mm/day Undamaged 12 10% 1.3
6 TD Undamaged 20 85% 1.1
From rule-set model, it is verified that consideration of ET is the most effective way to determine damage occurrence by WTCs. The rules are presented in Table 5. The rules are ordered from the large lift to the small lift. Lift means how much probability gain we can get from using this rule comparing to the random chance. For example, because of rule 1, the chance to diagnose damage case accurately, becomes 2.3 times more than without having the rule.
When an attribute is the most-related variable to target variable, the
attribute should be used most frequently by a decision tree model
classification. In this sense, the relative importance of the attributes are
offered in terms of the usage rate by See5/C5.0 algorithm. In the rule-based
model, TC status at 1-degree occupies the most usage, 96%. Then, station
precipitation follows as 82%, neither station wind nor province variables
are used for the model as an effective classifier that can divide damaged
versus undamaged cases. The most interesting point I got from this
analysis is that the TC was attribute was the mostly used for classifying
damage occurrence even more than station precipitation, which is highly
emphasized in Section 3.2. In Table 6, the overall accuracy of rule-based
model is presented.
Table 6. Statistical measures of the performanceof rule-based classifier for Weak TCs.
Validation Observation
Damaged Undamaged Sum of forecast
Forecast Damaged 39 27 66
Undamaged 6 93 99
Sum of observation 45 120 165
Overall accuracy 80.0%
Hit rate 86.7%
False alarm rate 22.5%
4.2 Track pattern in strong TC risk realization process
Now, to test out the relationship of track and TC risk we clustered the tracks and then compared its risk elements. 85 Korea influenced TCs for the period 1979 - 2010 are clustered into four with FCM, and the list of them is given in Table 5. The number of TCs are 22, 31, 16, and 16 each from Cluster 1 to Cluster 4. Four clusters of TC track patterns can be characterized by 1) east-short, 2) east- long, 3) west-long, and 4) west-short types based on the length and position of TC tracks around the Korean Peninsula (Figure 10).
Each track pattern cluster’s temporal trend and monthly distribution is examined. Although there were some difference in trend but, for lack of the number of cases, any of the trends have not a significance. All the TCs regardless of clusters are concentrated in the month from June to September. TC genesis locations of the clusters showed significant differences in longitudes but not in latitudes. This means that the initial locations of TCs are relevant in their track patterns around the Korean Peninsula in east-west directions, but whether the TCs maintain their strength to the high latitudes are, in climatological point of view, irrelevant to the genesis location.
Hazard parameters derived from best-track data shows TC intensity and size are highly dependent on TC track patterns (Figure 11 (a) - (c)). These parameters are the values of the TCs when they are entering into 3 degree line from the Korean Peninsula (or approached to the nearest from South Korea for the
TCs not entering unto 3 degree distance). All the parameters appeared to have significantly different values among clusters (Kruskal-wallis test, 99% confidence level). Maximum wind speed and central pressure, which is well-known to be highly correlated with each other, indicate the intensity of the TC. Both of them shows that the longer track clusters (Cluster 2 and 3) are stronger than the shorter track clusters (Cluster 1 and 4). Cluster 2 is the strongest. Cluster 3 and 4 are similar but Cluster 3 is stronger in terms of maximum wind speed. The shortest track, Cluster 1 appears to be the weakest. It is natural that we observe the longer tracks generally have the stronger intensities. When we regard the TC intensity at 3-degree approaching as an initial value, with the same mid-latitude condition such as friction, shear, or energy source, the TCs having higher initial values will maintain their systems as tropical cyclone. In this sense, the intensity can be interpreted as the durability of the TC as well. However, we found that the background condition (geopotential height, sea surface temperature (SST), and vertical wind shear (VWS)) are also different for the track clusters. SST around the Korean Peninsula in longer cluster cases (Cluster 2 and 3) is significantly higher than that in shorter cluster cases (Cluster 1 and 4). Therefore, it seems that the internal strength of TC and the background condition together decide the length of TC track. Interestingly, the storm size distribution is very analogous to maximum wind speed distribution (Figure 11 (a) and (c)). The size is not necessarily correlated with TC intensity (Weatherford and Gray, 1987), but for influential TCs of Korea we see they are positively correlated.
Figure 10. Four clusters of tropical cyclone tracks that made landfall to South Korea for 1979–2010. Box shaded in grey, covering 28N – 40N and 120E – 138E, indicates the clustering domain for the fuzzy c-means clustering method. A map of the five aggregated provinces of South Korea is displayed in (C): Gyeong-gi (GG), Chung-cheong (CC), Jolla (JL), Gang-won (GW), and Gyeong-sang (GS). The Taebaek and Sobaek mountains are drawn with bold lines on the province map.
Table 7. The list of the clustered tropical cyclones that made landfall to South Korea for 1979 – 2010.
Year Cluster 1 Cluster 2 Cluster 3 Cluster 4
1979 IRVING JUDY
1980 ORCHID JUNE
1981 AGNES
1982 KEN BESS, ELLIS CECIL
1983 FORREST
1984 ED HOLLY
1985 ODESSA PAT JEFF, KIT,LEE BRENDA
1986 VERA NANCY
1987 DINAH THELMA
1988
1989 ELLIS, JUDY
1990 FLO ZOLA ROBYN
1991 GLADYS, noname CAITLIN, KINNA, MIREILLE
1992 IRVING, KENT JANIS TED
1993 NATHAN, OFELIA PERCY, ROBYN, YANCY
1994 WALT BRENDAN ELLIE, SETH DOUG
1995 FAYE, RYAN
1996 EVE KIRK
1997 ROSIE, OLIWA PETER TINA
1998 ZEB YANNI
1999 PAUL BART OLGA NEIL, ANN
2000 BOLAVEN PRAPIROON SAOMAI
2001
2002 RAMMASUN RUSA
2003 LINFA MAEMI SOUDELOR
2004 NAMTHEUN, MEGI,
CHABA, SONGDA MINDULLE
2005 NABI KHANUN
2006 WUKONG SHANSHAN EWINIAR
2007 MAN-YI USAGI NARI
20082009
2010 DIANMU,
KOMPASU, MALOU Number
of TCs 22 31 16 16
Hazard parameters derived from best-track data shows TC intensity and size are highly dependent on TC track patterns (Figure 11 (a) - (c)). These parameters are the values of the TCs when they are entering into 3 degree line from the Korean Peninsula (or approached to the nearest from South Korea for the TCs not entering unto 3 degree distance). All the parameters appeared to have significantly different values among clusters (Kruskal-wallis test, 99% confidence level). Maximum wind speed and central pressure, which is well-known to be highly correlated with each other, indicate the intensity of the TC. Both of them shows that the longer track clusters (Cluster 2 and 3) are stronger than the shorter track clusters (Cluster 1 and 4). Cluster 2 is the strongest. Cluster 3 and 4 are similar but Cluster 3 is stronger in terms of maximum wind speed. The shortest track, Cluster 1 appears to be the weakest. It is natural that we observe the longer tracks generally have the stronger intensities. When we regard the TC intensity at 3-degree approaching as an initial value, with the same midlatitude condition such as friction, shear, or energy source, the TCs having higher initial values will maintain their systems as tropical cyclone. In this sense, the intensity can be interpreted as the durability of the TC as well. However, we found that the background condition (geopotential height, sea surface temperature (SST), and vertical wind shear (VWS)) are also different for the track clusters. SST around the Korean Peninsula in longer cluster cases (Cluster 2 and 3) is significantly higher than that in shorter cluster cases (Cluster 1 and 4). Therefore, it seems that the internal strength of TC and the background condition together decide the length
of TC track. Interestingly, the storm size distribution is very analogous to maximum wind speed distribution (Figure 11 (a) and (c)). The size is not necessarily correlated with TC intensity (Weatherford and Gray, 1987; Knaff et al., 2014), but for influential TCs of Korea we see they are positively correlated.
Figure 11. Boxplots of the for