저작자표시-비영리-변경금지 2.0 대한민국 이용자는 아래의 조건을 따르는 경우에 한하여 자유롭게
l 이 저작물을 복제, 배포, 전송, 전시, 공연 및 방송할 수 있습니다. 다음과 같은 조건을 따라야 합니다:
l 귀하는, 이 저작물의 재이용이나 배포의 경우, 이 저작물에 적용된 이용허락조건 을 명확하게 나타내어야 합니다.
l 저작권자로부터 별도의 허가를 받으면 이러한 조건들은 적용되지 않습니다.
저작권법에 따른 이용자의 권리는 위의 내용에 의하여 영향을 받지 않습니다. 이것은 이용허락규약(Legal Code)을 이해하기 쉽게 요약한 것입니다.
Disclaimer
저작자표시. 귀하는 원저작자를 표시하여야 합니다.
비영리. 귀하는 이 저작물을 영리 목적으로 이용할 수 없습니다.
변경금지. 귀하는 이 저작물을 개작, 변형 또는 가공할 수 없습니다.
보건학석사 학위논문
Desorption study of spent activated carbon filter to investigate
micropollutants in tap water
수도수에 잔류하는 미량오염물질 규명을 위한 만기 사용한 활성탄 필터 탈착 연구
2016 년 8 월
서울대학교 보건대학원
환경보건학과 환경보건학 전공
Abstract
Desorption of micropollutants such as pharmaceuticals and personal care products (PPCPs) and endocrine disrupting compounds (EDCs) from a spent activated carbon using ultrasonic irradiation and organic solvent extraction were investigated. First, to optimized the desorption condition, this study compared several extraction solvents, appropriate amount of solvent, and sonication time. The optimized condition for desorption of micropollutants was found to be 800 mL of acetonitrile solvent, and 90 min of sonication for 1 g of PAC at 30oC. Then, to examine which micropollutants were adsorbed in the powdered activated carbon (PAC) filter used in the commercial water purifier, this optimized desorption condition was applied to extract the micropollutants from spent PAC filter. Total 11 micropollutants (caffeine, acetaminophen, sulfamethazine, sulfamethoxazole, metoprolol, carbamazepine, naproxen, bisphenol-A, ibuprofen, diclofenac, and triclocarban) were analysed from spent carbon filter. Among the micropollutants, caffeine, metoprolol, naproxen, and diclofenac had higher detection frequencies (>60%), and sulfamethazine, metoprolol and ibuprofen were only detected in the carbon filters, but not in the tap water, indicating that these micropollutants might exist less
than detection level in the tap water, but accumulated in the carbon filter.
Also, the regional patterns where the water purifiers are used were examined by identifying micropollutant detection patterns from spent carbon filter with various regions in Korea. The result showed that higher concentration of micropollutants were detected from the carbon filter collected from the Han river and Nakdong river basins with large population. Also, the level of micropollutants were higher where advanced oxidation process (AOP) are adopted in the drinking water treatment plants (WTPs), indicating that AOP process is effective for the removal of micropollutants. When compared according to different pore size filters, the desorption amount was higher from the filter which pore size is 10 times smaller than the other, indicating that higher amount of micropollutants can be adsorbed in smaller pore size filter.
Keywords: Micropollutants; Activated carbon filter; Desorption;
Optimization; Tap water
Student Number: 2014-23394
Contents
Abstract ··· ⅰ List of Figures ··· ⅴ List of Tables ··· ⅵ
I. Introduction ··· 1
1.1. Micropollutants in the environment ··· 1
1.2. Activated carbon adsorption and desorption ··· 5
1.3. Objectives ··· 7
II. Materials and Methods ··· 8
2.1. Chemicals and materials ··· 8
2.2. Experimental procedures ··· 10
2.2.1. PAC saturation with micropollutants ··· 10
2.2.2. Desorption test for optimization ··· 11
2.2.3. Collecting field water filters ··· 14
2.2.4. Desorption of field filters ··· 19
2.3. Analytical Methods ··· 21
III. Results and Discussion ··· 25
3.1. Optimization of desorption ··· 25
3.2. Detection of micropollutants from filed water filters by the optimized desorption conditions ··· 28
3.3. Comparison of micropollutants desorption amount in 4 big river streams ··· 34
3.4. Comparison of desorption in different filters ··· 37
3.5. Human health risk assessment of the micropollutants ··· 39
IV. Conclusion ··· 42
References ··· 44
국문초록 ··· 50
List of Figures
Figure 1. Release pathway of micropollutants into surface water ··· 4 Figure 2. Sampling area of field filters ··· 16 Figure 3. Schematic diagram of desorption experiment ··· 20 Figure 4. Distribution of micropollutants concentraion from spent
activated carbon filter ··· 32 Figure 5. Comparison of desorption amount of micropollutants from
filters according to 4 river basin areas ··· 35 Figure 6. Comparison of desorption amount of micropollutants
according to existence of advanced oxidation process in water treatment plants ··· 36 Figure 7. Comparison of desorption amount of micropollutants
according to different pore size filters ··· 38 Figure 8. Estimated Daily ingestion intake for each micropollutants · 40
List of Tables
Table 1. Annual domestic productions, occurrences in surface waters and tap water in Korea ··· 3 Table 2. Physical and chemical properties of target micropollutants 9 Table 3. The result of the PAC saturation process ··· 11 Table 4. Environmental conditions of desorption experiments for
optimization ··· 13 Table 5. Treatment process of water treatment plants in sampling area 4
river streams ··· 17 Table 6. Characteristics of 2 kinds of activated carbon filters used in
water purifiers ··· 19 Table 7. LC-MS/MS conditions for the analysis of target compounds 23 Table 8. MDLs of analytes and recoveries in water samples ··· 24 Table 9. Desorption rate comparison according to each condition for
optimization ··· 27 Table 10. Detection frequencies and concentration of micropollutants
from spent activated carbon filters ··· 31 Table 11. Concentration of tap water in Korea ··· 33 Table 12. Exposure assessment and risk assessment of
I. Introduction
1.1. Micropollutants in the environment
Surface water is commonly used as a drinking water source in areas with growing urban populations (Stackelberg et al., 2007). The 20 % of population were concentrated in Seoul, capital of Korea. Micropollutants such as pharmaceuticals and personal care products (PPCPs) and endocrine-disrupting compounds (EDCs) have been found in wastewater effluents, surface water and even tap water at ng/L to µg/L (Halling- Sorensen et al., 1998; Vanderford et al., 2003; Kim et al., 2007;
Kasprzyk-Hordern et al., 2008; Benotti et al., 2009; Rahman et al., 2009).
Micropollutants can flow into water environment from various sources, such as pharmaceutical factories, household, hospital effluent, antibiotics to livestocks, agricultural effluents, aquaculture and landfill leachate (Focazio et al., 2008) (Figure 1). Excessive amount of pharmaceuticals are produced and expired pharmaceuticals are thrown out. People can get some over-the-counter medications (e.g. acetaminophen, ibuprofen, and naproxen) easily in pharmacy which are available without prescriptions.
Also, large amount of them were exposed to environment by unappropriate disposal. They cannot be removed fully in conventional water treatment and residual can be released to the aquatic environment (Ratola et al., 2012). Even at very low levels in surface water or drinking water, micropollutants can have adverse health impact to ecosystem due to chronic exposure (Westerhoff et al., 2005; Nam et al., 2014a).
Previous studies reported that some micropollutants such as acetaminophen, caffeine, naproxen and ibuprofen can be effectively removed (more than 80%) in water treatment plants (Yu et al., 2006;
Gomez et al., 2007; Nam et al., 2014b). However, some micropollutants such as carbamazepine, diclofenac, clofibric acid, and metoprolol have showed poor removal efficiency (Yu et al., 2006; Gomez et al., 2007;
Benotti et al., 2009; Nam et al., 2014b), indicating that these compounds are not removed completely in water treatment plants and flow into water stream.
In this study, the 11 micropollutants were selected based on their domestic usages, occurrences in surface water, and in tap water in Korea (Table 1). The selected micropollutants are produced significantly
some of them are detected even in tap water or have possibility to be detected in tap water (Table 1).
Table 1. Annual domestic productions, occurrences of study micropollutants in surface waters and tap water in Korea
Compounds Annual
production (ton/yr)
Occurrences (ng/L) Surface water tap water
Diclofenac (DCF) 5.9a 21-383d NDd
Ibuprofen (IBU) 149.3b 11-38f NDd
Naproxen (NPX) 43.1b 20-483f NDd
Carbamazepine (CBM) 8.9a 3-344d 1-48e
Metoprolol (MTP) 0.8b 2.3-164.5g NDd
Sulfamethoxazole (SMZ) 61.3a 8-54d NDd / 2-4e Sulfamethazine (SMA) 13.7a 4-309d NDd / 2-3e Acetaminophen (ACT) 754.9a 2-965d 17-55e
Caffeine (CFF) 1823.6b 6-1475d 3-249d
Triclocarban (TCB) -h - -
Bisphenol-A (BPA) 1,480c 0.08-1.52d 80-100
a: National Institute of Environmental Research, 2007; b: Korean Pharmaceutical Manufacturers Association, 2003; c: KME, 2007; d: National Institute of Environmental Research, 2011; e:
National Institute of Environmental Research, 2014; f: Kim et al., 2007; g: Nam et al., 2014; h:
unknown data
Pharmaceuticals & Personal care products (PPCPs)
Effluent from
household Effluent from
hospital Inappropriate
disposal Aquaculture
treatment
Water treatment plant Surface water Effluent
Drug manufacturing
factories Agricultural
Run-off Livestock
treatment
1.2. Activated carbon adsorption and desorption
Activated carbon such as granular activated carbon (GAC) or powder activated carbon (PAC) can remove micropollutants (e.g. taste and odor compounds, pesticides and pharmaceuticals) effectively by adsorption process (Ternes et al., 2002; Westerhoff et al., 2005).
Adsorption is a process which utilizes physical, chemical and electrostatic interactions between the contaminants and adsorbent (Karanfil et al. 2004). It is being widely used in water treatment plants because it is cost-effective, simple, and has high efficiency of removal (Sotelo et al., 2012). However, adsorption efficiencies vary by physicochemical property such as hydrophobicity of compounds, pore size and amount of adsorbent, contact time, pH, and competition with natural organic matter (Yoon et al., 2003; Snyder et al., 2007; Nam et al., 2014a).
There are various techniques to regenerate GAC, such as thermal regeneration (Ania et al., 2004; Ledesma et al., 2014), solvent regeneration (Zhou et al., 2015), microwaved-induced regeneration (Ania et al., 2004; Ania et al., 2005a) and catalytic wet oxidation (Gonzalez et al., 2002). However, these techniques have the limitations
such as low regeneration efficiencies, high energy consumption, high cost, generation of toxic products and potential secondary pollution (Zhou et al., 2015). Also, thermal regeneration which is widely used regeneration technology can cause degradation of pore structure, and significant amount of carbon loss (Ania et al., 2005b; Li et al., 2015).
Therefore, the effective regeneration technique is needed. Chemical regeneration can be conducted rapidly with no carbon consumption (Lu et al., 2011). The solubility of compounds to solvent and affinity to adsorbent surface influence on regeneration efficiency (Karanfil and Dastgheib, 2004) . However, there have been no attempt to desorb micropollutants from spent activated carbon filter used in commercial water purifier.
In Korea, there is high percentage of water purifier usage due to the widespread hesitation of using tap water as drinking water directly (Yoo, 2005). The reason for not drinking tap water is mostly indefinite anxiety, such as distrust of water tank and water pipe. Most people drink purified water instead of tap water in Korea. Most water purifiers adopt activated carbon filter as pre- or post-treatment process. The micropollutants such
the adsorbed micropollutants can be identified by the desorption process from spent activated cabon filters.
1.3. Objectives
The objectives of this study were: (1) to examine the optimized desorption method to desorb micropollutants in spent carbon filter; (2) to examine which micropollutants are exist in field carbon filters, and investigate the tap water quality in each reason indirectly; and (3) to investigate the regional pattern where the water purifiers are used was examined by identifying the contaminants detection patterns from spent activated carbon filter.
II. Materials and Methods
2.1. Chemicals and materials
Acetaminophen (ACT), caffeine (CFF), carbamazepine (CBM), diclofenac (DCF), ibuprofen (IBU), naproxen (NPX), metoprolol (MTP), sulfamethoxazole (SMZ), sulfamethazine (SMA), bisphenol-A (BPA), triclocarbon (TCB) were purchased from Sigma-Aldrich (Korea), of which the physical and chemical properties are shown in Table 2. All chemicals 100 mg were dissolved in 100 mL methanol to make the stock solutions, and were kept in 4oC refrigerator to prevent biodegradation.
13C6-sulfamethoxazole and 13C6-naproxen (Cambridge Isotope Laboratories, Cambridge, UK) were used as internal standards to compensate for matrix effects. Methanol (LC-MS grade), and acetonitrile were obtained from Fisher Scientific (USA). Coconut shell- based powdered activated carbon (PAC, Coway Co. Korea, 80-325 mesh) was used as an adsorbent, and prepared as a solution of 1 g/L hydrated for 24 h in distilled water to activate the surface of PAC.
Table 2. Physico-chemical properties of target micropollutants
Compounds Molar formula LogKow pKa General use Diclofenac (DCF) C14H
11Cl
2NO
2 3.91a 4.15 Anti-inflammatory Ibuprofen (IBU) C13H18O2 3.64a 4.51 Anti-inflammatory Naproxen (NPX) C14H14O3 2.84a 4.2 Anti-inflammatory
Carbamazepine
(CBM) C15H12N2O 2.47
b 7 Anticonvulsant
Metoprolol (MTP) C15H
25NO
3 1.88b 9.68 β-blocker
Sulfamethoxazole
(SMZ) C10H11N3O3S 0.68
a 5.7 Antibiotic
Sulfamethazine
(SMA) C12H14N4O2S 0.62
c 2.6/7.7 Antibiotic
Acetaminophen
(ACT) C8H9NO2 0.46
d 9.38 Antipyretic
Caffeine (CFF) C8H
10N
4O
2 -0.5a 14 Stimulant
Triclocarban (TCB) C13H
9Cl
3N
2O 4.2-6e 12.7 Anti-microbial disinfectant Bisphenol-A (BPA) C15H16O2 3.4f 9.59 Plasticizer a: Bones et al., 2006; b: Gros et al., 2006; c: Henry et al., 1976; d: Stackelberg et al., 2007; Sabourin et al., 2009; e: Snyder and Allene, 2009; f: Staples et al., 1998
2.2. Experimental procedures
2.2.1. PAC saturation with micropollutants
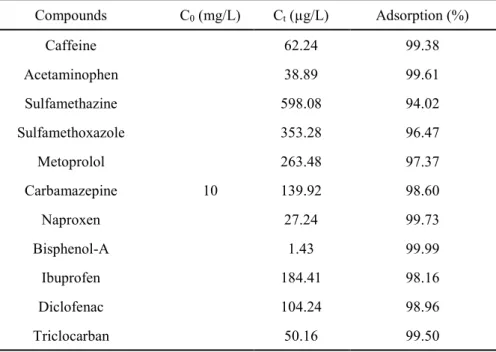
A series of 2 L beakers containing hydrated 1 g/L PAC with distilled water were installed in a jar tester. The initial concentration 10 mg/L of each 11 micropollutants was added to beakers. A rapid mixing (140 rpm) ensured a vigorous mixing solution state and accelerated the adsorption process. The micropollutants were saturated in PAC by agitating for 90 min. The exhausted PAC was separated by filtration using 0.45-μm GF/C filter (Whatman, UK), and dried in room temperature for 24 h. The result showed that these micropollutants were fully adsorbed in PAC filter about 90 to 100 % (Table 3).
Table 3. The result of the PAC saturation process (1 g/L PAC, 10 mg/L of compounds, mixing time 90 min, mixing speed 140 rpm, temperature 20℃)
Compounds C0 (mg/L) Ct (µg/L) Adsorption (%) Caffeine
10
62.24 99.38
Acetaminophen 38.89 99.61
Sulfamethazine 598.08 94.02
Sulfamethoxazole 353.28 96.47
Metoprolol 263.48 97.37
Carbamazepine 139.92 98.60
Naproxen 27.24 99.73
Bisphenol-A 1.43 99.99
Ibuprofen 184.41 98.16
Diclofenac 104.24 98.96
Triclocarban 50.16 99.50
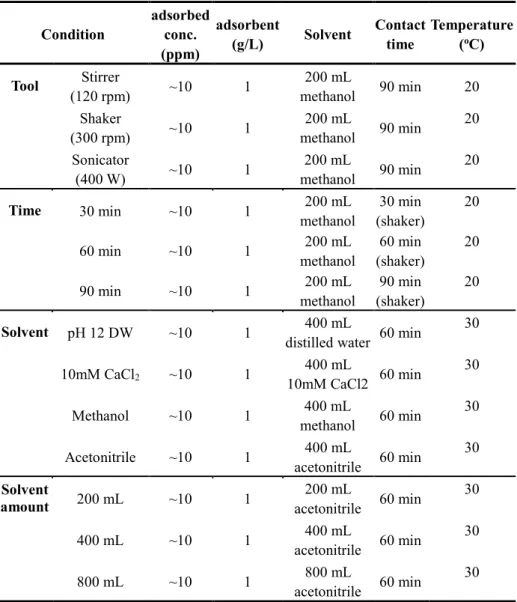
2.2.2. Desorption test for optimization
Table 4 shows the experiment conditions in each parameter for optimization of desorption. 4 parameters were examined in this study, mixing tools such as stirrer, shaker or sonicator, mixing time, extraction solvent, and solvent amount. Batch desorption experiments were carried out in the stirrer, shaker or sonicator. A rapid mixing 300 rpm were
provided by a shaker, and 400W sonication power (frequency 40 kHz) ensured a strong stimulation for desorption. Methanol and acetonitrile was used as extraction solvent. 10 mM CaCl2 and pH adjusted deionized water were also compared with extraction solvent. Different volumes of organic solvent (200, 400, and 800 mL) was used to desorb the micropollutants from exhausted PAC. To find efficient desorption time, different sonication time (60, 90, and 120 min) were also compared (Table 4).
After desorption process, the 10 mL sample was withdrawn and filtered through 0.45-μm membrane filter. Also, the sample was concentrated for 24 hours using centrifugal concentrator (CVE-3100, EVELA, Japan), and then was eluted by 1.0 mL methanol.
Table 4. Environmental conditions of desorption experiments for optimization
Condition
adsorbed conc.
(ppm)
adsorbent
(g/L) Solvent Contact time
Temperature (oC) Tool Stirrer
(120 rpm) ~10 1 200 mL
methanol 90 min 20 Shaker
(300 rpm) ~10 1 200 mL
methanol 90 min 20 Sonicator
(400 W) ~10 1 200 mL
methanol 90 min 20
Time 30 min ~10 1 200 mL
methanol
30 min (shaker)
20
60 min ~10 1 200 mL
methanol
60 min (shaker)
20
90 min ~10 1 200 mL
methanol
90 min (shaker)
20
Solvent pH 12 DW ~10 1 400 mL
distilled water 60 min 30
10mM CaCl2 ~10 1 400 mL
10mM CaCl2 60 min 30
Methanol ~10 1 400 mL
methanol 60 min 30
Acetonitrile ~10 1 400 mL
acetonitrile 60 min 30 Solvent
amount 200 mL ~10 1 200 mL
acetonitrile 60 min 30
400 mL ~10 1 400 mL
acetonitrile 60 min 30
800 mL ~10 1 800 mL
acetonitrile 60 min 30
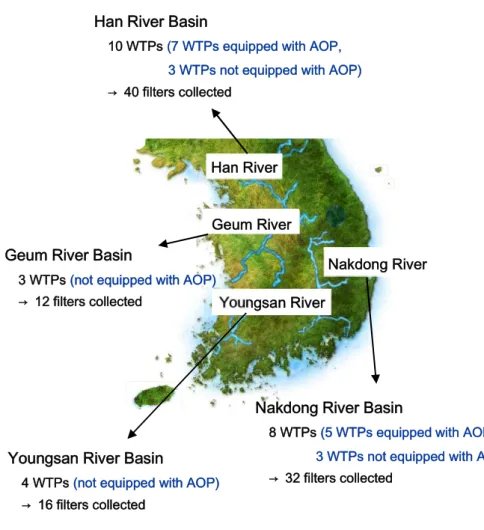
2.2.3. Collecting field water filters
In Korea, there are 4 major river streams, (the Han River, Geum River, Yeongsan River and Nakdong River) (Figure 2). Especially, metropolitan cities such as Seoul, Busan and Daegu cities are located in the Han river and Nakdong river basins. The population in Seoul near Han river basin is approximately 10 million in an area of 605.18 km2 (a population density of 16,659 capita km-2) and Nakdong river basin includes 2 condensed cities [‘Daegu’ city with a population of 2,518,467 in an area of 883.63 km2 (2,857 capita km-2), ‘Busan’ city with a population more than 3 million in an area of 769.82 km2 (4628 capita km-2)] and many industrial complexes. The population ranking of Seoul, Busan and Daegu took first, second and fourth place respectively in Korea.
Usually, the spent filters were replaced with a new one after every 4 to 6 months. The filter samples were collected from the homes around the 4 major river basins. The filters were collected from the houses around the water treatment plants. 4 activated carbon filters were collected from houses which is connected to each water treatment plants.
from Nakdong River basin) were collected from the houses located in each river basin (Figure 2). The collected filters were then grouped according to the existence of advance oxidation process facility in their water treatment plants (Table 5). 7 WTPs have advanced oxidation process among 10 WTPs in Han river basin. 5 WTPs have advanced oxidation process among 8 WTPs in Nakdong river basin (Table 5).
There were no advanced oxidation process in WTPs in Geum river or Youngsan river basins. 2 kinds of water filters were collected in each WTPs areas, they were different in filter length and pore size (Table 6).
The 50 filters have pore size around 10 μm and the length is 16 cm, other 50 filters have pore size around 1 μm and the length is 8 cm (Table 6).
Figure 2.Sampling area of field filters.
Han River Basin
10 WTPs (7 WTPs equipped with AOP, 3 WTPs not equipped with AOP) → 40 filters collected
Youngsan River Basin
4 WTPs (not equipped with AOP) → 16 filters collected
* Advanced Oxidation Process (AOP) Nakdong River
Youngsan River Han River
Geum River
Geum River Basin
3 WTPs (not equipped with AOP) → 12 filters collected
Nakdong River Basin
8 WTPs (5 WTPs equipped with AOP, 3 WTPs not equipped with AOP) → 32 filters collected
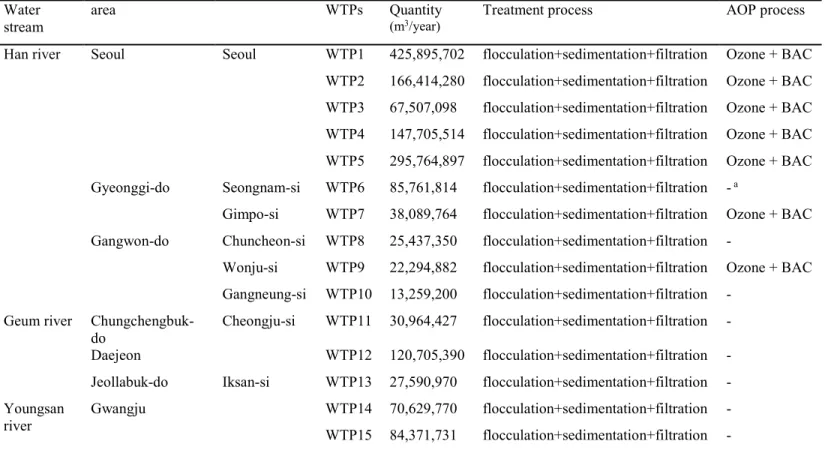
Table 5. Treatment process of water treatment plants in sampling area 4 river streams
Water stream
area WTPs Quantity
(m3/year)
Treatment process AOP process
Han river Seoul Seoul WTP1 425,895,702 flocculation+sedimentation+filtration Ozone + BAC WTP2 166,414,280 flocculation+sedimentation+filtration Ozone + BAC WTP3 67,507,098 flocculation+sedimentation+filtration Ozone + BAC WTP4 147,705,514 flocculation+sedimentation+filtration Ozone + BAC WTP5 295,764,897 flocculation+sedimentation+filtration Ozone + BAC Gyeonggi-do Seongnam-si WTP6 85,761,814 flocculation+sedimentation+filtration - a
Gimpo-si WTP7 38,089,764 flocculation+sedimentation+filtration Ozone + BAC Gangwon-do Chuncheon-si WTP8 25,437,350 flocculation+sedimentation+filtration -
Wonju-si WTP9 22,294,882 flocculation+sedimentation+filtration Ozone + BAC Gangneung-si WTP10 13,259,200 flocculation+sedimentation+filtration -
Geum river Chungchengbuk- do
Cheongju-si WTP11 30,964,427 flocculation+sedimentation+filtration - Daejeon WTP12 120,705,390 flocculation+sedimentation+filtration - Jeollabuk-do Iksan-si WTP13 27,590,970 flocculation+sedimentation+filtration - Youngsan
river
Gwangju WTP14 70,629,770 flocculation+sedimentation+filtration - WTP15 84,371,731 flocculation+sedimentation+filtration -
Jeollanam-do Yeosu-si WTP16 27,398,629 flocculation+sedimentation+filtration - a Suncheon-si WTP17 14,282,714 flocculation+sedimentation+filtration - Nakdong
river
Gyeongsangbuk- do
Gyeongsan-si WTP18 21,648,066 flocculation+sedimentation+filtration - Gyeongsangnam-
do
Changwon-si WTP19 84,986,000 flocculation+sedimentation+filtration Ozone + BAC Jinju-si WTP20 16,024,396 flocculation+sedimentation+filtration -
Gimhae-si WTP21 34,933,097 flocculation+sedimentation+filtration Ozone + BAC Busan WTP22 40,815,040 flocculation+sedimentation+filtration Ozone + BAC WTP23 146,633,500 flocculation+sedimentation+filtration Ozone + BAC WTP24 1,392,566 Sedimentation+sand filtration -
WTP25 197,392,000 flocculation+sedimentation+filtration Ozone + BAC
a-: Advanced oxidation process is not available
Table 6. Characteristics of 2 kinds of activated carbon filters used in water purifiers
Filter A Filter B
Pore size ~10 μm ~1 μm
Length 16 cm 8 cm
Carbon amount 130 g d.w. 60 g d.w.
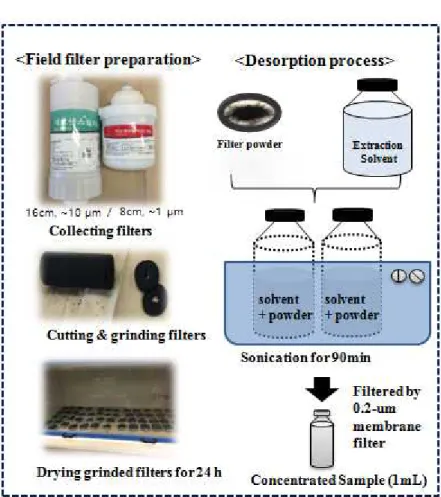
2.2.4. Desorption of field filters
Total 100 spent field carbon filters obtained from different regions in Korea were cutted into slices of which the thickness are less than 3 mm.
Then, the cutted filters were dried for 24 hours to remove water from the filters. After drying, they were ground by blender and fine particle powder was obtained. The ground field filters were used for the desorption experiment as shown in Fig. 3. 400 mL of acetonitrile for small size filters and 800 mL of acetonitrile for larger size filters were used as extraction solvent. Then, they were sonicated for 90 min with 400 W sonication intensity. The 50 mL of sample was withdrawn and filtered through 0.45-μm filter. Samples were concentrated for 24 hours using centrifugal concentrator (CVE-3100, EVELA, Japan) and eluted by methanol 1 mL.
Figure 3.Schematic diagram of desorption experiment
2.3. Analytical Methods
The target micropollutants were analyzed by UPLC (Nexera, Shimadzu, Kyoto, Japan) connected to a triple quadrupole mass spectrometer (API-4000, Forster City, Canada) with an electron ion spray source working in both positive and negative modes. The target micropollutants were separated with a reverse phase C18 column (Luna 3μm; 150 x 20 mm, Phenomenex, Torrance, Canada). The flow rate was 0.2 mL/min, and the injection volume was 10 μL. The isocratic mobile phase was 95:5 methanol:water with 10 mM ammonium formate and 0.3%
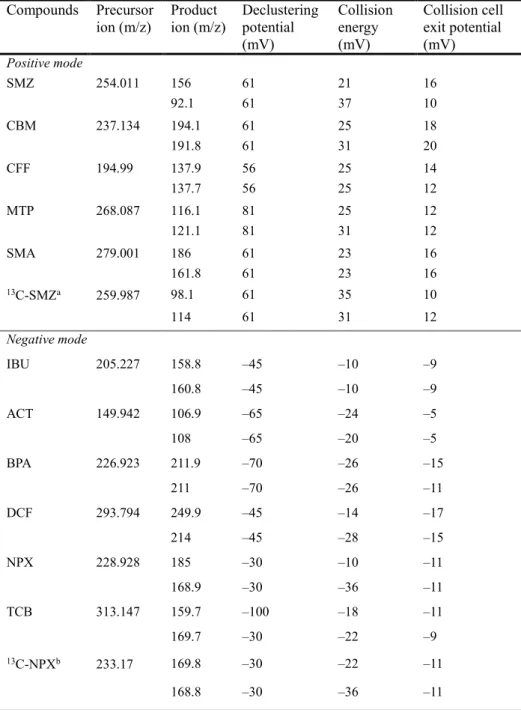
formic acid (v/v) in the positive mode, and 98:2 methanol:water with 5 mM ammonium acetate (v/v) in the negative mode (Nam et al. 2014). By ionization, the target compounds were separated into negative (ACT, BPA, DCF, IBU, NPX and TCB) or positive (CBM, CFF, MTP, SMA, and SMZ) ion groups. The optimized ion pairs of the 11 micropollutants and MS collision conditions are shown in Table 7.
For quality assurance/quality control (QA/QC), the recoveries of the extracted samples were calculated by comparing the spiked water samples with standard samples. It is obtained the limit of detection (LOD) and limit of quantification (LOQ) calculated using a signal to noise (S/N)
ratios of 3 and 10. LOD and LOQ of the samples were in the range of 0.07-0.51 ng/L and 0.25-1.69 ng/L. Method detection limit (MDL) was estimated with 7 replicates using 1 and 2 ng/L of standard analytes samples. The MDLs were in the range 0.4-2.65 ng/L and the recoveries of internal standards were in the range 96-119% throughout the experiments (Table 8).
Table 7. LC-MS/MS conditions for the analysis of target compounds
Compounds Precursor ion (m/z)
Product ion (m/z)
Declustering potential (mV)
Collision energy (mV)
Collision cell exit potential (mV) Positive mode
SMZ 254.011 156 61 21 16
92.1 61 37 10
CBM 237.134 194.1 61 25 18
191.8 61 31 20
CFF 194.99 137.9 56 25 14
137.7 56 25 12
MTP 268.087 116.1 81 25 12
121.1 81 31 12
SMA 279.001 186 61 23 16
13C-SMZa 259.987
161.8 61 23 16
98.1 61 35 10
114 61 31 12
Negative mode
IBU 205.227 158.8 –45 –10 –9
160.8 –45 –10 –9
ACT 149.942 106.9 –65 –24 –5
108 –65 –20 –5
BPA 226.923 211.9 –70 –26 –15
211 –70 –26 –11
DCF 293.794 249.9 –45 –14 –17
214 –45 –28 –15
NPX 228.928 185 –30 –10 –11
168.9 –30 –36 –11
TCB 313.147 159.7 –100 –18 –11
13C-NPXb 233.17
169.7 –30 –22 –9
169.8 –30 –22 –11
168.8 –30 –36 –11
a:13C-sulfamethoxazole (internal standard) b:13C-naproxen (internal standard)
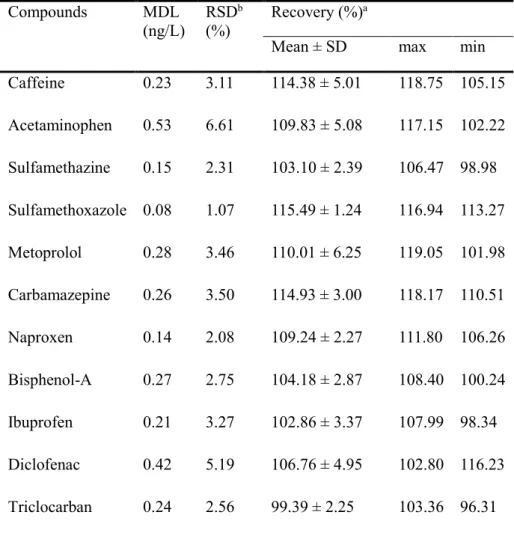
Table 8. MDLs of analytes and recoveries in water samples
a Recoveries were calculated with the spiked internal standard (10 ng/L); 13C -sulfamethoxazole and 13C- naproxen.
b The relative standard deviation (RSD, %) expresses the percentage of standard deviation divided by mean
Compounds MDL
(ng/L)
RSDb (%)
Recovery (%)a
Mean ± SD max min
Caffeine 0.23 3.11 114.38 ± 5.01 118.75 105.15 Acetaminophen 0.53 6.61 109.83 ± 5.08 117.15 102.22 Sulfamethazine 0.15 2.31 103.10 ± 2.39 106.47 98.98 Sulfamethoxazole 0.08 1.07 115.49 ± 1.24 116.94 113.27 Metoprolol 0.28 3.46 110.01 ± 6.25 119.05 101.98 Carbamazepine 0.26 3.50 114.93 ± 3.00 118.17 110.51 Naproxen 0.14 2.08 109.24 ± 2.27 111.80 106.26 Bisphenol-A 0.27 2.75 104.18 ± 2.87 108.40 100.24 Ibuprofen 0.21 3.27 102.86 ± 3.37 107.99 98.34 Diclofenac 0.42 5.19 106.76 ± 4.95 102.80 116.23 Triclocarban 0.24 2.56 99.39 ± 2.25 103.36 96.31
III. Results and Discussion
3.1. Optimization of desorption
First, the effect of mixing tool for desorption of PPCPs is illustrated in Table 9. Shaker and sonicator were compared for desorption of PPCPs.
Sonicator achieved better desorption efficiency than shaker (Table 9).
The enhancement effect of sonicator might be mainly due to the cavitation effect between PAC particles produced by ultrasonic irradiation (Zhou et al., 2015). Cavitaion can generate rapid whirlpool by high pressure oscillation, resulting weakening the binding energy between adsorbate and PAC particles (Zhou et al., 2015).
Then, different extraction solvents with pH adjusted distilled water, methanol, and acetonitrile were compared. By adjusting pH 12 of distilled water, micropollutants were hardly desorbed less than 1% (Table 9). This result implies that chemical affinity of solvent and adsorbate is much lower than that of adsorbent and adsorbate. The desorption rate using acetonitrile solvent was significantly higher than using methanol (Table 9). This result might be due to that higher polarity of acetonitrile
encouraged higher adsorption affinity toward polar adsorbate (Martinez and Iverson, 2012).
As also shown in Table 9, the desorption rate was considerably increased with the increasing volume of acetonitrile solvent from 200 to 800 mL, indicating that the desorption can be enhanced by increasing the volume of organic solvent. According to increasing ultrasonic irradiation time from 30 min to 120 min, the desorption amount also increased (Table 9). By considering slight difference between 90 and 120 min, the final optimal condition for desorption was determined as 800 mL of acetonitrile, 90 min of sonication time using sonicator at 30℃ for desorbing 1 g of PAC containing micropollutants. This optimized desorption conditions is a practical, feasible and economically sound method than thermal or bio-regeneration on those compounds due to that the solubility of target compounds to high polarity organic solvent is high and combination with ultrasonic power can stimulate and exceed the power of adsorbate-carbon surface attraction (Zhou et al., 2015).
Table 9. Desorption rate (%) comparison according to each condition for optimization
Desorption (%) CFF ACT SMA SMZ MTP CBM NPX BPA IBU DCF TCB
Tool
Stirrer 2.29 0.16 2.59 5.29 0.73 5.52 0.04 0.02 0.67 0.04 0.03 Shaker 5.34 0.20 2.82 7.39 1.07 6.44 0.12 0.05 1.41 0.10 0.05 Sonicator 6.52 4.01 7.38 16.66 1.73 8.95 2.44 9.94 12.71 0.37 0.05
Time
30 min 2.80 0.06 0.93 5.45 0.28 2.83 0.03 0.03 0.68 0.01 0.01 60 min 4.97 0.18 1.93 7.68 0.79 5.51 0.07 0.04 1.20 0.04 0.01 90 min 7.69 0.30 4.23 11.06 1.61 9.65 0.17 0.07 2.11 0.14 0.07
Solvent
pH 12 DW 0.03 0.01 0.84 5.34 0.00 0.00 0.03 0.53 0.20 0.02 0.02 10mM CaCl2 0.13 0.00 0.04 0.07 0.13 0.01 0.00 0.01 0.07 0.14 0.10 Methanol 0.75 1.03 4.91 14.09 4.00 4.64 1.00 10.60 3.30 1.02 0.06 Acetonitrile 11.55 11.30 15.40 23.49 4.94 17.42 5.81 12.66 22.51 1.21 0.07
Solvent amount
200 mL 6.52 4.01 7.38 16.66 1.73 8.95 2.44 9.94 12.71 0.37 0.05 400 mL 11.55 11.3 15.4 23.49 4.94 17.42 5.81 12.66 22.51 1.21 0.07 800 mL 20.68 19.44 22.52 32.1 9.43 23.67 11.36 17.16 32.12 2.64 0.17
3.2. Detection of micropollutants from field water filters by the optimized desorption conditions
Using the optimized desorption conditions, the desorption of micropollutants from field water filters was conducted. Field water filter mean spent activated carbon filter in water purifier which people really used in their houses. The result showed that naproxen, diclofenac, and caffeine were detected more than 80% in 100 field filters and sulfamethazine, sulfamethoxazole, and triclocarban were detected less than 10% (Table 10). Naproxen was the most frequently detected with the highest level of desorption amount from the water filters (Table 10).
Kim et al. (2007) showed that naproxen and caffeine are frequently observed micropollutants in both surface water and wastewater treatment plant effluents. Also, caffeine was detected as concentration of 2.5-225 ng/L in untreated and treated drinking water treatment system in U.S.
(Wang et al., 2011). Kim et al. (2007) also reported sulfamethoxazole and carbamazepine were detected with significant concentration in surface water in Korea.
efficiently by chlorination treatment in conventional drinking water treatment plant, but carbamazepine and caffeine was not removed effectively in chlorination treatment process (Wang et al., 2011). This result indicates that carbamazepine and caffeine can exist in tap water with low level. This is consistent with the result of this study, showing that sulfamethoxazole was not detected and carbamazepine was detected in low level by desorption of filters (Table 10). Benotti et al. (2009) also reported that carbamazepine, sulfamethoxazole are present in tap water in U.S. at 6.8 ng/L, 0.32 ng/L, respectively. In China, 1.3~6.7 ng/L of carbamazepine and 8.0~21.3 ng/L of sulfamethoxazole were reported to be existed in tap water (Leung et al., 2013). In U.S. drinking water treatment system, ibuprofen concentration was almost the same in untreated and treated water sample with a highest concentration of 77.2 ng/L, indicating that these compounds were hardly removed in drinking water treatment system (Wang et al., 2011). Therefore, there is possibility of ibuprofen existing in tap water. The result of this study showed that ibuprofen, metoprolol and declofenac were hardly detected in tap water because they exist in tap water in very low level with less than detection limit (Table 11). However, after they accumulated in filters in water purifier, they were detected from spent activated carbon filters (Table 10).
Therefore, investigating which compounds are exist in tap water by spent carbon filter desorption can be useful method to detect micropollutants in tap water.
Table 10. Detection frequencies and concentration of micropollutants from spent activated carbon filters
CFF ACT SMA SMZ MTP CBM NPX BPA IBU DCF TCB
Freq.a(%) 88.00 14.00 2.00 - 67.00 20.00 100.00 47.00 47.00 97.00 6.00 Mean ± SD
(ng/g carbon)
0.11
±0.12
0.06
±0.03
0.15
±0.08 - 0.25
±0.25
0.13
±0.14
0.92
±1.40
0.68
±1.31
0.30
±0.45
0.51
±0.81
0.41
±0.61 Median
(ng/g carbon) 0.07 0.06 0.15 0.15 0.05 0.40 0.33 0.07 0.22 0.22 Min.
(ng/g carbon) 0.01 0.03 0.09 0.00 0.02 0.02 0.02 0.03 0.02 0.03 0.04 Max.
(ng/g carbon) 0.63 0.10 0.20 0.00 1.05 0.59 8.76 8.76 1.91 5.15 1.63
aFreq. : detection frequency (%) N=100
CFF ACT MTP CBM NPX BPA IBU DCF
Concentration (ng/ g carbon)
0 1 2 3 4 5
Figure 4. Distribution of micropollutants concentraion from spent activated carbon filter.
Table 11. Concentration of tap water in Korea
ng/L CFF ACT SMA SMZ MTP CBM NPX BPA IBU DCF TCB
Freq.a(%) 64.00 68.00 -b - - 8.00 100.00 100.00 16.00 100.00 4.00
Mean ± SD (ng/L)
1.42
±1.59
1.73
±0.38 - - - 0.99
±0.67
3.28
±2.32
13.93
±11.76
1.12
±0.66
4.76
±1.81 0.67
Median (ng/L) 0.78 1.73 - - - 0.99 2.89 10.31 0.96 4.99 0.67
Min. (ng/L) 0.49 1.09 - - - 0.51 0.81 3.49 0.52 0.96 0.67
Max. (ng/L) 5.92 2.39 - - - 1.46 12.65 58.04 2.03 7.87 0.67
N=25
aFreq.=detection of frequency(%)
bnot detectable
3.3. Comparison of micropollutants desorption amount in 4 major river basins in Korea
The regional pattern along four major river basins of desorption amount of naproxen, bisphenol-A, ibuprofen, and diclofenac with high detection frequency can be compared according to 4 big river streams.
The regional pattern of micropollutants detection in the field filters was compared. The filters from the Han river basin and Nakdong river basin showed higher detection of micropollutants (Figure 5). This is due to that there are large population in mega cities such as Seoul, Busan and Daegu which are densely populated areas. In those cities, the usage of micropollutants would be much higher than other places.
Next, the desorption amount can be compared according to existence of advanced oxidation process (AOP) in water treatment plants where the filters are obtained. The advanced oxidation process in Korea is mostly ozone process followed by biological activated carbon. As shown in Figure 6, most compounds were detected lower where AOP process were applied in WTPs. Especially, caffeine, naproxen, bisphenol-A and
(p<0.05). The result shows those advanced oxidation process is effective in removal of micropollutants. This is in agreement with previous studies that reported biological activated carbon filtration following ozonation is effective in removal micropollutants, natural organic matter, taste and odor compounds, disinfection by-product precursors, as well as ozonation transformation products and it can also reduce non-specific toxicity in drinking water treatment (Simpson, 2008; Reungoat et al., 2010; Reungoat et al., 2012).
CFF ACT MTP CBM NPX BPA IBU DCF
Concentration (ng / g carbon)
0.0 0.5 1.0 1.5 2.0 2.5
Han River Geum River Yeongsan River Nakdong River
Figure 5. Comparison of desorption amount of micropollutants from filters according to 4 river basin areas.
Figure 6. Comparison of desorption amount of micropollutants according to existence of advanced oxidation process in water treatment plants (*p<0.05).
3.4. Comparison of desorption in different filters
The desorption amount of 2 different kinds of activated carbon filters was compared. Their pore size and length are different. The pore size of filter A is about 10 μm and filter B is about 1 μm, which the pore size of filter B are 10 times smaller than filter A. The length of filter A is 16 cm and filter B is 8 cm, which also means carbon amount of filter A (130 g d.w.) is about 2 times higher than filter B (60 g d.w.) (Table 6). It is known that the higher carbon amount is, the higher concentration of micropollutants adsorbed in activated carbon filter (Zimmerman et al., 2005). However, when adjusted by carbon amount, the desorption amount of small pore size filter was higher than large pore size filters (Figure 7). Therefore, it can be confirmed that the higher adsorption activity occurs with the smaller pore size filters because they have larger surface area. The enough pore volume of smaller pore size can improve the adsorption capacity of activated carbon (Mangun et al., 1999).
Figure 7. Comparison of desorption amount of micropollutants according to different pore size filters (*p<0.05).
CFF ACT MTP CBM NPX BPA IBU DCF
Concentration (ng / g carbon)
0.0 0.2 0.4 0.6 0.8 1.0 1.2 1.4 1.6 1.8
front filter rear filter
*
3.5. Human health risk assessment of the micropollutants
First, daily intake of PPCPs and EDCs in tap water were estimated based on tap water concentration in this study (Table 11). By applying tap water concentration of micropollutants, average drinking water ingestion rate (1.502 L/day), exposure duration (78.6 year of lifetime) and body weight (according to each age range) based on Korean Exposure factors handbook (Jang et al., 2007) to exposure assessment equation, daily exposure of ingestion intake was calculated (Table 12).
Exposure levels (Estimated daily intake) for the average values of each micropollutants were higher in toddler age group, but it was still in very low level (Figure 8). All compounds have non-carcinogenic effect to human health, so the toxicity values (chronic non-cancer reference dose) of 7 compounds (caffeine, acetaminophen, sulfamethazine, metoprolol, carbamazepine, bisphenol-A, triclocarban) were refer to reference literatures. Hazard quotient was measured by dividing daily exposure value of ingestion by reference dose. Hazard quotient value was very low less than 0.0001, so it means there was almost no non-carcinogenic health effect of micropollutants via drinking tap water (Table 12). That’s
because micropollutants concentration in tap water of this study was very low level so it doesn’t have an adverse effect on human health.
toddler children adult elderly
INGdw (ug/kg-day)
0.0000 0.0002 0.0004 0.0006 0.0008 0.0010 0.0012 0.0014 0.0016 0.0018
CFF ACT SMA MTP CBM BPA TCB
Figure 8. Estimated Daily ingestion intake for each micropollutants.
Table 12. Exposure assessment and risk assessment of micropollutants
group age Body
weight(kg)a CFF ACT SMA MTP CBM BPA TCB INGdw toddler 0-7 13.6 1.6E-04 1.9E-04 2.2E-04 1.1E-05 1.1E-04 1.5E-03 7.4E-05
(µg/kg∙day) children 8-17 45.5 4.7E-05 5.7E-05 6.6E-05 3.3E-06 3.3E-05 4.6E-04 2.2E-05
adult 18-74 62.8 3.4E-05 4.1E-05 4.8E-05 2.4E-06 2.4E-05 3.3E-04 1.6E-05 elderly >=65 60.7 3.5E-05 4.3E-05 4.9E-05 2.5E-06 2.4E-05 3.4E-04 1.7E-05
RfD (µg/kg∙day) 450.00 93.00b 19.00c 14.00d 5.70e 4.00f 625.00g
HQ toddler 0-7 3.5E-07 2.0E-06 1.2E-05 7.9E-07 1.9E-05 3.8E-04 1.2E-07
children 8-17 1.0E-07 6.1E-07 3.5E-06 2.4E-07 5.7E-06 1.1E-04 3.5E-08 adult 18-74 7.6E-08 4.4E-07 2.5E-06 1.7E-07 4.1E-06 8.3E-05 2.6E-08 elderly >=65 7.8E-08 4.6E-07 2.6E-06 1.8E-07 4.3E-06 8.6E-05 2.7E-08
a Korean Exposure factors handbook, Ministry of Environment. 2007
b,C Minnesota department of Health. 2013-2014
d,e Schriks et al. 2010
f European Food Safety Authority. 2015
g Snyder et al. 2013
V. Conclusion
In this study, the various conditions were compared according to desorption tool, several extraction solvents, solvent amount, and mixing time. As a result, this study found the optimized lab-scale experimental condition of PPCPs desorption from powdered activated carbon. The optimized condition is 1 g PAC, 800 mL of acetonitrile, 90 min sonication. This is cost-effective, practical, and useful method for desorption of spent activated carbon compared to other desorption method. Also, the desorption experiment of spent field water filters used in the commercial water purifiers was conducted and compared with the tap water concentration. As a result, this study could detect some micropollutants which is hardly detected if tap water is analyzed directly.
Also, this study could compare amount of micropollutants in spent carbon filters according to regional factors; 4 river basin, advanced oxidation process in water treatment plants. In the filters collected from river basin where mega cities are located, the higher desorption amount of micropollutants was detected. The result also shows that advanced
micropollutants removal than conventional treatment process. When compared according to different pore size filters, more amount of micropollutants was desorbed in smaller pore size filter, which shows smaller pore size filter can adsorb micropollutants more effectively. Also, the result of the risk assessment of drinking tap water shows micropollutants concentration in tap water doesn’t have an adverse effect on human health. In further study by applying the desorption method, unknown micropollutants can be detected from spent activated carbon filters and regional properties of tap water can be compared.
References
Ania, C.O., Menendez, J.A., Parra, J.B., Pis, J.J., 2004. Microwave-induced regeneration of activated carbons polluted with phenol. A comparison with conventional thermal regeneration. Carbon 42, 1383-1387.
Ania, C.O., Parra, J.B., Menendez, J.A., Pis, J.J., 2005a. Effect of microwave and conventional regeneration on the microporous and mesoporous network and on the adsorptive capacity of activated carbons. Micropor Mesopor Mat 85, 7-15.
Ania, C.O., Parra, J.B., Pevida, C., Arenillas, A., Rubiera, F., Pis, J.J., 2005b.
Pyrolysis of activated carbons exhausted with organic compounds. J Anal Appl Pyrol 74, 518-524.
Benotti, M.J., Trenholm, R.A., Vanderford, B.J., Holady, J.C., Stanford, B.D., Snyder, S.A., 2009. Pharmaceuticals and endocrine disrupting compounds in U.S. drinking water. Environ Sci Technol 43, 597-603.
EFSA, 2015. European Food Safety Authority. Scientific opinion on bisphenol A. 1-4.
Focazio, M.J., Kolpin, D.W., Barnes, K.K., Furlong, E.T., Meyer, M.T., Zaugg, S.D., Barber, L.B., Thurman, M.E., 2008. A national reconnaissance for pharmaceuticals and other organic wastewater contaminants in the United States--II) untreated drinking water sources. The Science of the total environment 402, 201-216.
Gomez, M.J., Bueno, M.J.M., Lacorte, S., Fernandez-Alba, A.R., Aguera, A., 2007. Pilot survey monitoring pharmaceuticals and related compounds in a sewage treatment plant located on the Mediterranean coast. Chemosphere 66, 993-1002.
Chem Res 41, 1344-1351.
Halling-Sorensen, B., Nors Nielsen, S., Lanzky, P.F., Ingerslev, F., Holten Lutzhoft, H.C., Jorgensen, S.E., 1998. Occurrence, fate and effects of pharmaceutical substances in the environment--a review. Chemosphere 36, 357-393.
Jang, J.Y., Jo, S.N., Kim, S.Y., Kim, S.J., Cheong, H.K., 2007. Korean exposure factors handbook. Ministry of Environment, Seoul, Korea, 3-224.
Karanfil, T., Dastgheib, S.A., 2004. Trichloroethylene adsorption by fibrous and granular activated carbons: Aqueous phase, gas phase, and water vapor adsorption studies. Environmental Science & Technology 38, 5834-5841.
Kasprzyk-Hordern, B., Dinsdale, R.M., Guwy, A.J., 2008. The occurrence of pharmaceuticals, personal care products, endocrine disruptors and illicit drugs in surface water in South Wales, UK. Water Res 42, 3498-3518.
Kim, S.D., Cho, J., Kim, I.S., Vanderford, B.J., Snyder, S.A., 2007. Occurrence and removal of pharmaceuticals and endocrine disruptors in South Korean surface, drinking, and waste waters. Water Res 41, 1013-1021.
KME, 2007. Korea Ministry of Environment, The 3th investigation of the amount of chemical usage. Research report, 138-199.
KPMA, 2003. Korea Pharmaceutical Manufacturers Association, Statistics of Korea Pharmaceutical Manufacturers Association, 6.
Ledesma, B., Roman, S., Sabio, E., Alvarez-Murillo, A., 2014. Aqueous thermal desorption as an effective way to regenerate spent activated carbons.
J Supercrit Fluid 85, 24-30.
Leung, H.W., Jin, L., Wei, S., Tsui, M.M.P., Zhou, B.S., Jiao, L.P., Cheung, P.C., Chun, Y.K., Murphy, M.B., Lam, P.K.S., 2013. Pharmaceuticals in Tap Water: Human Health Risk Assessment and Proposed Monitoring Framework in China. Environ Health Persp 121, 839-846.