저작자표시-비영리-변경금지 2.0 대한민국 이용자는 아래의 조건을 따르는 경우에 한하여 자유롭게
l 이 저작물을 복제, 배포, 전송, 전시, 공연 및 방송할 수 있습니다. 다음과 같은 조건을 따라야 합니다:
l 귀하는, 이 저작물의 재이용이나 배포의 경우, 이 저작물에 적용된 이용허락조건 을 명확하게 나타내어야 합니다.
l 저작권자로부터 별도의 허가를 받으면 이러한 조건들은 적용되지 않습니다.
저작권법에 따른 이용자의 권리는 위의 내용에 의하여 영향을 받지 않습니다. 이것은 이용허락규약(Legal Code)을 이해하기 쉽게 요약한 것입니다.
Disclaimer
저작자표시. 귀하는 원저작자를 표시하여야 합니다.
비영리. 귀하는 이 저작물을 영리 목적으로 이용할 수 없습니다.
변경금지. 귀하는 이 저작물을 개작, 변형 또는 가공할 수 없습니다.
공학박사학위논문
액상성형공정의 이중구조를 가지는 다공성 매질에서의 불포화 유동 양상
Unsaturated Flow Behavior in
Double Scale Porous Media during LCM Process
2014 년 8 월
서울대학교 대학원
기계항공공학부
김 성 하
액상성형공정의 이중구조를 가지는 다공성 매질에서의 불포화 유동 양상
Unsaturated Flow Behavior in
Double Scale Porous Media during LCM Process
지도교수 이 우 일
이 논문을 공학박사 학위논문으로 제출함
2014 년 7 월
서울대학교 대학원
기계항공공학부
김 성 하
김성하의 공학박사 학위논문을 인준함
2014 년 7 월
위 원 장 : 조 맹 효 부위원장 : 이 우 일 위 원 : 안 성 훈 위 원 : 엄 문 광
위 원 : Chung Hae Park
1
Unsaturated Flow Behavior in Double Scale Porous Media
during LCM Process
Sung Ha Kim School of Mechanical and Aerospace Engineering Seoul National University
Abstract
The liquid composite molding process is cost efficient and has the capacity to create fine designs. To obtain high-performance composite materials which have good mechanical properties, continuous fibrous preform needs to be applied with resin transfer molding, which is a typical liquid composite material process. In order to optimize the resin transfer molding process and thus enhance the productivity and quality of the product, it is vital to establish the flow behavior of the porous media during the injection. To analyze the porous media flow, it is effective to utilize the Darcy’s law, which includes a parameter called permeability. Permeability is a
2
parameter which reflects the structure and shape of the porous media. Many studies, however, have reported that unsaturated and saturated permeability are different. In this study, the difference between unsaturated and saturated permeability is explained by void formation during the injection. Pressure profiles with void content and the mechanical properties of an unsaturated flow depending on a constant flow rate were provided to confirm the influence of voids during an injection. The development of the sink effect and a multiphase flow model are suggested to interpret the difference between an unsaturated and a saturated flow. Finally, saturated permeability depending on the flow conditions and cross-sections of the tow depending on the flow rate were investigated to assess the effect of tow deformation.
Keywords: Liquid composite molding (LCM), resin transfer molding (RTM), permeability, void, sink effect, tow deformation
Student Number: 2008-22871
3
Table of contents
1. Introduction ... 8
1.1. Liquid composite molding ... 8
1.2. Permeability characterization ... 11
1.3. Literature review ... 14
1.4. Research objectives and scope ... 16
2. Experimental procedure ... 18
2.1. Material ... 18
2.1.1. Resin system ... 18
2.1.2. Unidirectional glass fiber mat ... 20
2.2. Experimental setup and procedure ... 21
2.2.1. Pressure measurement setup ... 21
2.2.2. Resin transfer molding composite specimen manufacturing for the mechanical test and observation of cross-sections ... 22
3. Effect of void formation on an unsaturated flow ... 24
3.1. Pressure profiles of an unsaturated flow depending on the flow rate ... 24
3.2. Void content and mechanical properties ... 26
4. Model development and verification of the pressure profile ... 27
4.1. Unsaturated flow and saturated flow ... 27
4.2. Sink effect modeling ... 31
4.3. Multiphase flow modeling ... 35
4.4. Comparison between unsaturated and saturated permeability measurements ... 39
5. Tow deformation effect ... 42
5.1. Dependence of saturated permeability on the flow rate ... 42
4
5.2. Observation of void formation and migration in a saturated flow ... 43
5.3. Tow deformation depending on the flow rate ... 44
6. Conclusions ... 45
References ... 48
Figures ... 53
Tables ... 88
5
List of Figures
Figure 1. Overall approach of the study Figure 2. Viscosity of the engine oil Figure 3. Double-scale glass fiber mat
Figure 4. Typical raw pressure data of the pressure measurement Figure 5. Pressure profiles of the 50, 100, 200, and 400 mm
3/s Figure 6. Pressure profiles in saturated and unsaturated flows
Figure 7. Void content and mechanical properties depending on the flow rate Figure 8. Flow characteristics of saturated and unsaturated flows
Figure 9. Permeability measurement methods
Figure 10. Pressure profile at different time instants for the saturated flow (Q
in=100mm
3/s)
Figure 11. Pressure profile for unsaturated flow
Figure 12 Photos at different time instants showing the migration of an air void
during the mold filling process
6
Figure 13. Experimental data of the pressure profile for an unsaturated flow with inter-bundle voids (Q
in=50 mm
3/s)
Figure 14. Modeling of porous media flow with channel void
Figure 15. Ratio of unsaturated permeability to saturated permeability for the constant flow rate injection
Figure 16. Ratio of unsaturated permeability to saturated permeability for constant inlet pressure injection
Figure 17. Raw data of the continuous saturated flow pressure measurement Figure 18. Permeability behavior of silicone fluids depending on the flow rate Figure 19. Void in the saturated flow and void migration when increasing the flow rate
Figure 20. Locations of the specimens for the observation of the tow deformation
Figure 21. Horizontal and vertical length of the tow deformation
Figure 22. Horizontal and vertical length of the tow depending on the location
and flow rate
7
List of Tables
Table 1. Properties of the Epoxy Resin Table 2. Properties of the Silicone Oil
Table 3. Properties of the Fiber Reinforcement and Injection Liquid
8
1. Introduction
1.1. Liquid composite molding
Composite materials are emerging as effective substitutes for classical materials such as metal/alloys and ceramics. From the mid 1900’s, composite materials have been widely used in high-technology applications such as those in the aerospace industry due to their outstanding properties. The application for the mass production in composite materials, however, had been limited to certain products on account of the difficulty in controlling the quality and low productivity compared to products based on classical materials. Fundamentally, composite materials are made of more than two types of materials. For structural parts, composite materials consist of a resin which can be divided into two categories, thermosets and thermoplastics, and reinforcements which can be typified by glass fibers and carbon fibers. A single type of material can be managed simply by concentrating the process system into the material, while a composite material needs to consider the mixing, interface, and interactions between two or more materials. Therefore, composite material manufacturing has focused on non-mass-productive products which enable high performance, such as aircraft structures and wind turbine blades. There are products which use short fibers and powders mixed with resins for light-weight, non-structural products such as the interiors of automobile and housing, but productivity is valued more for these products.
To extend the application of composite materials, much effort had been made with
9
regard to enhancing the composite molding processes. On account of these efforts, the field of composite materials continues to grow [1, 2].
The most promising field of composite materials which attracts the most attention is the automobile industry. Composite materials have been used in automobile manufacturing since the 1950s. At that time, non-structural parts such as trunk partition interior were made of natural fiber composite materials. Given that the manufacturing of exterior and structural parts requires higher mechanical properties compared to interior non-structural parts, the process needs to focus on quality control; i.e., it is not appropriate for mass production due to its low productivity. Therefore, high-quality composite materials for automobile were limited to certain products such as custom- made high-performance sport cars. As the concern over environmental issues increases globally, however, composite materials which can satisfy both the mechanical properties required for automobile structures and the low weights for low fuel consumption are entering the spotlight [3-6].
To replace classical materials with composite materials, the mechanical properties have to be controlled to satisfy the automobile industrial standards while processes must also be optimized. When composite materials are used for nonstructural parts of automobiles, they do not require mechanical properties as strong as their structural parts; for this reason, reinforcing fibers are mixed with the resin by an extruder and injected into the mold for high productivity. Continuous fiber reinforcement is required, however, to ensure good mechanical properties, of the type that are difficult to produce
10
by an extrusion and injection process using thermoplastic resin. Therefore, composite material manufacturing process which can deal with continuous fibers needs to be considered. One of the candidates is liquid composite molding, which utilizes a liquid- type resin which is injected into the mold. Among liquid composite moldings, resin transfer molding is a process which uses a mold, where fiber including reinforcement continuous molding is installed before the injection. The process is accomplished after curing the resin with heat, which induces a cross-linking reaction in the resin. The general merits of resin transfer molding are its low cost and low-energy process when making products with complex geometries. The mold and tools are simple relative to other processes and the applied pressure and temperature are also low; moreover, given that the process uses a mold with reinforcements inside, the design of the product can be complex compared to other processes, such as compression molding. The issues of the resin transfer moldings include its long product cycle and impregnation including void control. The reason for the long product cycle is mainly the curing time. There are many studies on shortening the cycle time by reducing the curing cycle using rapid- curing resins. Because the mold of the resin transfer molding process is filled with fiber reinforcement, the resin needs to be impregnated during the injections. Early research on resin transfer molding were focused on the global mold flow from a macroscopic viewpoint to prevent defects such as dry spots, where resin impregnation is not accomplished during the flow. Due to the efforts of these researchers, the flow during resin transfer molding injection can be predicted by flow prediction procedures such as computer-aided simulations, and mold designs, including inlet and outlet
11
designs, can be suggested to eliminate dry spots effectively. It is also important to control microscopic impregnation; however, this is especially true for mechanical properties [2].
Microscopic impregnation affects the formation of voids inside the fiber reinforcement in the mold. Void formation can depend on the structure of the reinforcement and flow conditions such as the pressure, velocity, and surface tension. Once the voids are formed in the fiber reinforcement, they can migrate depending on flow conditions or stay inside the reinforcement and lower the mechanical properties of the final composite material product as defects [void formation]. Voids inside the reinforcement not only act as defects in the final product but also affect the flow during the injection.
The effects of the voids during the flow are not well established because the main variables related to the flow interact with each other in a complicated manner [7].
1.2. Permeability characterization
Generally, the fiber reinforcements in the mold for resin transfer molding can be regarded as porous media. When the resin is injected into the mold, the resin flows through small gaps between the fibers. To establish the flow behavior through the porous media, Darcy’s law is effective.
K P A
uDQ
(1)
12
In Darcy’s law, there is a parameter called permeability. Permeability is a key parameter in Darcy’s law, as it reflects the structure and the shape of the porous media.
If the porosity of the porous media, which is inversely proportional to the volume fraction of the fiber volume fraction of the composite material, is small, fluid does not flow well through porous media. By utilizing permeability, flows through porous media, including resin flows during resin transfer molding, can be predicted. To predict a flow through a certain porous media, the permeability should be known. Therefore, permeability is measured experimentally by a simple experimental setup such as one- dimensional porous flow or can be estimated by the modeling of simplified porous media inner structures. There are, however, many factors which affect the measurement and prediction of permeability [8].
There are two types of permeability: one is saturated permeability and the other is unsaturated permeability. Saturated permeability is measured after the porous media is impregnated by the fluid such that there are no factors which affect the flow except for the porous structure, and unsaturated permeability is related to the flow during the impregnation. For unsaturated permeability, there can be further considerations compared to saturated permeability.
In front of the flow during the impregnation process, a dry area and wet area exist together, and the wet area embraces the dry area it becomes a void. Depending on the porous media structure and flow conditions, the formation of voids can vary. Because most of the resin transfer molding process applies constant inlet pressure and given that
13
the cross-section may change, the flow velocity varies as flow the advances. Therefore, formation of voids also varies. In addition, unsaturated permeability can be affected by voids, and it varies depending on time and position, even while the structure and shape of the porous media remains [14]. Therefore in many studies, unsaturated permeability and saturated permeability are measured by various method and flow conditions.
However, it is reported that ratio of the saturated and unsaturated permeability differs depending on the measuring method and flow condition [9].
In order to establish the permeability of an unsaturated flow, the flow behavior, including void formation of the flow front, should be investigated. If the porous media is a thoroughly homogeneous flow which advances uniformly and does not split into dry and wet areas, there will be few void formations and the unsaturated permeability may be uniform. Porous media, however, consist of fibers, and the diameter of the typical glass fiber used for the resin transfer mold is about 10~20 micrometers.
Therefore, dense and sparse micro-scale areas can exist. This difference leads to a heterogeneous porous media which forms void at the flow front. When voids are formed at the flow front, they can shrink, migrate with the flow, or divide and join each other. It is crucial to know these void behaviors, as these voids are related to the mechanical properties of the final product [7]. However, voids are not only defects but also affect the flow during the injection. If the mechanism of the influence of the void on porous flow is known, the flow of the resin can be estimated more precisely and the formations and migrations of voids can be controlled.
14
Voids can be regarded as the main factor which affects the flow of porous media of the flow front area during resin injection as part of the resin transfer molding process, but when the flow passes the porous media and the flow front advances, a saturated area of porous media appears from the inlet area. In the saturated area, the effect of the void decreases and the structure and shape of the porous media have the greatest effect on the permeability. Not only does it form the void inside the flow, injected resin can also cause a deformation of the porous media by flowing between the fibers. Because the flow of the saturated area passes through the porous media and affects the unsaturated flow, both voids and deformation in porous media need to be investigated to establish the unsaturated flow conditions [10].
1.3. Literature review
The flow behavior of the liquid composite molding process had been investigated from various angles. First, macroscopic predictions of the mold flow are important to utilize the liquid composite molding process. In order to design the inlets and outlets through which the porous media can be impregnated by the resin thoroughly, accurate simulations of a porous media flow are necessary. Kang et al. suggested modified control volume finite element method (CVFEM) method to yield smoother flow front and reduced the pressure error at the flow front that plagued the conventional fixed grid method [11]. A simulation for liquid composite material was applied to the natural
15 fiber preforms by Masoodi et al. [12].
For accurate prediction of a simulation, it is vital to apply a suitable governing equation. Pillai et al. suggested governing equations and developed a multiscale model for an unsaturated flow in liquid composite molding [13, 14].
Voids in the final product of the composite materials act as crucial defects which decrease the mechanical properties drastically. Therefore, there are many studies of voids in the liquid molding process. Kang et al. investigated the formation of voids during the resin transfer molding process. They claimed inhomogeneity of the fiber architecture leads to non-uniform permeability in the fibrous preform, and the velocity difference due to this non–uniform permeability forms the void [15]. Voids which form during the resin infiltration can migrate according to the flow condition. Lee et al.
analyzed void minimization characteristics by investigating the void migration conditions [16].
The influence of the tow deformation on flow has also been studied. Demaria et al.
studied the characteristics of in-plane anisotropic permeability of deformed woven fabrics by experiments and numerical simulations [17, 18]. Francucci et al. studied compaction responses with natural fiber and glass fiber preforms [19]. Deleglise et al.
suggested simulations of liquid composite molding processes involving induced or forced deformations [20].
16 1.4. Research objectives and scope
It is effective to utilize Darcy’s law to investigate the porous media flow of the liquid composite molding process, and in order to utilize Darcy’s law, precise establishment of the permeability is required. Permeability is regarded as property of the porous media and therefore should reflect the structure and shape, including the volume fraction. For a saturated flow, this is in good agreement with the actual situation of the process; however, saturated flows in many studies reported that the permeability of an unsaturated flow varies depending on the flow situation and that it was different from the permeability of a saturated flow. The main reason for this difference is that dry and wet areas exist together in the flow front area, forming voids in the flow to affect the flow behavior. Because void formation is caused by an uneven resin flow induced by a heterogeneous porous structure, it would be effective to investigate this phenomenon with clearly heterogeneous porous media. Therefore, a unidirectional glass fiber mat with a tow bundle is selected as the porous media for this study. This mat consists of fiber bundles formed with about 1,000 glass fiber filaments. The diameters of the filaments are on the micrometer scale, and channels between the tow bundles are on the millimeter scale, such that the porous media can regarded as double-scale porous media. With this double-scale porous media, the formation and influence of voids in the flow front will be investigated.
In chapter 2, experimental setup and procedure will be illustrated for pressure profile measurements and for the manufacturing the composite material specimens produced
17 by resin transfer molding.
In chapter 3, the pressure profiles of an unsaturated flow will be shown with the void content and mechanical test results to confirm the influence of a void during the injection.
In chapter 4, development of a model which can explain the influence of the void will be done with a sink model and a multiphase flow model.
In chapter 5, deformation for double-scale porous media is shown by investigating a saturated flow. Pressure profiles depending on the flow conditions and cross-sections of the tow will be shown.
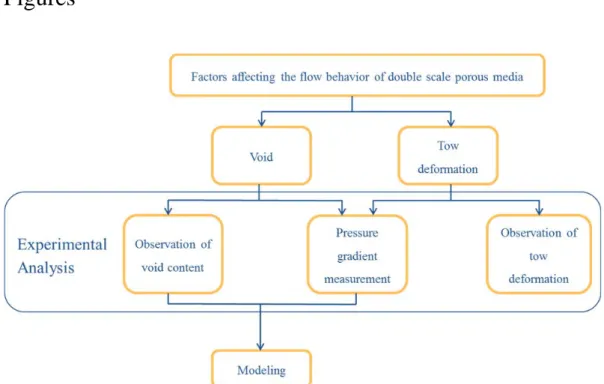
The overall approach of the study is shown in Figure 1.
18
2. Experimental procedure
2.1. Material
2.1.1. Resin system
Three types of resins were used for the specific purpose of the experiment. Engine oil (Kixx PAO 5W50 by GS Caltex, Korea) was used for the unsaturated flow pressure profile measurement. It would be best to use a resin identical to that used in industrial fields, but it is not easy to handle an epoxy resin during a pressure profile measurement experiment because the resin cures slowly even when no heat is applied. Moreover, cleaning the cured resin would be difficult and the pressure transducers and mold can be affected by the cured resin. Therefore, engine oil, which has similar properties with epoxy resin and chemical stability, was chosen as the fluid system for the pressure profile measurement experiment with an unsaturated flow in the liquid molding process.
Epoxy resin was used to manufacture the specimen for the mechanical property test and to observe the cross-sections. KFR-130 epoxy resin and KFH-140 hardener from Kukdo Chemical in Korea were used in the experiment. The mass ratio of epoxy and hardener was 10:3, and the viscosity and the density of the epoxy-hardener mixture were similar to those of engine oil. The specific properties of epoxy, hardener, and mixture of these materials are shown in Table 1.
19
In order to investigate the influence of the fluid conditions on permeability, various fluid properties need to be applied to the experiment. To satisfy these needs, fluids which have a broad range of properties, such as density and viscosities, are required.
Therefore, various types of silicone oil (KF-96 series) produced by Shin Etsu were used for the experiment. The specific properties of the silicone oils are provided in Table 2.
Because thermoset resin including a mixture of hardener and epoxy resin cures slowly even when heat is not applied, it can affect the pressure transducers installed in the mold. Therefore, engine oil was used in the pressure profile measurement experiment.
However, it was found that the formation of voids depends on the modified capillary number [25, 26]. Because the pressure profiles obtained from the experiment with the engine oil resin system was investigated to study the LCM process with thermoset resins, the modified capillary number of each liquid needs to be similar.
Factors which determine the modified capillary numbers are the viscosity, surface tension, and flow velocity. The flow velocity will be identical if the flow rate is the same; however, viscosity and surface tension needs to be measured. Therefore, viscosity of the resin was measured by rheo-meter (Rheostress-1, HAAKE), and the contact angles were measured by an optical microscope. The viscosity of the engine oil is show in Figure 2. Because the viscosity of the epoxy and hardener mixture from the data sheet at room temperature is 0.2 to 0.3 pa·s, it will be similar to the viscosity of the
20
engine oil in the experimental environment. The contact angles of the liquids were observed by an optical microscope with an x1200 zoom scale. The average contact angles were 22.7±1.43° and 27.8±3.63° for the epoxy and engine oil, respectively. The surface tension calculated from these average contact angles were 6.12 N/m and 6.38 N/m for each liquid, showing that engine oil is acceptable to replace epoxy resin in pressure profile measurement experiment.
2.1.2. Unidirectional glass fiber mat
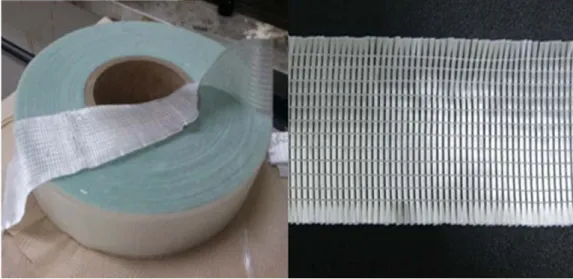
Because this study deals with the flow conditions and void formation according those conditions, identical glass fiber mats were used for every experiment. Non-crimp unidirectional glass fiber mats manufactured by Owens Corning were used in this work.
Each mat contains glass fiber tow bundles which consist of about 1,000 glass fiber filaments. The diameter of each glass fiber filament is 16 micrometers. The width and height of each tow bundle are about 1.5mm and 0.5mm, respectively. The gap between the bundles of the glass fiber tow is on the order of 0.1 millimeter, and gap between the glass fiber filaments is on the order of 10 micrometers. The volume fraction of the each tow is about 65%.
An image of the glass fiber mat is shown in Figure 3.
21 2.2. Experimental setup and procedure
2.2.1. Pressure measurement setup
Because the pressure inside the flow reflects the flow behavior, it is effective to use it to monitor the pressure changes during the injection depending on the flow conditions.
Mold with a cavity 500 x 55 x 3 mm was used for the experiment. The bottom of the mold was made of SUS 403 stainless steel which was coated with blue paint to observe the flow easily, and the upper mold was made of 25-mm-thick tempered transparent glass, allowing the fluid flow and void formation to be observed during the flow. The upper and bottom mold were clamped by hydraulic pressure applied from a compressor.
A glass fiber mat was placed in the mold before the injection with a volume fraction of about 40%.
Pressure transducers were installed along the mold to measure the pressure from 0 to 100,000 Pa. The nearest pressure transducer from the inlet was placed 100 mm from the inlet, and six more pressure transducers were placed along the flow direction with intervals of 60 mm. Pressure transducers were used to collect the pressure data at a data logger at a rate of five data instances per second continuously. Engine oil and silicone oil were injected by a pump which could control the volume flow rate.
The pressure profiles of unsaturated and saturated flows were measured during the constant flow rate injection. The flow rates of engine oil for the unsaturated flow were 50, 100, 200, and 400 mm3/s, covering the flow rates of constant inlet pressure cases
22
used in actual industry. For the saturated flow pressure measurement, flow rates of 25, 50, 100, 200, 400, and 800 mm3/s were injected in every cases, with additional flow rates of 1,200 and 1,600 mm3/s injected for the 100cs and 350cs KF-96 silicone oil, respectively.
2.2.2. Resin transfer molding composite specimen manufacture for mechanical test and observation of cross-sections
Specimens of the composite material were created to test the mechanical properties of the composite materials and to observe the cross-sections in order to investigate the voids. The geometry of the mold was identical to that of the pressure measurement mold. Glass fiber mats also placed in the mold, identical to pressure measurement case.
Epoxy resin was prepared by mixing KFR-130 (epoxy resin) and KFH-140 (hardener) followed by degassing in a vacuum chamber about 20 minutes. Epoxy resin was also injected by a pump with the same volume flow rate for comparison. In order to cure the epoxy resin, heat wires were installed in the upper and bottom of the mold and a thermocouple was placed in the mold to maintain the curing temperature by feedback control of the heat wires.
Specimens for the mechanical test and to assess the void content of the final products were made from a process which cured the epoxy resin after saturating the porous media in the mold. Saturation was confirmed when the resin flow of outlet does not
23
contains a void. Specimens for the observation of void formation and migration need to be similar to a flowing situation which contains a void inside porous media. Therefore, porous media should not be impregnated completely so as to remain in an unsaturated flow situation. In order to make specimens similar to an unsaturated flow, curing was started when the flow reaches the outlet. In that the saturated specimens were cured after the voids had gone through the outlet, it is obvious that voids which are had gone out after the flow front of the epoxy resin reaches the outlet are inside the porous media of the unsaturated flow, as it can be observed after curing. Although the viscosity of epoxy resin changes dramatically, there is no driving force to make the epoxy resin flow; therefore, a situation with a flowing state can be illustrated by this method. The locations of the specimen in the saturate and unsaturated cases are shown in Figure 22.
24
3. Effect of void formation on unsaturated flow
3.1. Pressure profiles of an unsaturated flow depending on the flow rate
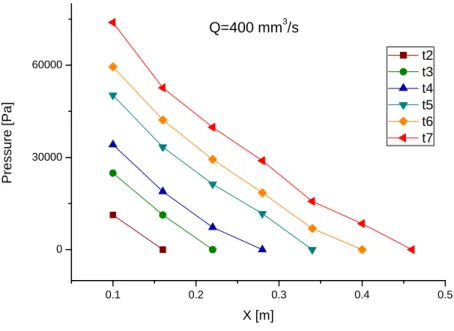
The flow front of an unsaturated flow contains voids, and these voids affect the flow, which can be reflected by the pressure change. The influence of a void will change depending on the flow conditions. It is well known that the formation of voids depends on the capillary number [7]. If constant pressure is applied at the inlet, there will be high capillary number at the beginning of the injection due to the short flow length and a low capillary number at the end of the flow. Therefore, the formation of the void will vary along the flow and influence of the void is obscured. Therefore, a constant flow rate is applied at the inlet of the mold. A low flow rate, e.g., 50 mm3/s, can be regarded as the flow near the outlet when the injection is almost finished, and a high flow rate such as 400 mm3/s represents the flow at the beginning of the injection near the inlet.
Typical raw data from the pressure transducer is shown in Figure 4. As the flow front reaches the pressure transducer, the pressure starts to rise. When the flow reaches the outlet pressure or when every point of the pressure transducer stops rising, it maintains its pressure. The pressure change of each pressure transducer reflects the flow condition affected by the void. The raw data, however, shows the pressure change of each pressure transducer over time, and it is not effective to check the change of pressure gradient along the flow. Therefore, the data are rearranged to express the pressure profiles of a certain time. Pressure values at the time when the flow front
25
reaches every pressure transducer were chosen for the rearrangement, and the pressure data of each pressure transducer were collected to show the pressure profile. The pressure profiles of the each flow rates are shown in Figure 5.
At a flow rate of 100 mm3/s, it can be seen that the pressure profile is more linear than it is in other flow rate cases. A linear pressure profile is shown from the early stage of the flow and maintains high linearity until flow front reaches the outlet. Other pressure profiles are nonlinear. For the 50 mm3/s case, the pressure gradient near the inlet remains low, while the pressure gradient between the second and third increases rather rapidly. From the third pressure transducer to the last one, the pressure gradient decreases. Therefore, convex-shaped line can be seen in the beginning of the graph and a concave line can be seen at the end of the graph at every moment.
For the 200 and 400 mm3/s cases, a similar tendency is shown in the results. The pressure gradient is steep near the inlet but it starts to decrease at the outlet. Therefore, the graphs consist of concave lines of pressure profiles.
These tendencies of the pressure profile at different flow rates can be seen more clearly after normalization.
Figure 6 is the normalized pressure profiles of each flow rate according to the 100 mm3/s result. As shown in the graph, the pressure profile of the 100 mm3/s case has higher linearity than the other cases. In the 50 mm3/s case, the pressure gradient is lower than that of the 100 mm3/s case near the inlet, but it becomes steeper in the
26
middle section and becomes lower again near the outlet. For the 200 and 400 mm3/s cases, the pressure gradient is steeper near the inlet and continues to decrease until the outlet.
3.2. Void content and mechanical property
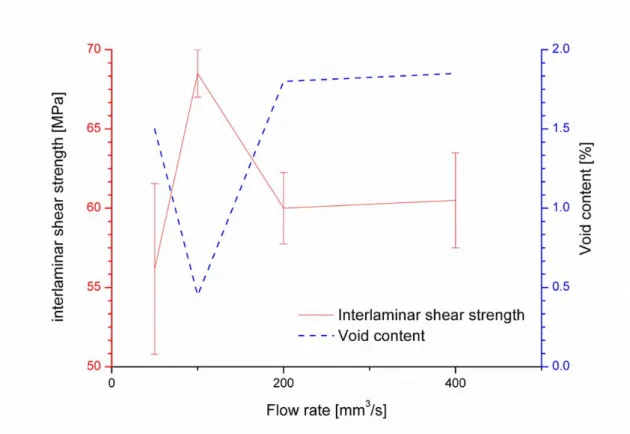
Figure 7 shows the dependence of the void content on the flow rate applying to the manufacturing of a composite plate with epoxy resin. At the intermediate flow rate, viz.
100 mm3/s in this case, the void content was the lowest and the corresponding mechanical properties were the highest. At the low flow rate (50 mm3/s), most of the voids were found at the open gap between the fiber tows. At the high flow rates of 200 and 400 mm3/s, most of the voids were found inside the fiber tow, even if there were some inter-bundle voids, especially in the case of 400 mm3/s. From the void content measurement results, we can assume the flow behavior according to the void formation process shown in Figure 8. We will regard the case of minimum void formation (100 mm3/s) as a saturated flow, whereas the other liquid flows with void generation (50, 200, and 400 mm3/s) will be considered as unsaturated flows.
27
4. Model development and verification of the pressure profile
4.1. Unsaturated flow and saturated flow
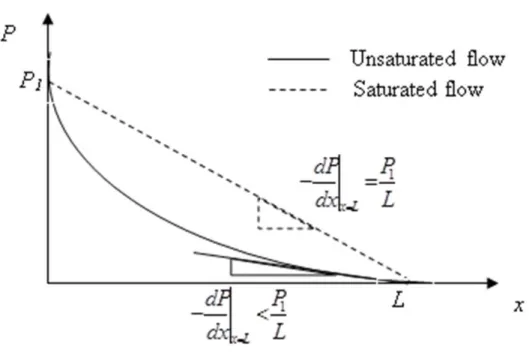
Liquid composite molding (LCM) processes such as the resin transfer molding (RTM) process and the vacuum-assisted resin transfer molding (VARTM) process are widely employed to manufacture large and complex parts for aeronautic applications in a cost- effective way. The main principle of these manufacturing techniques is the impregnation of dry fiber reinforcement by a liquid resin. Hence, the analysis of the resin flow in the fiber reinforcement is an important subject for the optimization of the process. In general, a resin flow in the LCM process is regarded as a Newtonian flow in a porous medium, which can be modeled by Darcy’s law [8].
K P A
uDQ
(1)Here, uD is the volume-averaged resin velocity, Q is the flow rate, A is the cross-section, K is the permeability of the reinforcement,
is the resin viscosity and P is the resin pressure.In particular, the reinforcement permeability is a key parameter for the resin flow. To measure the permeability, two experimental methods are generally used. The first is a saturated permeability measurement in which the pressure drop between two distant
28
points and the flow rate of a steady flow in the fully saturated reinforcement are measured (Figure 9 (a)).
1 2
/
P PL A Q dx dP A Ksat Q
(2)In this equation, Ksat is the saturated permeability, L is the distance between two pressure sensor positions and P1 and P2 are the fluid pressure values at each sensor location.
The second is an unsaturated permeability measurement in which the flow front advancement with time is recorded in a transient flow (Figure 9 (b)).
22
11
Ltt P Kunsat Vf
(3)
where Kunsat is the unsaturated permeability; Vf is the fiber volume fraction; t is the time instant and L(t) is the distance from the liquid inlet to the flow front, which changes with time. It should be noted that for both the permeability measurement methods, the pressure gradient is obtained with the assumption of a linear pressure distribution, as expressed in the following relationship.
L
P P dx
dP 1 2
(4)
In general, the permeability of fiber reinforcement is assumed to be determined
29
exclusively by the properties of the reinforcement microstructure, such as the size and the connectivity of pores. Therefore, the permeability is supposed to have the same value for a given fiber reinforcement regardless of measurement method. It has been reported, however, that the saturated permeability value and the unsaturated permeability value may be different for the same reinforcement [9, 21]. In many cases, the unsaturated permeability values are lower than the saturated permeability values [22]. Moreover, the permeability value may differ even for the same measurement method, especially for the unsaturated permeability measurement, depending on processing conditions such as the resin pressure and resin velocity [22, 23]. A widely accepted explanation found in the literature for the discrepancy between the saturated and unsaturated permeability values is that the air voids formed during the mold filling process, viz. during an unsaturated flow, alter the global resin flow behavior [7, 21].
To address this issue, the relative permeability, which is the ratio of the unsaturated permeability to the saturated permeability, is often adopted to model an unsaturated flow. In general, the relative permeability is represented in terms of the degree of saturation, which is the ratio of liquid volume to the pore volume [24]. This approach which has been widely employed in soil mechanics, may not be relevant to a composite manufacturing process analysis, however, because the microstructure of fiber reinforcements used in the LCM processes are quite different from that of soil. The most distinguishing feature of the fiber reinforcement microstructure is its dual-scale porosity, whereas soil can be characterized by its single-scale porosity [25]. In dual-
30
scale porosity reinforcement, there are two types of pores with different pore sizes: the micropores inside the fiber tow and the macropores between the fiber tows. As there are two different pore types, we can observe two types of air voids in LCM processes:
intra-bundle voids inside the fiber tow and inter-bundle voids between the fiber tows [7, 15, 25, 26]. As the position and the size of these two types of voids are different, their influence on the global resin flow may differ as well. It has been reported that the void formation, i.e., the content and the location of a void in the LCM process with specific fiber reinforcement, can be obtained by the modified capillary number (Ca*), which is the ratio of the viscous force to the surface tension [7, 15, 26-27].
* cosuD
Ca (5)
where is the surface tension and θ is the contact angle. Given the liquid type and fiber reinforcement, therefore, the void formation is determined by the resin velocity or flow rate.
In this work, we observed unsaturated flow behavior in fiber reinforcement with a dual-scale porous microstructure by measuring the liquid pressure distribution during the mold filling process. To find the correlation between the void formation and the global resin flow behavior, a test liquid was done at a constant flow rate that generates a constant number of voids. The pressure distribution was measured with time during the liquid flow, and this measurement was performed with different constant flow rate
31
values. To obtain the content and positions of air voids, an epoxy resin was injected into the same fiber reinforcement used for the pressure measurement. Then, microscopic image analysis and mechanical tests were conducted with the cured parts.
Finally, a theoretical model was proposed to describe the unsaturated flow behavior and the ratio of the unsaturated permeability to the saturated permeability in terms of void content, resin properties and fabric microstructure.
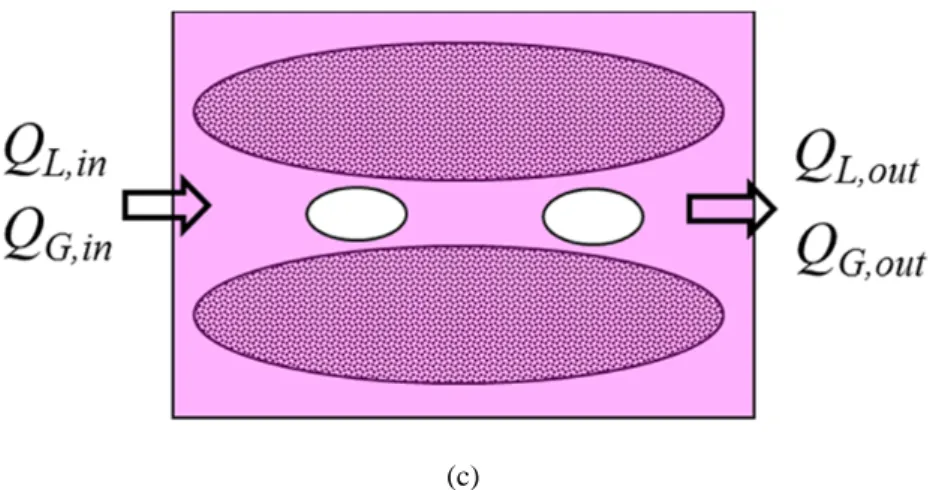
4.2. Sink effect modeling
Assuming that there is no flow-induced fiber deformation which may change the microstructure of the fiber reinforcement during the mold filling process, the permeability of a given preform is assumed to have a fixed value regardless of the liquid injection condition (e.g., the injection pressure and flow rate) and of the liquid properties (e.g., the viscosity and surface tension), as the permeability is determined exclusively by the microstructure of the porous medium. Thus, we investigated the mass conservation equation in cases of a saturated flow and an unsaturated flow. For convenience, we consider a control volume which is small but sufficiently large to contain some fiber tows, as represented in Figure 8 (a). In this figure, the subscripts “in”
and “out” represent how the fluid enters and leaves the control volume, respectively.
In the case of a saturated flow (Figure 8 (a)), we note that the liquid volume rate entering the control volume (Qin) is identical to that leaving the control volume (Qout).
32
Hence, the mass conservation equation for an incompressible liquid flow can be described by the following relationship if the liquid flow in the fiber reinforcement is modeled by Darcy’s law.
0
K P
u sat
(6)If the permeability and the viscosity are constant, the pressure distribution is assumed to be linear in the case of a rectilinear flow, which can be verified by the pressure measurement data for a saturated flow, viz. 100 mm3/s in this case (Figure 6 (a)).
For an unsaturated flow with intra-bundle voids, however, the mass conservation equation should be modified. As shown in Figure 8 (b), there is a liquid flow from the open gap into the fiber tow, which is denoted as QT. Subsequently, we can establish the following relationships regarding the mass conservation for an unsaturated flow with intra-bundle voids.
QinQoutQT (7)
Ksat P qT
u
(8)Here, qT is a mass sink term denoting the volumetric flow rate per unit volume from the open gap between the fiber tows into the fiber tow [28, 29]. For a rectilinear flow with a constant flow rate at the inlet (Qin), the pressure profile can be expressed in a
33
parabolic form if the permeability and viscosity are constant.
2 2 1
2
2 2
L Aq
Q L
x L q A
Q L
x K
L P q
T in T
in sat
T
(9)
Moreover, we note that the curvature of the non-linear pressure profile is positive if the flow rate from the open gap into the fiber tow (qT) is positive, as shown in the pressure measurement data (Figure 6 (a)).
Then, we model the mass sink term (qT). Assuming that the capillary wicking is the principal flow inside the fiber tow, we can model the mass sink term (qT) by the following relationship:
T a ave
T T cap T T T a T
T A
p r K P A V
u p V
q
,
(10)Here, VT is the tow volume fraction, uT is the resin velocity inside the fiber tow, KT is the permeability inside the tow, Pcap,T is the capillary pressure at the flow front inside the fiber tow, rave is the average distance between the resin flow front and the boundary between the open gap and the fiber tow, pa is the air void perimeter inside the fiber tow, and AT is the tow cross-section [27]. If we regard the tow cross-section as having a rectangular shape, we can model some geometrical parameters assuming the major resin flow takes place through the longer side of the rectangular tow [30],
AT aTbT (11)
34
pa 2aTT,a (12)
rave bT
1
T,a
2
(13)
where aT and bT are the lengths of the longer and shorter side of the rectangular tow, and
T,a is the unfilled fraction of the fiber tow.The model predictions were compared with the experimental data of the pressure profile. It should be noted that a fixed value of saturated permeability was used in the model of the unsaturated flow (Equations (8) and (9)). For the saturated flow (100 mm3/s, Figure 10), the saturated permeability values were calculated at different time instants by means of linear regression. The average value (in this case, 2.522310-9 m2) was then taken as the saturated permeability for the unsaturated flow model, as represented by Equations (8) and (9). All of the parameters used in the model prediction are listed in Table 3. The capillary pressure inside the tow and the tow permeability were calculated from models in the literature [31, 32].
The model prediction results for an unsaturated flow with a low flow rate (200 mm3/s) are compared with the experimental results in Figure 11 (a). Due to the liquid flow rate into the fiber, the tow is represented as the sink term in the mass conservation equation, and the pressure profile becomes non-linear with positive curvature. The comparison between the model predictions and the experimental measurements for the high flow rate (400 mm3/s), however, shows a discrepancy, whereas non-linearity in the pressure
35
profile is still observed (Figure 11 (b)). The pressure values are overestimated in the model prediction. It is assumed that this discrepancy comes from the underestimation of the void content in the case of the high flow rate (400 mm3/s). Figure 7 shows that the void content in the final part for the flow rate of 400 mm3/s (i.e., 2.0 %) is nearly identical to that for the flow rate of 200 mm3/s (i.e., 1.8 %). In real processes, some intra-bundle voids are displaced inside the tow and eventually escape from the tow to become inter-bundle voids [7, 27]. Moreover, some inter-bundle voids migrate along the resin flow (see Figure 12), in particular at a high flow rate, and the actual void content during the mold filling process may be higher than the void content in the final part because some voids have been swept out. In Figure 11 (c), the modeling results with different void content values are presented. This figure shows that the non- linearity of the pressure profile becomes greater and the pressure values decrease as the void content value increases.
4.3. Multiphase flow modeling
For an unsaturated flow with an inter-bundle void, the mass conservation process becomes more complex. Through the channel between fiber tows, there is not only a liquid flow but also an air flow (Figure 8 (c)). Moreover, the air void migration velocity is generally different from the liquid flow velocity. As shown in Figure 12, some air voids migrate along the resin flow, whereas the other air voids are blocked
36
between the fiber tows. Hence, the flow rate of each phase alone, i.e., either air or liquid, may not be conserved, whereas the sum of the liquid flow and the air flow is conserved.
QL,inQG,inQL,outQG,out (14)
QL,in QL,out or QG,in QG,out (15)
Here, subscripts L and G represent the liquid phase and the air phase, respectively.
This type of flow can be regarded as a two phase flow in the micro-channel. Given the shape and volume fraction of the air voids, a resin flow with inter-bundle voids can be classified as a bubbly flow or a slug flow (a.k.a. a Taylor flow). Assuming that the air viscosity is negligible compared with the liquid viscosity, the pressure drop in two- phase flow is proportional to the sum of the liquid flow rate and the air flow rate [33].
In microfluidics, it has been proposed that the pressure drop of a Taylor flow across a given length (L) can be obtained by the following relationship [34]:
2 1 Re 2
ch G L h
L
TP A
Q Q f D
L
P (16)
In this equation, fTP is the friction coefficient, Re is the Reynolds number, µL is the liquid viscosity, Dh is the micro-channel diameter, Ach is the micro-channel cross- section and ε is the void fraction.
37
From this analogy, we can assume that the negative pressure gradient for the unsaturated flow with inter-bundle voids can be obtained as
1 1 1
L G L sat
L G
L sat
L
u u u K A
Q Q K dx
dP
,
(17)where uL is the volume-averaged velocity of the liquid phase and uG is the volume- averaged velocity of the air phase. It is noticeable that Equation (17) is reduced to Darcy’s law if the void content is zero (i.e., ε=0) and the air void velocity is zero (i.e., uG=0). Hence, the information on the void content distribution and the air void migration velocity is indispensable to analyze the pressure profile for an unsaturated flow with inter-bundle voids. This topic is very difficult, however, and it is beyond the scope of the current work. Nevertheless, we can provide a qualitative explanation of the change in the negative pressure gradient shown in Figure 13. In the vicinity of the resin inlet, the liquid pressure is great and most of the air voids have already been swept out, with the liquid flow dominant (Zone I: ε=0, uG=0). Then, the negative pressure gradient suddenly increase at the zone where air voids migrate at a high velocity (Zone II: uG >0). At the downstream area, the pressure is low and the air voids are expanded. Subsequently, the air voids that have been transported from the upstream are blocked between the fiber tows. As a consequence, the void content behind the flow front increases and the negative pressure gradient is decreased (Zone III: ε >0, uG0).
Another way to evaluate the channel void pressure profile is to utilize the void flow
38 rate during the flow.
The main difference between the tow and channel void is mobility. Once the void is formed in the tow bundle, it is difficult to move because the resistance against the flow of the tow area is much higher than that of the channel area. Therefore, it acts as sink of the flow and affects the global flow. However, if the void is formed in the channel area, it can be easily moved by the flow; hence, the void distribution and flow rate inside the flow can change during the flow. To establish the effect of the void flow of a multi-phase channel flow, a model of the channel void flow is considered.
To establish the void flow rate during the flow, the average void flow velocity and void cross-sectional area are considered. The average void velocity is defined as proportional to the liquid velocity with the ratio of α, and liquid velocity can be
determined by the liquid flow rate and the cross-sectional area. The cross-sectional area of the void can be calculated by utilizing the derivative of the material, as the average velocity of the void is calculated in advance. With these two parameters, the flow rate of a void can be evaluated with regard to time and space. The flow rate calculated by this method is applied to Darcy’s law, which is modified to consider a multi-phase flow.
In micro-channels, voids can affect the global flow depending on their type, i.e., a bubbly flow or a slug bubble flow. If the channel void is formed in the flow front, it forms a bubbly flow and as the voids travels along the flow, they coalesce and form a
39
slug bubble. While flowing as a bubbly flow, the resistance of the flow, which includes the viscosity and permeability, remains identical to the situation of a single-phase liquid flow; however, when it comes to a slug bubble, resistance changes with the void flow rate [33]. Therefore, the resistance change of the flow is considered in the flow front area, which increases depending on time. Comparison of model and experimental results is shown in figure 14.
4.4. Comparison between unsaturated and saturated permeability measurements
As shown in the previous section, the discrepancy between the unsaturated permeability value and the saturated permeability value comes from the misinterpretation of the pressure gradient in the unsaturated permeability measurement method. In this section, we compare the saturated permeability estimation by Equation (2) and the unsaturated permeability estimation according to Equation (3) to assess the error in the permeability measurement.
Figure 15 shows that the unsaturated permeability values were underestimated compared to the saturated values for cases involving constant flow rate injections because the negative pressure gradient was overestimated in the unsaturated permeability measurement method. In generally, a constant inlet pressure injection scheme is employed, however, when using the unsaturated permeability measurement method. From the model developed in the previous section, we can obtain an analytical
40
solution for the ratio of the unsaturated permeability to the saturated permeability in the case of a constant inlet pressure injection (Pin). From Equation (8), we can obtain the pressure distribution for a rectilinear flow under a constant inlet pressure.
2 2
2 2
1 2 2
2 q L
P K L
x L
q P K L
x K
L P q
T in sat T
in sat sat
T
(18)
For the constant inlet pressure injection, the permeability is inversely proportional to the mold filling time. Hence, the ratio of unsaturated permeability to saturated permeability can be represented as the ratio of the mold filling time in the saturated flow to that in the unsaturated flow.
ln 1 *
* 1 1
ln 1 1 2
ln 2
2 2
t t V q
t V q t
P q K
L P q K
L t
t K
K
T f sat
T f sat
T in sat
T in sat unsat
sat sat
unsat
(19)
f
Tsat
q V t t
/
* 1
(20)
where tsat and tunsat are the mold filling times in the saturated and unsaturated flows, respectively, and dimensionless time t* is the ratio of time to fill the mold cavity to the time to drain the liquid from the filled pore by the mass sink effect. As Equation (19) is valid only if the mass sink term exists, the dimensionless time (t*) should be smaller than unity for the flow to advance. The ratio of the unsaturated and saturated
41
permeability is plotted against the dimensionless time t* in Figure 16. The ratio of the unsaturated permeability to the saturated permeability reaches unity when there is no void and the mass sink term does not exist. As the void content in the tow increases, the dimensionless time t* increases and the ratio decreases due to the mass sink effect, which delays the flow front advancement.
42
5. Tow deformation effect
5.1. Dependence of the saturated permeability on the flow rate
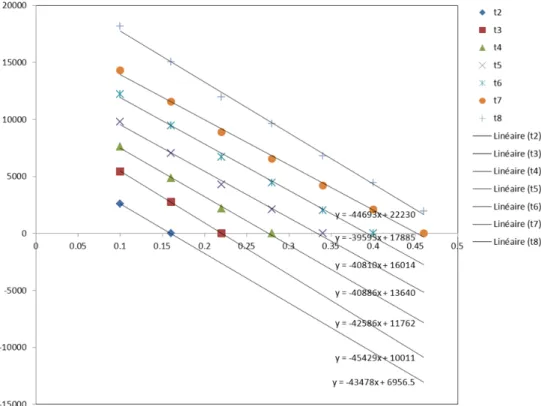
To obtain the saturated permeability which depends on the different flow rates, experiments were conducted with the injection flow rates varying sequentially from 25 to 50, 100, 200, 400, and 800 mm3/s with 350cs of silicone fluid. Tests of flow rates of 1200 and 1600mm3/s were additionally conducted for 100cs and 30cs silicone fluid, respectively, as the pressure gradient of the low viscosity fluid is relatively low compared to that of the 350cs silicone fluid at the same flow rate.
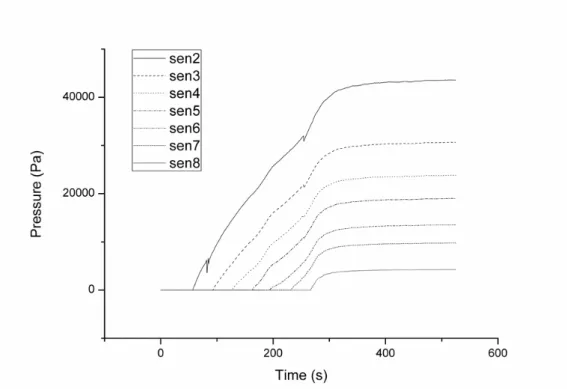
Figure 17 shows the overall pressure behavior of the experiment which was conducted with the 100cs silicone fluid. Sensor 1 is the closest transducer to the inlet, and sensor 8 is the closest transducer to the outlet of the mold. Before saturation, the pressure of each sensor rises as the fluid propagates and maintains a constant value when the flow is saturated. Pressure increases as the flow rate increases and reaches another saturation state. The saturated permeability of the flow can be obtained from these pressure gradients according to Darcy’s law.
Figure 18 shows the permeability behavior of the 30, 100, and 350cs silicone fluid during the experiment. It can be observed that as the flow rate increases, the permeability also increases. When the flow rate decreases, permeability change is differs depending on the viscosity. Silicone fluid of 30cs for the decreasing case shows
43
that permeability remains high compared to the increasing case. In contrast, silicone fluid of 100cs shows that permeability decreases as the flow rate decreases with a lower value compared to the increasing case; this is more obvious in the 350cs case.
All three cases show hysteresis between increasing and decreasing flow rates.
5.2. Observation of void formation and migration in a saturated flow
Because the flow rates of all three cases of silicone fluid begin with the low flow rate (25 mm3/s), the capillary-driven tow area flow will be faster than the channel area flow.
Owing to this velocity difference between the two areas, voids are formed in the saturated flow. It can be observed that voids formed at a low flow rate migrated and are swept out through the outlet when the flow rate increases (Figure 19.). Therefore, we can infer that voids affect the pressure gradient of the saturated flow, causing a permeability change in cases of increasing flow rates.
Because the voids are minimized by the increasing the flow rate, migration of the voids cannot be observed when decreasing the flow rate. Therefore, the difference in the void content in the saturated flow merely affects the permeability change for a decrease in the flow rate.
Despite the constant void content, there is a change in the permeability in the decreasing case of a high-viscosity fluid. This can be explained in terms of tow deformation caused by a resin flow. When the flow rate is increased, the pressure
44
difference between the channel area and tow area increases and shear stress caused by fluid brings about tow deformation. The shear stress of the fluid is proportional to the viscosity such that we can observe the highest change in the permeability under a decreasing flow rate in the 350cs silicone fluid case.
5.3. Tow deformation depending on the flow rate
Cross-sections of the tow depending of the flow rate were assessed to investigate the influence of the deformation of the tow. The location of the tow sample is shown in Figure 20. Four different parts of the composite material produced by the liquid molding process were collected for the observation of the cross-section. Constant flow rates of 50 and 200 mm3/s were injected and saturated. The vertical and horizontal lengths of the tow were measured after curing.
Vertical and horizontal lengths of the tow are shown in Figure 22, depending on the distance from the inlet.
As shown in Figure 22, horizontal and vertical length of the tow varies depending on the location of the mold and the flow rate. Both the horizontal and vertical tow lengths for the 200 mm3/s cases are larger than they are in the 50 mm3/s case. This suggests that for the 200 mm3/s case, there are more voids inside the tow than in the 50 mm3/s case; hence, the compaction of the tow may be less in the 200mm3/s case.
45
6. Conclusions
In order to optimize the liquid composite molding process to enhance the productivity and quality of the final product, it is necessary to establish the flow behavior of the porous media flow during the injection. In a porous media flow of the liquid molding process, double-scale porous media is often used as a fibrous preform. A double-scale fibrous preform has an inhomogeneous structure which can form voids during the flow.
Therefore, the voids generated in the flow front should be considered to analyze the flow behavior. Void generated during the injection process was investigated with regard to permeability in this study.
The permeability of fiber reinforcement should be a unique value regardless of the measurement method, because it is a specific property of a porous medium which is independent of the liquid properties and resin flow condition. In many cases, however, unsaturated permeability value is smaller than that of the saturated permeability. The customary method of a permeability measurement is based on a linear pressure profile assumption. In fact, it has been found that the pressure profile in an unsaturated flow with void generation is not linear and that this misinterpretation of the pressure gradient is assumed to be the main reason for the difference between unsaturated and saturated permeability estimations. The pressure distribution in the unsaturated flow with an intra-bundle void can be modeled by considering the mass sink effect in the mass conservation equation coupled with Darcy’s law using the saturated permeability value. A model for the ratio of the unsaturated permeability to the saturated
46
permeability was proposed. For a more detailed analysis, it is necessary to obtain information on void migrations, such as the void distribution and void displacement speed during the resin flow.
Experimental studies were conducted with unidirectional glass fiber performs to analyze the hysteresis behaviors in a saturated permeability condition depending on the flow rate and viscosity during the LCM manufacturing process. In a 30cs silicone fluid case, the saturated permeability increases as the flow rate increases. In contrast, these values change slightly when decreasing the flow rate. In the 100cs and 350cs silicone fluid cases, the saturated permeability increases when the flow rate increases, like the 30cs case, but it decreases when the flow rate decr