저작자표시-비영리-변경금지 2.0 대한민국 이용자는 아래의 조건을 따르는 경우에 한하여 자유롭게
l 이 저작물을 복제, 배포, 전송, 전시, 공연 및 방송할 수 있습니다. 다음과 같은 조건을 따라야 합니다:
l 귀하는, 이 저작물의 재이용이나 배포의 경우, 이 저작물에 적용된 이용허락조건 을 명확하게 나타내어야 합니다.
l 저작권자로부터 별도의 허가를 받으면 이러한 조건들은 적용되지 않습니다.
저작권법에 따른 이용자의 권리는 위의 내용에 의하여 영향을 받지 않습니다. 이것은 이용허락규약(Legal Code)을 이해하기 쉽게 요약한 것입니다.
Disclaimer
저작자표시. 귀하는 원저작자를 표시하여야 합니다.
비영리. 귀하는 이 저작물을 영리 목적으로 이용할 수 없습니다.
변경금지. 귀하는 이 저작물을 개작, 변형 또는 가공할 수 없습니다.
보건학 석사 학위 논문
심외막지방 측정을 통한 복부 내장 지방과 골무기질량의 연관성 분석
Association of visceral fat via epicardial fat thickness with bone mineral content in
Korean Healthy Twin Study
2015년 2월
서울대학교 대학원 보건학과
이 동 원
<Abstract>
Association of visceral fat via epicardial fat thickness with
bone mineral content in Korean Healthy Twin Study
DONG-WON LEE Graduate School of Public health Seoul National University
Despite the detrimental effects of abdominal visceral fat on many cardiovascular and metabolic diseases, the relationship between abdominal visceral obesity and osteoporosis remains controversial. In the present study, we investigated the association between bone mass and abdominal fat estimated by echocardiographic epicardial fat thickness, which is a surrogate measure of abdominal visceral fat, anthropometric data, and regional fat mass (FM) measured by dual energy x-ray absorptiometry (DXA). A total of 1198 subjects (525 men, 460 premenopausal women, and 213 postmenopausal women) were selected from the Healthy Twin Study,
a nationwide Korean twin and family study. Epicardial fat thickness was measured on the free wall of the right ventricle at end-systole from the parasternal long axis views. Total FM, regional FM, lean mass (LM), and bone mineral content (BMC) were measured by DXA. We performed multiple linear regression analysis with two models to determine the association between abdominal visceral obesity and osteoporosis. Age and height were included as covariates in Model 1. Past medical history and behavioral factors were included in Model 2. Epicardial fat thickness was positively associated with BMC in all three subgroups (men, premenopausal women, and postmenopausal women) in Model 1 and in Model 2. Trunk FM, waist circumference, and waist-to-hip ratio were also positively correlated to BMC in all three subgroups. Together, these findings suggest that abdominal visceral fat has a positive effect on BMC in the Korean population.
Key words: visceral fat, bone mineral content, epicardial fat, obesity, osteoporosis
Student number: 2010 – 23821
TABLE OF CONTENTS
I. Introduction ···1
II. Method ···4
Study design and population ···4
Measurement of epicardial fat thickness ···5
Measurement of anthropometric data and body composition ···6
Clinical information ···7
Statistical analysis ···8
III. Results ···10
IV. Discussion ···14
V. References ···19
Abstract (IN KOREAN) ···35
LIST OF FIGURES
Figure 1. Measurement of epicardial fat thickness ···24
Figure 2. The intra- and inter-observer agreement for epicardial fat
thickness ···25
Figure 3. Correlogram of epicardial fat with anthopometric and
body composition variables ···26
Figure 4. Association between BMC and epicardial fat thickness or
trunk fat ···27
Supplement figure 1. The intra- and inter-observer agreement for epicardial fat thickness of excluded subjects ···28
LIST OF TABLES
Table 1. Baseline characteristics of study population ···29
Table 2. Associations between epicardial fat thickness and body
composition variables ···30
Table 3. Comparisons of the least squares means of bone mineral content (BMC) and bone mineral density (BMD) according to epicardial fat thickness tertiles adjusted for age and height ···31
Table 4. Gender-specific associations between bone mineral content and epicardial fat thickness and body composition variables by
multiple linear regression analyses ···32
Table 5. Multivariable adjusted associations between bone mineral content and body composition variables using a linear mixed model ····33
Supplemental Table 1. Baseline characteristics of the study population according to echocardiographic image quality ···34
1
I. Introduction
Obesity and osteoporosis are significant public health problems with increasing prevalences and substantial economic burdens in most industrialized countries. In the United States of America (USA), in 2010, more than 10 million older adults had osteoporosis and the annual direct medical costs related to osteoporosis were estimated to be $17 to $20 billion.1,2 In the same year, more than 35% of adults were obese. The total economic burden of obesity in the USA is estimated to increase by $50 to
$60 billion per year by 2030.3,4 The prevalences of obesity and osteoporosis in Korea are similar: approximately 30% of adults are classified as obese and 13.1% of men and 24.3% of women aged 40 to 79 years old are estimated to have osteoporosis.5,6
Obesity has a negative effect on most health conditions, especially cardiovascular and metabolic diseases, but obesity has been shown to reduce osteoporosis. Previous epidemiological studies have demonstrated a positive relationship between obesity parameters and bone mineral density (BMD).7-10 Several underlying mechanisms support this hypothesis:
(1) the bone remodeling process is adaptive to increased weight bearing,11-
2
13 (2) osteoclasts are suppressed by the adipocytes that produce estrogen,14,15 and (3) osteoblasts are activated by increased anabolic hormones such as insulin and insulin-like growth factor-I, which are related to obesity.16-18 However, obesity has not been conclusively determined to have a positive effect on osteoporosis. Most previous studies used anthropometric data such as body mass index (BMI) and waist circumference (WC) to assess obesity and these factors did not accurately reflect the quantity of fat. Also, recent data have demonstrated that different regional fats have different functions. Therefore, the exact relationship between fat and osteoporosis needs to be investigated.19-21
Visceral obesity may offer new insight into the relationship between fat and osteoporosis due to its unique association with inflammation, which is also closely involved with bone metabolism.22-24 Recently, several reports have indicated that visceral obesity has a negative effect on bone mass,25,26 but this association is controversial due to the difficulty in measuring visceral fat. The gold standard methods of measuring visceral fat are direct measures of fat volume using computed tomography (CT) or magnetic resonance imaging (MRI). However, these techniques have several
3
limitations including exposure to hazardous radiation and high costs. Dual energy x-ray absorptiometry (DXA) is widely used for measuring abdominal fat mass (FM) due to its relatively low cost and minimal radiation exposure, but it cannot distinguish visceral fat from abdominal subcutaneous fat. As stated, anthropometric measures such as WC and waist-to-hip ratio do not accurately measure fat quantity.
In this study, we introduce epicardial fat thickness as a surrogate marker of visceral fat. We used this measurement, as well as anthropometric data and regional FM measured by DXA, to investigate the association between visceral obesity and bone mass. Epicardial fat located between the myocardium and the visceral pericardium has the same embryologic origin as intra-abdominal visceral fat. The use of transthoracic echocardiography to measure epicardial fat thickness is a simple and reliable imaging method for predicting visceral fat.27
4
II. Methods
Study design and population
The subjects included in this analysis were participants in the Healthy Twin Study, which was a nationwide population-based cohort study implemented as part of the Korean genome epidemiology study. It was initiated in 2005 and participants continue to receive follow-up examinations every 3 years. Participants consisted of a twin pair and their first degree family members. All participants received medical examinations and completed detailed questionnaires about life style and epidemiologic information at one of three medical school-affiliated hospitals. Details on the study design and protocols have been published previously.28
Among the initial 1467 subjects who completed an echocardiogram and body composition measurements between 2006 and 2008, 269 subjects were excluded: 220 subjects were excluded for poor echocardiographic image quality such as poor echo window or angle difference and 49 subjects were excluded for a treatment history of osteoporosis. A total of 1198 subjects (525 men, 460 premenopausal women, and 213 postmenopausal women) were included in our final
5
analysis. Women were considered to be postmenopausal if they had no history of menstruation during the previous year and fulfilled at least one of the following conditions: natural menopause, use of estrogen replacement therapy, or age older than 55 years. All participants provided written informed consent. The study protocol was approved by the Institutional Review Board at Seoul National University School of Public Health.
Measurement of epicardial fat thickness
Subjects underwent transthoracic echocardiogram according to standard techniques in the left lateral decubitus position using commercially available instruments (GE, USA). The images were recorded onto a digital database. The measurement of epicardial fat thickness was performed by two cardiologists using an offline DICOM (Digital imaging and Communications in Medicine) viewer (Onis 2.5 professional version). The cardiologists were unaware of the subjects’ clinical information.
Epicardial fat thickness was identified as the echo-free space between the myocardium and the visceral epicardium, and its thickness was measured perpendicularly on the free wall of the right ventricle at end-
6
systole from the standard parasternal long axis view.29 To standardize the measurements between observers, the aortic annulus was used as an anatomical landmark and the epicardial fat thickness was measured at the point on the free wall of the right ventricle along the midline of the ultrasound beam, perpendicular to the aortic annulus (Figure 1).30 The intra- and inter-observer agreement for the measurement of epicardial fat thickness were good and the intra-class correlation coefficients were 0.95 (range, 0.93-0.97) and 0.92 (range, 0.88-0.95), respectively (Figure 2).
Measurement of anthropometric data and body composition
Body weight and height were measured according to standard methods while the subjects were wearing a light gown or light indoor clothing. Minimum WC was measured in the standing position at the point between the lower rib margin and the iliac crest. Hip circumference was measured as the largest circumference over the buttock. BMI was calculated as weight divided by height squared (kg/m2) and the waist-to-hip ratio was calculated as WC divided by hip circumference. Total bone
7
mineral content (BMC), bone mineral density (BMD) of the whole body, the lumbar spine, and the pelvis, whole-body and regional FM, and lean mass (LM) were measured using DXA (Delphi W, Hologic, Boston, MA, USA).
Skeletal muscle mass (SM) was measured using a bioelectrical impedance analysis (BIA) meter (Biospace, Inbody720, Korea). The DXA and BIA equipment were calibrated by the manufacturer. The coefficients of variation for BMC, BMD, FM, LM, and SM measurements were < 1%.
Percent FM was calculated as FM/(FM + LM + BMC) × 100.
Clinical information
The following clinical and demographic data were extracted from each patient’s baseline questionnaire: past medical history of chronic diseases including hypertension, diabetes mellitus, thyroid disease, and osteoporosis; female reproductive history including age at menopause and use of estrogen replacement therapy; and information about cigarette smoking, alcohol consumption and exercise habits.
8
Statistical analysis
The value of each continuous variable is expressed as a mean ± standard deviation. Each categorical or discrete variable is presented as a percentage. Comparisons among the groups (men, premenopausal women, and postmenopausal women) were performed using analysis of variance (ANOVA), analysis of covariance (ANCOVA), and the chi squared (χ2) test.
Multiple comparisons between two groups were performed with post hoc analysis. The relationships between the epicardial fat thickness and other measures of body composition were analyzed with Pearson’s correlation analysis. Two multiple linear regression models in each group were used to evaluate associations between visceral obesity and bone mass; age and height were included as covariates in regression Model 1 and past medical history (hypertension, diabetes mellitus, and thyroid disease), and smoking, alcohol, and exercise habits were added as covariates in Model 2. We also evaluated associations between BMC and body composition variables using a linear mixed model to correct for familiar interdependence. Age, height, hypertension, diabetes, hyperthyroid disease, smoking habits, alcohol consumption, and regular exercise were adjusted as fixed effects,
9
and family unit was adjusted as a random effect. Statistical analyses were performed using SPSS 18.0 for Windows (Chicago, IL, USA). All tests were two-tailed, and a p-value < 0.05 was considered statistically significant.
10
III. Results
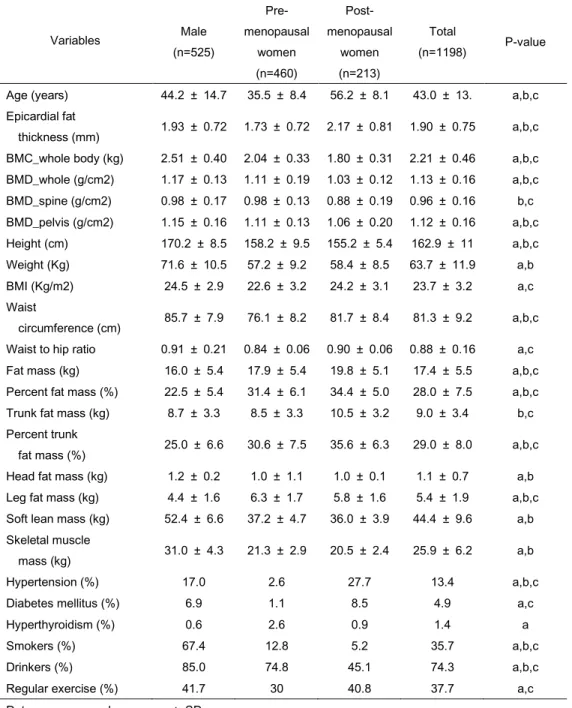
The baseline characteristics of the subjects are listed in Table 1.
The body composition parameters and clinical information are statistically different according to gender and menopausal status. Men had higher BMI, WC, waist-to-hip ratio, LM, and SM than women. Fat-related parameters such as FM and trunk FM were lower in men than in women, with the exception of head FM. Postmenopausal women had more total fat and trunk fat, but had lower leg fat, LM, and SM than premenopausal women.
Epicardial fat thickness was highest in postmenopausal women and lowest in premenopausal women. BMC was higher in men due to their larger body size compared with women. However, the difference in BMD between the genders was small and no significant difference in spine BMD was
identified between men and premenopausal women. Hypertension and diabetes mellitus were most prevalent in postmenopausal women; risky heath behaviors such as smoking and drinking alcohol were highest in men.
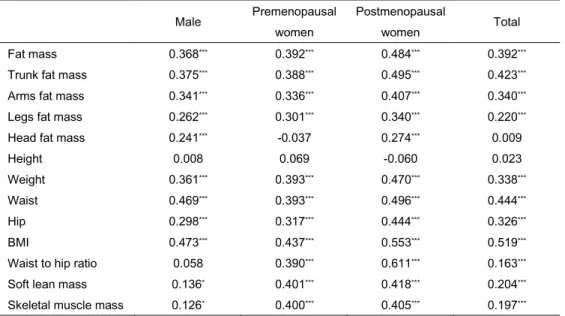
Figure 3 and Table 2 show the correlations of epicardial fat
thickness with anthropometric and body composition variables. Epicardial fat thickness was highly associated with body FM, especially trunk FM in
11
postmenopausal women. Epicardial fat thickness was also associated with classical central obesity parameters such as WC and waist-to-hip ratio.
Epicardial fat was positively correlated with age, but BMC was negatively correlated with age. BMC showed a strong positive correlation with height.
We also examined the difference in whole-body BMC, whole-body BMD, and body-part specific BMD across the tertiles of epicardial fat thickness, adjusting for age and height in all three subgroups using the ANCOVA test. As shown in Table 3, BMC significantly increased across increasing tertiles of epicardial fat thickness in all subgroups. This tendency was not observed in whole-body or spine BMD, particularly in women.
Figure 4 shows the association between BMC and epicardial fat thickness and trunk fat. In bivariate unadjusted analyses, BMC increased with increasing epicardial fat thickness in all subgroups. These tendencies were also observed in associations between BMC and trunk fat in the subgroups.
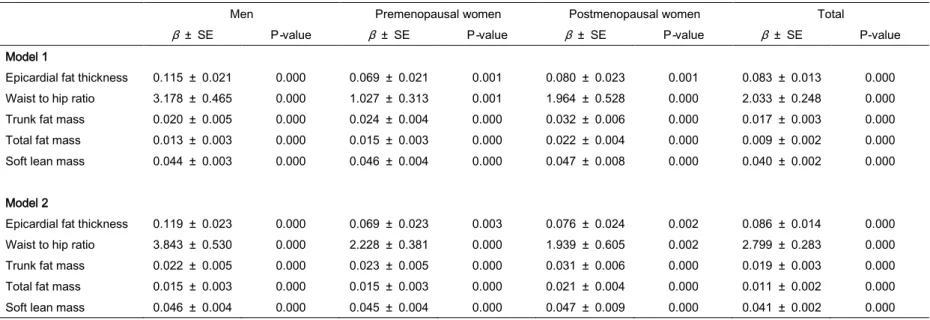
Table 4 shows the multivariable adjusted associations between BMC and body composition variables. Epicardial fat thickness was
12
positively associated with BMC in men, premenopausal women, and postmenopausal women in the age- and height-adjusted model (Model 1).
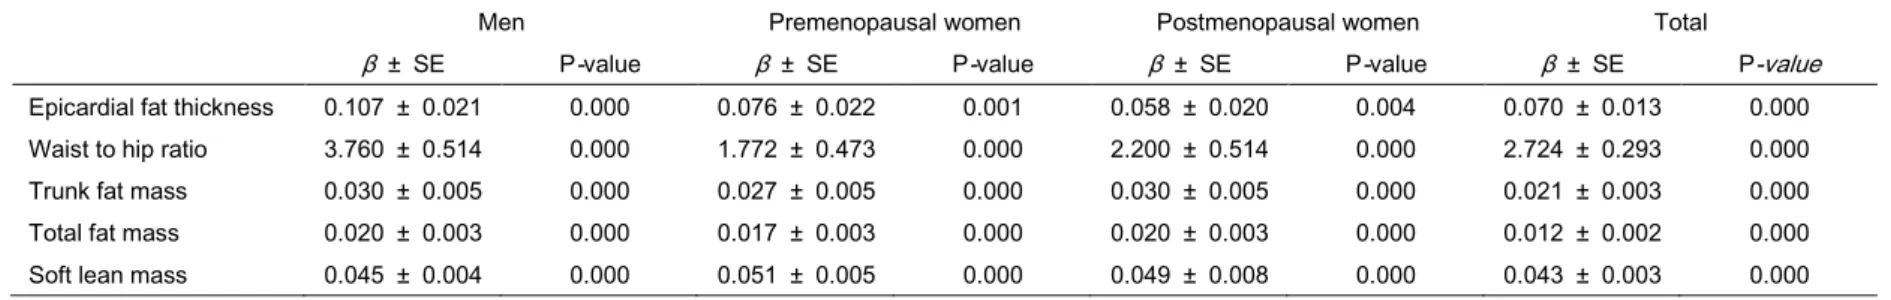
The association was unchanged after controlling for past medical history (hypertension, diabetes, and hyperthyroid disease) and behavioral factors (smoking, alcohol, and exercise habits; Model 2). Trunk FM and classical indices of abdominal obesity parameters such as WC and waist-to-hip ratio were also positively associated with BMC in both models. The same associations were observed with total FM. After correcting for familial interdependence using a linear mixed model, the association between abdominal fat and BMC was still positive (Table 5).
Approximately 15% of the initial subjects were excluded from analysis due to poor echocardiographic images that affected measurement reliability (Supplemental Figure 1). These subjects were younger and had lower total fat and abdominal fat, including epicardial fat thickness, than the subjects with good echocardiographic images (Supplemental Table 1). The associations between BMC and abdominal fat did not change when
subjects with poor echocardiographic images were included in the analysis.
The β coefficient of the association between epicardial fat and BMC in
13
Model 2 was 0.117 for men (SE: ± 0.020, p-value = 0.000), 0.076 for premenopausal women (SE: ± 0.020, p-value = 0.000), and 0.065 for postmenopausal women (SE: ± 0.022, p-value = 0.003).
14
IV. Discussion
The results from our study of the Korean Healthy Twin cohort showed that visceral fat estimated from epicardial fat thickness was positively associated with BMC regardless of gender and menopausal status. Its relationship was also evident with other abdominal obesity parameters such as WC, waist-to-hip ratio, and trunk fat.
The exact association between fat and bone is still controversial, but this relationship has long been an interesting research topic among
epidemiologists. Several previous studies reported positive associations between fat and BMC or BMD and two plausible mechanisms have been suggested on the basis of two main characteristics of fat.31 One mechanism is related to increased weight bearing of bones, which directly activates adaptive bone remodeling; 11-13 the other mechanism is associated with paracrine and hormonal effects of fat, which enhance anabolic effects on bone through increased production of sex hormones and hormonal factors such as insulin, leptin, and amylin.14-18 However, other previous reports demonstrated a negative relationship between fat and BMC or BMD.9,32-34 In most of these studies, body weight was used as an important covariate
15
in the analysis, but this may cause a false association between FM and bone mass due to biases from strong co-linearity between FM and body weight.35 On the basis of this methodology, we did not use body weight as a covariate for investigating influences of fat on bone mass and BMD.
Instead of weight, we used height as an important covariate because whole-body BMC and BMD are highly associated with whole-body bone size, and height is known to be a good surrogate marker for body and bone size .31,32
Abdominal visceral fat has unique characteristics compared with other fat such as subcutaneous fat.26,36 Therefore, a simple and accurate method for measuring abdominal visceral fat is necessary to investigate the exact association between abdominal visceral fat and bone mass. Although CT and MRI are gold standard methods of measuring visceral fat, they present challenges for use in a large study due to exposure to hazardous radiation and high costs. Therefore, DXA is the most widely used technique for measuring abdominal fat. Still, its weakness is the inability to
differentiate visceral fat from subcutaneous fat. In this study, we introduced epicardial fat thickness as a surrogate measure of visceral fat for the first
16
time to evaluate the association between visceral fat and bone mass.
Epicardial fat is widely used in studies of diseases related to metabolic syndrome and atherosclerosis and it is known to have the same
embryologic origin as intra-abdominal visceral fat. Epicardial fat thickness measured by transthoracic echocardiography has been highly associated with abdominal visceral fat quantity measured by MRI.27 According to our study results, visceral fat estimated from epicardial fat and total FM are positively associated with BMC. The reason for the positive association between BMC and abdominal visceral fat was not evaluated in this study.
The systemic effects of visceral fat such as hyperinsulinemia due to insulin resistance and altered sex hormone metabolism might be important factors and should be evaluated in future studies.35,37
BMD has been widely used as a surrogate marker for the diagnosis of osteoporosis and osteopenia, but, in this study, we used BMC as a surrogate and dependable variable for bone mass. BMD measured with DXA reflects areal BMD rather than volumetric BMD, and it likely
overestimates and underestimates BMD for subjects who are larger and smaller than average size people, respectively.38 Bone area is a major
17
component for calculating BMD and it is highly correlated with body size and FM. These limitations remove the association between fat and bone mass, so, in this study, we used BMC to study the associations between bone mass and body composition parameters.
This study has several strengths. Principally, it is the first study to demonstrate an association between visceral fat estimated from epicardial fat and bone mass. Also, we used diverse methods for estimating
abdominal fat and considered a wide range of probable covariates that influence BMC, which allowed us to achieve an accurate estimation of the association between abdominal visceral fat and BMC. However, this study has several limitations. This study was a cross-sectional design and all participants were Korean. Therefore, it is impossible to establish causal relationships or generalize the findings to other ethnicities. Further, echocardiographic epicardial fat thickness may not reflect the exact
quantity of total epicardial fat because it is a linear measurement and varies at different locations around the myocardium. In the future, large
longitudinal studies that measure volumetric visceral fat will reveal the relationship between abdominal visceral fat and bone.
18
In conclusion, this study showed that abdominal visceral fat
estimated from epicardial fat thickness was positively associated with BMC.
These findings suggest that visceral fat has a protective effect on bone mass, which supports the obesity paradox.
19
V. References
1. Wright NC, Looker AC, Saag KG, et al. The Recent Prevalence of Osteoporosis and Low Bone Mass in the United States Based on Bone Mineral Density at the Femoral Neck or Lumbar Spine. Journal of Bone and Mineral Research. 2014.
2. Becker DJ, Kilgore ML, Morrisey MA. The societal burden of osteoporosis.
Current rheumatology reports. 2010;12(3):186-191.
3. Ogden CL, Statistics NCfH. Prevalence of obesity in the United States, 2009-2010: US Department of Health and Human Services, Centers for Disease Control and Prevention, National Center for Health Statistics;
2012.
4. Wang YC, McPherson K, Marsh T, Gortmaker SL, Brown M. Health and economic burden of the projected obesity trends in the USA and the UK.
The Lancet. 2011;378(9793):815-825.
5. Oh SW. Obesity and metabolic syndrome in Korea. Diabetes &
metabolism journal. 2011;35(6):561-566.
6. Shin CS, Choi HJ, Kim MJ, et al. Prevalence and risk factors of osteoporosis in Korea: a community-based cohort study with lumbar spine and hip bone mineral density. Bone. 2010;47(2):378-387.
7. Wardlaw GM. Putting body weight and osteoporosis into perspective. The American journal of clinical nutrition. 1996;63(3):433S-436S.
8. Albala C, Yanez M, Devoto E, Sostin C, Zeballos L, Santos J. Obesity as a protective factor for postmenopausal osteoporosis. International journal of obesity and related metabolic disorders: journal of the International Association for the Study of Obesity. 1996;20(11):1027-1032.
9. Zhao L-J, Liu Y-J, Liu P-Y, Hamilton J, Recker RR, Deng H-W.
20
Relationship of obesity with osteoporosis. The Journal of Clinical Endocrinology & Metabolism. 2007;92(5):1640-1646.
10. Reid IR. Relationships among body mass, its components, and bone.
BoneKEy-Osteovision. 2002.
11. Zhao LJ, Jiang H, Papasian CJ, et al. Correlation of obesity and osteoporosis: effect of fat mass on the determination of osteoporosis.
Journal of Bone and Mineral Research. 2008;23(1):17-29.
12. Skerry TM, Suva LJ. Investigation of the regulation of bone mass by mechanical loading: from quantitative cytochemistry to gene array. Cell biochemistry and function. 2003;21(3):223-229.
13. Suva LJ, Gaddy D, Perrien DS, Thomas RL, Findlay DM. Regulation of bone mass by mechanical loading: microarchitecture and genetics. Current osteoporosis reports. 2005;3(2):46-51.
14. Järvinen TL, Kannus P, Sievänen H. Estrogen and bone—a reproductive and locomotive perspective. Journal of Bone and Mineral Research.
2003;18(11):1921-1931.
15. Bilezikian JP, Morishima A, Bell J, Grumbach MM. Increased bone mass as a result of estrogen therapy in a man with aromatase deficiency. New England Journal of Medicine. 1998;339(9):599-603.
16. Thomas T, Burguera B, Melton Iii L, et al. Role of serum leptin, insulin, and estrogen levels as potential mediators of the relationship between fat mass and bone mineral density in men versus women. Bone.
2001;29(2):114-120.
17. Reid I, Evans M, Cooper GJ, Ames RW, Stapleton J. Circulating insulin levels are related to bone density in normal postmenopausal women.
American Journal of Physiology. 1993;265:E655-E655.
18. Yakar S, Rosen CJ, Beamer WG, et al. Circulating levels of IGF-1 directly regulate bone growth and density. The Journal of clinical investigation.
21 2002;110(6):771-781.
19. Neeland IJ, Gupta S, Ayers CR, et al. Relation of regional fat distribution to left ventricular structure and function. Circulation: Cardiovascular Imaging. 2013;6(5):800-807.
20. Tchkonia T, Thomou T, Zhu Y, et al. Mechanisms and metabolic implications of regional differences among fat depots. Cell metabolism.
2013;17(5):644-656.
21. Kissebah AH, Krakower GR. Regional adiposity and morbidity.
Physiological Reviews. 1994;74(4):761-811.
22. Lumeng CN, Saltiel AR. Inflammatory links between obesity and metabolic disease. The Journal of clinical investigation. 2011;121(6):2111- 2117.
23. Tchernof A, Després J-P. Pathophysiology of human visceral obesity: an update. Physiological Reviews. 2013;93(1):359-404.
24. Cao JJ. Effects of obesity on bone metabolism. J Orthop Surg Res.
2011;6(1):30-36.
25. Russell M, Mendes N, Miller KK, et al. Visceral fat is a negative predictor of bone density measures in obese adolescent girls. The Journal of Clinical Endocrinology & Metabolism. 2010;95(3):1247-1255.
26. Gilsanz V, Chalfant J, Mo AO, Lee DC, Dorey FJ, Mittelman SD.
Reciprocal relations of subcutaneous and visceral fat to bone structure and strength. The Journal of Clinical Endocrinology & Metabolism.
2009;94(9):3387-3393.
27. Iacobellis G, Assael F, Ribaudo MC, et al. Epicardial fat from echocardiography: a new method for visceral adipose tissue prediction.
Obesity research. 2003;11(2):304-310.
28. Sung J, Cho S-I, Lee K, et al. Healthy Twin: a twin-family study of Korea—protocols and current status. Twin Research and Human Genetics.
22 2006;9(06):844-848.
29. Iacobellis G, Willens HJ. Echocardiographic epicardial fat: a review of research and clinical applications. Journal of the American Society of Echocardiography. 2009;22(12):1311-1319.
30. Park EM, Choi J-H, Shin I-S, et al. Echocardiographic epicardial fat thickness on short term prognosis in patients with acute coronary syndrome.
Journal of Cardiovascular Ultrasound. 2008;16(2):42-47.
31. Park J-H, Song Y-M, Sung J, et al. The association between fat and lean mass and bone mineral density: the Healthy Twin Study. Bone.
2012;50(4):1006-1011.
32. Kim J, Choi H, Kim M, Shin C, Cho N. Fat mass is negatively associated with bone mineral content in Koreans. Osteoporosis international.
2012;23(7):2009-2016.
33. Chang C-S, Chang Y-F, Wang M-W, et al. Inverse relationship between central obesity and osteoporosis in osteoporotic drug naive elderly females:
the Tianliao Old People (TOP) Study. Journal of Clinical Densitometry.
2013;16(2):204-211.
34. Yu Z, Zhu Z, Tang T, Dai K, Qiu S. Effect of body fat stores on total and regional bone mineral density in perimenopausal Chinese women. Journal of bone and mineral metabolism. 2009;27(3):341-346.
35. Reid IR. Fat and bone. Archives of biochemistry and biophysics.
2010;503(1):20-27.
36. Wang L, Wang W, Xu L, et al. Relation of visceral and subcutaneous adipose tissue to bone mineral density in Chinese women. International journal of endocrinology. 2013;2013.
37. Yüksel O, Dökmetaş HS, Topcu S, Erselcan T, Şencan M. Relationship between bone mineral density and insulin resistance in polycystic ovary syndrome. Journal of bone and mineral metabolism. 2001;19(4):257-262.
23
38. Prentice A, Parsons TJ, Cole TJ. Uncritical use of bone mineral density in absorptiometry may lead to size-related artifacts in the identification of bone mineral determinants. The American journal of clinical nutrition.
1994;60(6):837-842.
RV
LV
LA Aorta
3.35 mm
Figure 1. Measurement of epicardial fat thickness
Epicardial fat thickness was measured perpendicularly on the free wall of right ventricle from parasternal long axis view at end-systole.
Abbreviation : RV - right ventricle, LV - left ventricle, LA - left atrium
24
A
Intra-class correlation coefficient : 0.95
B
Intra-class correlation coefficient : 0.92
Figure 2.
The intra- and inter-observer agreement for epicardial fat thickness was expressed as Bland-Altman plot.
25
Epif at
BMC
Age
Height
Weight
BMI
WC
WHP
Fat.mass
Trunk.f at
Arms.f at
Legs.f at
Sof t.lean
Figure 3. Correlogram of epicardial fat with anthopometric and body composition variables Abbreviation)
Epifat – epicardial fat thickness, BMC – bone mineral content, BMI – body mass index, WC – waist circumference, WHR – waist to hip ratio
26
Figure 4.
Association between BMC and epicardial fat thickness or trunk fat.
a, b : Men; c, d : premenopausal women; e, f : postmenopausal women
a b
c d
e f
β coeff = 0.115, p= 0.043 β coeff = 0.370, p= 0.000
β coeff = 0.369,p = 0.000 β coeff = 0.549,p = 0.000
β coeff = 0.377, p= 0.000 β coeff = 0.527, p= 0.000
27
A
Intra-class correlation coefficient : 0.77
B
Intra-class correlation coefficient : 0.63
Supplement figure 1.
The intra- and inter-observer agreement for epicardial fat thickness of excluded subjects due to poor echocardiographic image quality was expressed as Bland-Altman plot.
28
29
Table 1. Baseline characteristics of study population
Data are expressed as means ± SD.
Post hoc analysis by independent t-test (mean difference between two groups):
a: men vs. premenopausal women; b: men vs. postmenopausal women; c: premenopausal vs.
postmenopausal women.
Discrete variables were analyzed by the χ2 test.
P < 0.05 was considered significant.
BMC: bone mineral content; BMD: bone mineral density; DXA: dual energy x-ray absorptiometry.
Variables Male
(n=525)
Pre- menopausal
women (n=460)
Post- menopausal
women (n=213)
Total
(n=1198) P-value
Age (years) 44.2 ± 14.7 35.5 ± 8.4 56.2 ± 8.1 43.0 ± 13. a,b,c Epicardial fat
thickness (mm) 1.93 ± 0.72 1.73 ± 0.72 2.17 ± 0.81 1.90 ± 0.75 a,b,c BMC_whole body (kg) 2.51 ± 0.40 2.04 ± 0.33 1.80 ± 0.31 2.21 ± 0.46 a,b,c BMD_whole (g/cm2) 1.17 ± 0.13 1.11 ± 0.19 1.03 ± 0.12 1.13 ± 0.16 a,b,c BMD_spine (g/cm2) 0.98 ± 0.17 0.98 ± 0.13 0.88 ± 0.19 0.96 ± 0.16 b,c BMD_pelvis (g/cm2) 1.15 ± 0.16 1.11 ± 0.13 1.06 ± 0.20 1.12 ± 0.16 a,b,c Height (cm) 170.2 ± 8.5 158.2 ± 9.5 155.2 ± 5.4 162.9 ± 11 a,b,c Weight (Kg) 71.6 ± 10.5 57.2 ± 9.2 58.4 ± 8.5 63.7 ± 11.9 a,b BMI (Kg/m2) 24.5 ± 2.9 22.6 ± 3.2 24.2 ± 3.1 23.7 ± 3.2 a,c Waist
circumference (cm) 85.7 ± 7.9 76.1 ± 8.2 81.7 ± 8.4 81.3 ± 9.2 a,b,c Waist to hip ratio 0.91 ± 0.21 0.84 ± 0.06 0.90 ± 0.06 0.88 ± 0.16 a,c Fat mass (kg) 16.0 ± 5.4 17.9 ± 5.4 19.8 ± 5.1 17.4 ± 5.5 a,b,c Percent fat mass (%) 22.5 ± 5.4 31.4 ± 6.1 34.4 ± 5.0 28.0 ± 7.5 a,b,c Trunk fat mass (kg) 8.7 ± 3.3 8.5 ± 3.3 10.5 ± 3.2 9.0 ± 3.4 b,c Percent trunk
fat mass (%) 25.0 ± 6.6 30.6 ± 7.5 35.6 ± 6.3 29.0 ± 8.0 a,b,c Head fat mass (kg) 1.2 ± 0.2 1.0 ± 1.1 1.0 ± 0.1 1.1 ± 0.7 a,b Leg fat mass (kg) 4.4 ± 1.6 6.3 ± 1.7 5.8 ± 1.6 5.4 ± 1.9 a,b,c Soft lean mass (kg) 52.4 ± 6.6 37.2 ± 4.7 36.0 ± 3.9 44.4 ± 9.6 a,b Skeletal muscle
mass (kg) 31.0 ± 4.3 21.3 ± 2.9 20.5 ± 2.4 25.9 ± 6.2 a,b
Hypertension (%) 17.0 2.6 27.7 13.4 a,b,c
Diabetes mellitus (%) 6.9 1.1 8.5 4.9 a,c
Hyperthyroidism (%) 0.6 2.6 0.9 1.4 a
Smokers (%) 67.4 12.8 5.2 35.7 a,b,c
Drinkers (%) 85.0 74.8 45.1 74.3 a,b,c
Regular exercise (%) 41.7 30 40.8 37.7 a,c
30
Table 2. Associations between epicardial fat thickness and body composition variables
Male Premenopausal
women
Postmenopausal
women Total
Fat mass 0.368*** 0.392*** 0.484*** 0.392***
Trunk fat mass 0.375*** 0.388*** 0.495*** 0.423***
Arms fat mass 0.341*** 0.336*** 0.407*** 0.340***
Legs fat mass 0.262*** 0.301*** 0.340*** 0.220***
Head fat mass 0.241*** -0.037 0.274*** 0.009
Height 0.008 0.069 -0.060 0.023
Weight 0.361*** 0.393*** 0.470*** 0.338***
Waist 0.469*** 0.393*** 0.496*** 0.444***
Hip 0.298*** 0.317*** 0.444*** 0.326***
BMI 0.473*** 0.437*** 0.553*** 0.519***
Waist to hip ratio 0.058 0.390*** 0.611*** 0.163***
Soft lean mass 0.136* 0.401*** 0.418*** 0.204***
Skeletal muscle mass 0.126* 0.400*** 0.405*** 0.197***
Data presented are Pearson correlation coefficients.
*P<0.05; **P<0.01; ***P<0.001 BMI: body mass index.
31
Table 3. Comparisons of the least squares means of bone mineral content (BMC) and bone mineral density (BMD) according to epicardial fat
thickness tertiles adjusted for age and height
Epicardial fat thickness
p for trend P-value 1st tertile 2nd tertile 3rd tertile
Men
BMC_whole (kg) 2.42 ± 0.03 2.51 ± 0.03 2.61 ± 0.03 0.000 a,b,c BMD_whole (g/cm2) 1.16 ± 0.01 1.17 ± 0.01 1.19 ± 0.01 0.048 b BMD_spine (g/cm2) 0.98 ± 0.01 0.98 ± 0.01 0.98 ± 0.01 0.978 - BMD_pelvis (g/cm2) 1.12 ± 0.01 1.14 ± 0.01 1.18 ± 0.01 0.024 b,c
Premenopausal women
BMC_whole (kg) 2.02 ± 0.02 2.01 ± 0.03 2.11 ± 0.03 0.029 b,c BMD_whole (g/cm2) 1.11 ± 0.01 1.10 ± 0.01 1.13 ± 0.02 0.085 c BMD_spine (g/cm2) 0.98 ± 0.01 0.97 ± 0.01 0.99 ± 0.01 0.397 - BMD_pelvis (g/cm2) 1.09 ± 0.01 1.10 ± 0.01 1.14 ± 0.01 0.032 b,c
Postmenopausal women
BMC_whole (kg) 1.72 ± 0.04 1.77 ± 0.03 1.87 ± 0.03 0.003 b,c BMD_whole (g/cm2) 1.01 ± 0.02 1.02 ± 0.01 1.05 ± 0.01 0.063 b BMD_spine (g/cm2) 0.84 ± 0.03 0.87 ± 0.02 0.91 ± 0.02 0.104 b BMD_pelvis (g/cm2) 1.05 ± 0.03 1.03 ± 0.03 1.08 ± 0.02 0.014 a,b,c
Total
BMC_whole (kg) 2.15 ± 0.02 2.20 ± 0.02 2.28 ± 0.02 0.000 a,b,c BMD_whole (g/cm2) 1.11 ± 0.01 1.12 ± 0.01 1.15 ± 0.01 0.000 b,c BMD_spine (g/cm2) 0.96 ± 0.01 0.95 ± 00 0.97 ± 0.01 0.000 - BMD_pelvis (g/cm2) 1.09 ± 0.01 1.11 ± 0.01 1.15 ± 0.01 0.000 b,c Data are expressed as means ± standard error of the mean.
Post hoc analysis using the least significant difference t-test (mean difference between two groups):
a: men vs. premenopausal women; b: men vs. postmenopausal women; c: premenopausal vs.
postmenopausal women
32
Table 4. Gender-specific associations between bone mineral content and epicardial fat thickness and body composition variables by multiple linear regression analyses
SE: standard errors
Model 1: Covariates included in the regression model were age and height.
Model 2: Model 1 + additional adjustments for hypertension, diabetes, hyperthyroid disease, smoking habits, alcohol consumption, and regular exercise.
Men Premenopausal women Postmenopausal women Total
β ± SE P-value β ± SE P-value β ± SE P-value β ± SE P-value
Model 1
Epicardial fat thickness 0.115 ± 0.021 0.000 0.069 ± 0.021 0.001 0.080 ± 0.023 0.001 0.083 ± 0.013 0.000 Waist to hip ratio 3.178 ± 0.465 0.000 1.027 ± 0.313 0.001 1.964 ± 0.528 0.000 2.033 ± 0.248 0.000 Trunk fat mass 0.020 ± 0.005 0.000 0.024 ± 0.004 0.000 0.032 ± 0.006 0.000 0.017 ± 0.003 0.000 Total fat mass 0.013 ± 0.003 0.000 0.015 ± 0.003 0.000 0.022 ± 0.004 0.000 0.009 ± 0.002 0.000 Soft lean mass 0.044 ± 0.003 0.000 0.046 ± 0.004 0.000 0.047 ± 0.008 0.000 0.040 ± 0.002 0.000
Model 2
Epicardial fat thickness 0.119 ± 0.023 0.000 0.069 ± 0.023 0.003 0.076 ± 0.024 0.002 0.086 ± 0.014 0.000 Waist to hip ratio 3.843 ± 0.530 0.000 2.228 ± 0.381 0.000 1.939 ± 0.605 0.002 2.799 ± 0.283 0.000 Trunk fat mass 0.022 ± 0.005 0.000 0.023 ± 0.005 0.000 0.031 ± 0.006 0.000 0.019 ± 0.003 0.000 Total fat mass 0.015 ± 0.003 0.000 0.015 ± 0.003 0.000 0.021 ± 0.004 0.000 0.011 ± 0.002 0.000 Soft lean mass 0.046 ± 0.004 0.000 0.045 ± 0.004 0.000 0.047 ± 0.009 0.000 0.041 ± 0.002 0.000
33
Table 5. Multivariable adjusted associations between bone mineral content and body composition variables using a linear mixed model
SE: standard errors
The fixed effects (age, height, hypertension, diabetes, hyperthyroid disease, smoking habits, alcohol consumption, and regular exercise) and the random effect (family unit) were adjusted.
Men Premenopausal women Postmenopausal women Total
β ± SE P-value β ± SE P-value β ± SE P-value β ± SE P-value
Epicardial fat thickness 0.107 ± 0.021 0.000 0.076 ± 0.022 0.001 0.058 ± 0.020 0.004 0.070 ± 0.013 0.000 Waist to hip ratio 3.760 ± 0.514 0.000 1.772 ± 0.473 0.000 2.200 ± 0.514 0.000 2.724 ± 0.293 0.000 Trunk fat mass 0.030 ± 0.005 0.000 0.027 ± 0.005 0.000 0.030 ± 0.005 0.000 0.021 ± 0.003 0.000 Total fat mass 0.020 ± 0.003 0.000 0.017 ± 0.003 0.000 0.020 ± 0.003 0.000 0.012 ± 0.002 0.000 Soft lean mass 0.045 ± 0.004 0.000 0.051 ± 0.005 0.000 0.049 ± 0.008 0.000 0.043 ± 0.003 0.000
34
Supplemental Table 1. Baseline characteristics of the study population according to echocardiographic image quality
Data are expressed as means ± SD.
Discrete variables were analyzed by the χ2 test.
BMC: bone mineral content; BMD: bone mineral density; DXA: dual energy x-ray absorptiometry.
Variables Good image
(n=1198)
Poor image
(n=209) P-value
Age (years) 43.0 ± 13.7 38.6 ± 13.7 0.000
Men Women
Premenopausal Postmenopausal
43.8
38.4 17.8
47.8
42.1 10.0
0.022
Epicardial fat thickness (mm) 1.90 ± 0.75 1.46 ± 0.67 0.000
BMC_whole body (kg) 2.21 ± 0.46 2.24 ± 0.46 0.161
Height (cm) 162.9 ± 10.7 164.4 ± 8.7 0.052
Weight (Kg) 63.7 ± 11.9 61.9 ± 12.3 0.039
BMI (Kg/m2) 23.7 ± 3.2 22.9 ± 3.5 0.011
Waist circumference (cm) 81.3 ± 9.2 78.4 ± 9.8 0.000
Waist to hip ratio 0.88 ± 0.16 0.85 ± 0.06 0.039
Fat mass (kg) 17.4 ± 5.5 15.5 ± 5.6 0.000
Trunk fat mass (kg) 9.0 ± 3.4 7.7 ± 3.4 0.000
Head fat mass (kg) 1.1 ± 0.7 1.0 ± 0.2 0.436
Soft lean mass (kg) 44.4 ± 9.6 44.5 ± 10.2 0.940
Skeletal muscle mass (kg) 25.9 ± 6.2 26.1 ± 6.6 0.853
Hypertension (%) 13.4 7.2 0.035
Diabetes mellitus (%) 4.9 4.3 0.545
Hyperthyroidism (%) 1.4 2.4 0.310
Smokers (%) 35.7 36.1 0.901
Drinkers (%) 74.3 77.4 0.387
Regular exercise (%) 37.7 33.2 0.696
35
요약(국문초록)
심외막지방 측정을 통한 복부 내장 지방과 골무기질량의 연관성 분석
이동원 보건학과 서울대학교 보건대학원
복부내장지방이 심혈관계 및 대사성질환에 부정적인 영향을 주는 것으 로 잘 알려져 있지만, 복부내장지방과 골다공증과의 관계는 아직 정립되 어 있지 않다. 이번 연구에서는 경흉부심초음파를 이용해 측정한 심외막 지방(epicardial fat)과 이중에너지 방사선흡수법(dual energy x-ray absorptiometry, DXA)을 통해 측정한 골무기질량(bone mineral content, BMC)의 연관성 분석을 통해 복부지방과 골다공증간의 관계를 밝혀보고 자 하였다. 연구대상은 총 1198명 (남자 525명, 폐경전여성 460명, 폐경 후 여성 213명)으로 한국형 쌍둥이 코호트연구(The Healthy Twin study)
36
에서 선정되었다. 심외막지방은 경흉부심초음파의 흉골연 장축단면도 (parasternal long axis view)에서 수축말기의 우심실 심근과 장측 심낭막 (visceral pericardium) 사이의 지방의 두께로 측정되었다. 전체 지방량, 부위별 지방량 및 제지방체중(lean body mass) 및 골무기질량은 DXA 방 법으로 측정되었다. 연령 및 키를 보정한 다중선형회귀분석에서 복부내 장 지방의 대체 측정치인 심외막지방의 두께는 남자, 여자 모두에서 골 무기질량과 양의 상관관계를 보였다. 또한 과거질병력과 흡연력, 음주력, 규칙적인 운동상태 등을 추가 보정한 모델에서도 심외막지방과 골무기질 량의 관계는 양의 상관관계로 나타났다. 이와 같은 연관성은 다른 방법 (waist circumference, Waist to hip ratio, trunk fat from DXA) 으로 측정된 복부지방지표와 골무기질량간의 연관성 분석에서 그대로 나타났다. 이러 한 결과는 복부내장지방이 심혈관 질환 및 대상성 질환에 부정적인 영향 을 주는 것에 비해, 골무기질량에는 긍정적인 영향을 미칠 가능성을 보 여준다.
주요어 : 복부내장지방, 골무기질량, 심외막지방 학 번 : 2010-23821