저작자표시-비영리-변경금지 2.0 대한민국 이용자는 아래의 조건을 따르는 경우에 한하여 자유롭게
l 이 저작물을 복제, 배포, 전송, 전시, 공연 및 방송할 수 있습니다. 다음과 같은 조건을 따라야 합니다:
l 귀하는, 이 저작물의 재이용이나 배포의 경우, 이 저작물에 적용된 이용허락조건 을 명확하게 나타내어야 합니다.
l 저작권자로부터 별도의 허가를 받으면 이러한 조건들은 적용되지 않습니다.
저작권법에 따른 이용자의 권리는 위의 내용에 의하여 영향을 받지 않습니다. 이것은 이용허락규약(Legal Code)을 이해하기 쉽게 요약한 것입니다.
Disclaimer
저작자표시. 귀하는 원저작자를 표시하여야 합니다.
비영리. 귀하는 이 저작물을 영리 목적으로 이용할 수 없습니다.
변경금지. 귀하는 이 저작물을 개작, 변형 또는 가공할 수 없습니다.
공학박사 학위논문
Electrode Parameters on the Performance of Anion Exchange Membrane Fuel Cells with Platinum and Non-Precious Metal Catalysts
백금 및 비귀금속 촉매를 이용한 음이온 교환막 연료전지의 성능에 미치는
전극 인자들
2018 년 2 월
서울대학교 대학원
화학생물공학부
김 민 정
Abstract
Electrode Parameters on the Performance of Anion Exchange Membrane Fuel Cells with Platinum and Non-Precious Metal Catalysts
Min Jeong Kim School of Chemical and Biological Engineering Seoul National University
Anion exchange membrane fuel cells (AEMFCs) are the most promising alternative fuel cells for replacing proton exchange membrane fuel cells (PEMFCs) with the development of anion exchange polymer membranes. The numerous advantages of AEMFCs over conventional PEMFCs include having excellent fuel flexibility due to low overpotential for hydrocarbon fuel oxidation, less crossover of anodic fuels to the opposite direction leading to higher fuel efficiency, and reduced corrosion problems. The biggest advantage of AEMFCs is that they use inexpensive oxygen reduction catalysts like non-precious metals catalysts (NPMCs) and carbon-based catalysts because of the significant decrease of its oxygen reduction overpotential in alkali environments. The high cost of platinum (Pt), which is the most prevalent oxygen reduction catalyst, is one of the barriers to
i
expanding the market of fuel cells. Because the cost of the catalyst layer accounts for nearly half of the total material costs of a fuel cell stack, many researchers have focused on developing NPMCs instead. However, many cathodes made of NPMCs exhibited lower performance than Pt/C in the single-cell system even if they showed comparable or superior oxygen reduction activities to commercial Pt/C catalysts in a half-cell tests with rotating disk electrodes. In order to bring out the intrinsic electrochemical activity of these catalysts in a single-cell, it is important to understand and optimize the parameters in the membrane electrode assembly (MEA), which is the key component in the single-cell system. When the application of catalysts is extended from the half-cell to the single-cell, the parameters that are important for high performance are changed. One of the main reasons for the different trends between the half-cell and the single-cell results is because each have a different electrolyte type. In the case the half-cell system, almost all the active sites participate in the electrochemical reaction due to the use of liquid electrolyte solution. However, in the case of a single-cell system, only catalyst active sites at the triple-phase boundary, where the catalyst, solid electrolyte and reactant meet, contribute to the performance. The properties of the solid electrolyte and its distribution state in the catalyst layer play a key role in determining the ionic conductivity and microstructure of the catalyst layer, and therefore affect the performance of the single-cell system. Particularly, the ratio of the catalyst layer thickness to the membrane thickness is higher in AEMFCs than that in PEMFCs, therefore the ionic conductivity and mass transport can account for a larger portion
ii
of the performance. The other main reason of different trends is the management of the reactant and product. For the single-cell system, the supply of reactants and the removal of products are much more complicated than in the half-cell system. For AEMFCs in particular, water is a product at the anode side as a result of hydrogen oxidation reaction (HOR), but also a reactant for the oxidation reduction reaction (ORR) at the cathode side. Therefore, water management is a tricky task and very important especially in terms of ionic and concentration overpotential.
In the first chapter, after a brief introduction about polymer electrolyte membrane fuel cells and MEA, a detailed overview of AEMFCs follows.
In the second chapter, the studies on the important parameters in terms of MEA are discussed for AEMFCs using platinum catalyst cathode. The first study describes a simple method for enhancing the performance of alkaline anion exchange membrane fuel cells (AEMFCs) by reducing their ohmic overpotentials in the catalyst layer. Performance was increased due to the replacement of Cl− by OH−, which acts as a counter ion in the commercial ionomer and has greater ion conductivity than Cl−.The resistance characteristics of MEAs were verified by analyzing impedance spectroscopy results. Enhancement of ionic conductivity in the catalyst layer was larger in AEMFC with NPMCs. In addition, performance improvement by facilitating the mass transfer and ionic conduction in the catalyst layer through control of catalyst ink solution is discussed. The value of the dielectric constant of the solvent used for the dispersion of catalyst influences the pore structure in the catalyst layer and the performance of AEMFCs. For better water
iii
management, the effect of the presence of the mesoporous layer (MPL) and the degree of hydrophobicity of the gas diffusion layer (GDL) on the performance of AEMFCs was investigated.
In the last chapter, strategies for improving the performance of AEMFCs using NPMCs are discussed by engineering electrode structure. In the NPMCs system, particularly in the case of carbon based catalysts, since the density of the active sites is much lower than that of commercial Pt catalysts, a higher loading amount of catalysts is required, which results in an increase in mass and ohmic transport resistance. Two approaches were used to overcome these challenges. The first approach is applying a two-dimensional carbon sheet as the cathode catalyst to the AEMFCs to accomplish the high volumetric current density attributed to the thin carbon sheet structure, which can reduce the diffusion length in the catalyst layer.
The second approach is introducing the macroporous structure in the catalyst layer to enhance performance by improving the mass transfer, especially water diffusion, which is a critical factor for ionic conduction in the catalyst layer and a reactant for ORR.
Keywords: Membrane-electrode assembly (MEA), Anion Exchange Membrane Fuel Cells (AEMFCs), Electrochemistry, Non-precious metals catalysts (NPMCs), Catalyst layer structure.
Student Number: 2013-30278
iv
Contents
Abstract ...i
List of Tables ... viii
List of Figures ... ix
Chapter 1 Introduction ... 1
1.1 General Introduction of Fuel Cells ... 1
1.2 Components of Polymer Electrolyte Membrane Fuel Cells (PEMFCs) ... 5
1.3
Performance Loss of PEMFCs ... 8
1.4 General Introduction of Anion Exchange Membrane Fuel Cells (AEMFCs) ... 11
1.5 Current status and Challenges of AEMFCs ... 14
1.6 References ... 22
Chapter 2 Engineering the MEA parameters for Improving the Performance of AEMFCs with Platinum Cathode Catalyst ... 29
v
2.1 Introduction ... 29
2.2 Experimental ... 33
2.2.1 Materials Preparation
... 332.2.2 Characterizations and Electrochemical Test
... 342.3 Results and Discussion ... 36
2.3.1 Activation Method ... 36
2.3.2 Effect of Catalyst Ink Solvents ... 50
2.3.3 Effect of Gas Diffusion Layer properties ... 60
2.4 Conclusion ... 71
2.5 References ... 72
Chapter 3 Strategies for Improving the Performance of AEMFCs with Non Precious Metal Cathode Catalysts ... 78
3.1 Introduction ... 78
3.2 Experimental ... 82
3.2.1 Materials Preparation ... 82
3.2.2 Characterization and Electrochemical Test ... 83
3.3 Results and Disscusion ... 85
3.3.1 Applying Carbon Sheet Structure to Cathode Catalyst for High Volumetric Performance of AEMFC ... 85 3.3.2 Tailoring the Secondary Pore Structure in the Cathode
vi
Catalyst Layer for Improving the Mass Transfer ... 93
3.4 Conclusion ...104
3.5 References ...106
국문 초록 ... 112
vii
List of Tables
Table 2.1 Physical parameters of various dispersion solvents. ... 52 Table 2.2 Operating parameters ... 61 Table 2.3 The physical properties of GDLs ... 64
viii
List of Figures
Figure 1.1 Projected greenhouse gases for different alternative vehicle scenarios... 3 Figure 1.2 Schematic of single-cell components and structure ... 7 Figure 1.3 Illustration of characteristics of I-V curves for three main losses ... 10 Figure 1.4 Schematic of proton-exchange membrane fuel cells (PEMFCs) and
anion exchange membrane fuel cells (AEMFCs) ... 12 Figure 1.5 Direction of water movement in AEMFC ... 15 Figure 1.6 Two hydroxide ion transport mechanisms. Hydroxide ion (a) transport
through the water channel by forming and breaking of continuous H- bonds line in H-bonds network and (b) traversed across quaternary ammonium groups by following the rotation about C-CH2 single bond ... 17 Figure 2.1 Number of publications and citations per year about AEMFCs ... 31 Figure 2.2 (a) Polarization (●) and power density (○) curves of Pt/C catalyst,
(b) current density at 0.6 V and (c) maximum power density of single-cells with DI- and KOH-treated MEAs. ... 37 Figure 2.3 Cross sectional FE-SEM images of (a) DI- and (b) KOH-treated
MEAs. ... 38 Figure 2.4 (a) EDX spectrum and (b) FT-IR spectrum of solidified ionomer
after DI and KOH treatments. ... 41 ix
Figure 2.5 Nyquist impedance plots of the DI- and KOH-treated MEAs for H2/O2 operation at constant current of −2 A. ... 42 Figure 2.6 Equivalent circuit for the impedance of the catalyst layer of fuel cell
under (a) the faradaic condition and (b) non-faradaic condition... 44 Figure 2.7 (a) Nyquist impedance plots, (b) real part and (c) imaginary part of
complex capacitances as a function of log scale frequency of the DI- and KOH-treated MEAs for H2/N2 operation at 0.45 V... 48 Figure 2.8 (a) Polarization (●) and power density (○) curves and (b) FE-SEM
cross sectional FE-SEM image of MEA with NPMC. ... 49 Figure 2.9 The size distribution of ionomer agglomerates dispersed in the (a)
tert-butanol, (b) 2-propanol and (c) ethanol. Inset images are an optical micrograph of ionomer dispersion. (d) Average size of ionomer aggregates in accordance to solvents with different dielectric constants . ... 53 Figure 2.10 SEM images of the catalyst layer structure fabricated with different
catalyst dispersion solvent. (a) tert-butanol, (b) 2-propanol and (c) ethanol solvents ... 54 Figure 2.11 Polarization curves of AEMFCs using MEAs prepared with
different catalyst dispersion solvents under the conditions of (a) H2/O2 and (b) H2/Air. (c) Oxygen gain as a function of current density ... 55 Figure 2.12 Nyquist impedance plots of AEMFCs using MEAs prepared with
x
different catalyst dispersion solvents for H2/O2 operation at constant current of (a) -1 A, (b) -5A and (c) -10 A ... 58 Figure 2.13 Nyquist impedance plot of AEMFCs using MEAs prepared with
different catalyst dispersion solvents for H2/N2 operation at open- circuit voltage ... 59 Figure 2.14 The amount of water detected and calculated according to the HOR
and ORR at each side of electrode at constant current -3A ... 62 Figure 2.15 Cross sectional FE-SEM images of four different type of GDLs; (a)
CP, (b) CP H, (c) CPM L and (d) CPM H ... 66 Figure 2.16 (a) Polarization curves and (b) Nyquist plots of AEMFC using CPM
L and CPM H as the anode GDLs and CPM L as the cathode GDLs.
(Nyquist plot measured at -5 A) ... 67 Figure 2.17 Polarization curves of AEMFC using CP, CP H, CPM L and CPM
H as the cathode GDLs and CPM H as the anode GDLs. ... 70 Figure 3.1 Reported catalysts loading of NPMCs compared to Pt catalyst in the
half-cell system in several papers ... 80 Figure 3.2 Schematic illustration of synthesis of CS-FeN-C. ... 86 Figure 3.3 FE-SEM images of CS-FeN-C (a) before, (b) after removal of NaCl
and (c) its enlarged image. (d) TEM image of CS-FeN-C ... 87 Figure 3.4 FE-SEM cross sectional images of MEA with (a) CS-FeN-C and (b)
CB-FeN-C. (c) Polarization (○, △) and power density (●, ▲) curves of AEMFCs using CS- and CB-FeN-C (normalized by
xi
volume of cathode catalyst layer).. ... 89 Figure 3.5 FE-SEM cross sectional images of MEA with (a) CS-FeN-C and (b)
Pt/C 40 wt%. ... 91 Figure 3.6 (a) ORR polarization curves of CS-FeN-C and Pt/C. (b) Polarization
(○, △) and power density (●,▲) curves of CS-FeN-C and Pt/C normalized by volume of cathode catalyst layer. ... 92 Figure 3.7 FE-SEM images of (a) LP_FeN-C and (b) SP_FeN-N. Magnified
(c) SEM and (d) TEM images. ... 94 Figure 3.8 (a) ORR polarization curves of LP_FeN-C and SP_FeN-C. (b)
Polarization (○, △) and power density (●,▲) curves of LP_FeN-C and SP_FeN-C. ... 95 Figure 3.9 FE-SEM cross sectional images of MEA with (a) LP_FeN-C and
(b) SP_FeN-C cathodes. ... 97 Figure 3.10 (a) Pore size distribution of LP_FeN-C and SP_FeN-C cathodes. (b)
Changes in average secondary pore size and oxygen utilization in LP_FeN-C and SP_FeN-C cathodes.. ... 98 Figure 3.11 Polarization (○, △) and power density (●,▲) curves of AEMFCs
with LP_FeN-C and Pt/C cathodes.. ... 101 Figure 3.12 FE-SEM cross sectional images of MEA with (a) LP_FeN-C and
(b) Pt/C cathodes.. ... 102 Figure 3.13 (a) Pore size distribution of LP_FeN-C and Pt/C cathodes. (b)
xii
Oxygen gain as a function of current density for AEMFCs with LP_FeN-C and Pt/C cathodes ... 103
xiii
Chapter 1 Introduction
1.1 General Introduction of Fuel Cells
Fuel cells are an energy conversion device that change the chemical energy to electrical energy. Fuels (hydrogen, methanol and hydrazine etc.) react with oxidants (oxygen and air), concomitantly generating water and heat as byproducts and producing electricity as shown in the following equation.
H2 + 1/2 O2 → H2O
This reaction is spontaneous and thermodynamically favorable because the free energy of the water is less than that of hydrogen and oxygen. The theoretical standard potential of this reaction is 1.229 V at 298K. 1-2 The fuel cell was first called a gas voltaic battery when William Robert Grove invented it in 1842.3 This earliest fuel cell consisted of two porous platinum foil electrodes, which are immersed in aqueous sulfuric acid purged with hydrogen and oxygen gas separately. This resulted in producing constant current. These electrochemical reactions were hydrogen oxidation reaction (HOR) and oxygen reduction reaction (ORR), which are termed as the half-cell reaction occurring at the anode and cathode, respectively. These half-cell reactions varied depending on the electrolyte type of fuel cell and changes in the charge carrier. The proton and hydroxide ions
1
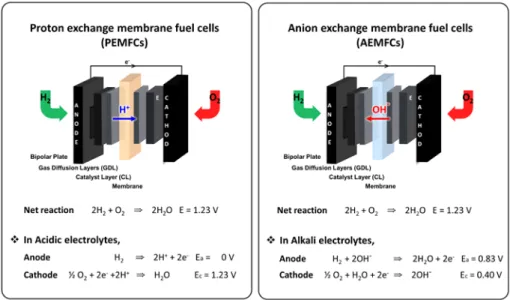
are charge carriers in acidic and alkaline electrolytes, respectively, and the half-cell reactions take place at the anode and cathode as follows.
In Acidic electrolytes,
Anode: 2H2 → 4H+ + e- Cathode: O2 + 4H+ + 4e- → 2H2O In Alkaline electrolytes,
Anode: 2H2 + 4OH- → 2H2O Cathode: O2 + 2H2O + 4e- → 4OH-
Fuel cells are generally classified into six types, according to the electrolyte type; proton exchange membrane fuel cells (PEMFCs), direct methanol fuel cells (DMFCs), anion exchange membrane fuel cells (AEMFCs), phosphoric acid fuel cells (PAFCs), molten carbonate fuel cells (MCFCs), solid oxide fuel cells (SOFCs).
Among these, proton exchange membrane fuel cells (PEMFCs) have been the most intensively studied. They have been applied to fuel cell electric vehicles (FCEVs) as an alternative to the internal combustion engine. FCEVs have the potential to significantly reduce our dependence on foreign oil and lower harmful emissions that contribute to climate change. Computer simulations have been carried out to estimate the reduction effect of greenhouse gas emission. As shown in Figure 1.1, all types of electric vehicles reduce greenhouse gas emission, and
2
Figure 1.1 Projected greenhouse gases for different alternative vehicle scenarios [Sources: C.E. Thomas, the National Hydrogen Association Annual Meeting documents]
3
the reduction rate of FCEVs is the largest among the electric vehicles studied.4 FCEVs produce their own electricity. Hydrogen fuel stored in the fuel tank is fed into a fuel cell stack. Then, air combines with the hydrogen fuel and a chemical reaction takes place generating electricity, which is directed to an electric motor.
This fuel cell stack is composed of individual single-cells that are connected in a series to increase the voltage of the system.
4
1.2 Components of Polymer Electrolyte Membrane Fuel Cells (PEMFCs)
This single-cell is composed of the bipolar plate, gas diffusion layers, catalyst layers for each side of electrode, and the polymer electrolyte membrane. The membrane-electrode-assembly (MEA), which is composed of gas diffusion layers, catalyst layers and the polymer electrolyte membrane, is the key component of single-cell and determine the performance of single-cell (Figure 1.2).
(1) The catalyst layer is where the electrochemical reaction occurs and is deposited on each side of the membrane. A hydrogen electro-oxidation reaction and oxidation electro-reduction reaction occur at the anode and cathode side, respectively. The catalyst layer must have high electrochemical stability in the reaction environment of both electrodes.
(2) The polymer electrolyte membrane acts not only as a conducting medium that permits counter ion to pass between the anode and cathode (proton for PEMFCs, hydroxide ion for AEMFCs), but it also as a separator that prevents physical contact between the two reaction gases. Therefore, the membrane should have a high counter ion conductivity but an electron conductivity close to zero. It should also have a low gas permeability to prevent the mixed potential due to the crossover phenomenon.
5
(3) The gas diffusion layers located between the catalyst layer and bipolar plate facilitate transport of the reactant to catalyst layer and removal of product from it. Therefore, high permeability to the reaction gas is required.
In addition, it is necessary to sufficiently maintain the wetting of the electrolyte membrane, while allows generated water to be discharged without being flooded into the catalyst layer.
6
Figure 1.2 Schematic of single-cell components and structure
7
1.3 Performance Loss of PEMFCs
An ideal fuel cell maintains a constant voltage determined by thermodynamics, and supplies all the currents as long as sufficient fuel is supplied. The reversible open cell voltage of a fuel cell is related to the change in Gibbs free energy of the reaction as indicated by following equation.
E0 = - ∆G0 / n∙F
The value of ∆G0 is -237.13 kJ /mol when the produced water is liquid phase, n is 2, and hence the calculated value of E0 is 1.229 V. 5 However, the practical fuel cell voltage is less than the thermodynamically calculated voltage due to irreversible losses. There are three main types of losses in fuel cells, which are related to one of the steps in the fuel cell reaction. Their respective proportions depend on the current density, therefore, there is a characteristic current-voltage curve shape depending on the loss factor. (Figure 1.3). The types of losses are as follows.
(1) Activation loss due to the reaction kinetics, which involves the transfer of electrons between an electrode surface and a reactant. This term is related to the intrinsic catalytic activity. Also, an increase in catalyst loading or active site density can reduce activation loss.
(2) Ohmic loss from ionic and electronic resistance in the electrode, polymer electrolyte and interconnection. Therefore, it is possible to reduce the ohmic
8
loss by using a material (catalysts and supporting materials) that has high electron conductivity or an ionomer that has good ion conductivity. Since the ionic conductivity depends on the hydration state of the ionomer, the humidity control in the MEA is also important in reducing the ohmic loss.6
(3) Concentration loss due to mass transport that controls the supply and removal of reactants and products in fuel cells. The most well-known method to improve concentration loss is to control the pore structure of the catalyst layer. The pore structure in the catalyst layer is divided into two types in terms of MEA; the primary pore and the secondary pore. The primary pores exist inside and between the primary particles in the agglomerate. It acts as a reaction sites in the range of mesopores (smaller than 50 nm). The secondary pores are present between the aggregates in a range greater than 50 nm. These are the transport pathway of reactants and products in the catalyst layer.7
9
Figure 1.3 Illustration of characteristics of I-V curves for three main losses 5
10
1.4 General Introduction of Anion Exchange Membrane Fuel Cells (AEMFCs)
The alkaline fuel cell was the first type of fuel cell widely used in an industrial application in 1960s for the U.S space program to produce electrical energy and water onboard their spacecraft.8 Early alkaline fuel cells used a liquid electrolyte solution, in which potassium hydroxide was dissolved in water. However, because of this structure, it has suffered from problems like liquid electrolytes leaking and carbonate precipitation caused by reactions with CO2. These difficulties lead to the prohibition of widespread usage of alkaline fuel cells (AFCs) as an alternative energy source. Since the development of an anion exchange membrane that was able to conduct hydroxide ion, there has been increasing interest worldwide for developing AFCs which use a polymer membrane instead of liquid electrolytes. AFCs using polymer membrane are generally called anion exchange membrane fuel cells (AEMFCs), alkaline membrane fuel cells (AMFCs) or hydroxide exchange membrane fuel cells (HEMFCs). AEMFCs are very similar in structure to PEMFCs but the reaction mechanism and main issues are very different (Figure 1.4).
The advantages of AEMFCs over conventional PEMFCs are summarized as follows. (1) The electrode kinetics of the cathode reduction reaction are much more facile in a high-pH (alkaline) environment compared to the lower-pH (acidic) environment in PEMFCs9,10 ; (2) various Pt-free materials like Co, Cu, Ag, Ni,
11
Figure 1.4 Schematic of proton-exchange membrane fuel cells (PEMFC) and anion exchange membrane fuel cells (AEMFCs).
12
N-doped carbon, and perovskite can be used as catalysts in AEMFCs, whereas almost every catalyst containing non-noble metals are unstable in the acidic environment of PEMFCs11-15; (3) fuel flexibility is excellent due to the low overpotential of hydrocarbon fuel oxidation16-19; and (4) the crossover of anodic fuels to the opposite direction are suppressed because hydroxide anion and electro- osmotically driven water molecules generally migrate from cathode to anode.
13
1.5 Current status and Challenges of AEMFCs
Early studies on AEMFCs focused on improving the hydroxide conductivity in anion exchange membrane (AEM) because the activation energy for the hydroxide conduction in AEM was nearly two times that of the proton conduction in proton exchange membrane (e.g. Nafion).20 As a result of intensive research to develop AEM since early 2000, the hydroxide conductivity has increased from about 20 mS cm-1 to 130 mS cm-1 and the maximum power density of AEMFCs is 1160 mW cm-2, comparable to that of PEMFCs. However, there are still several challenges to be solved for commercialization.21
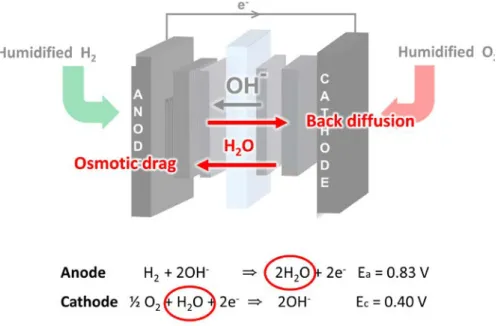
One of the significant challenges is water management under the operando conditions. Water management in AEMFCs plays an important role in determining the performance of fuel cells but it is also more complicated than in PEMFCs. This is because water is a product of the hydrogen oxidation reaction and simultaneously a reactant for oxygen reduction reaction during cell operation.
Therefore, water flooding should be prevented at the anode side and water should not dry out at the cathode side. Research on the water management in the device has been carried out in recent years.22-25 In AEMFCs, water is moved from the cathode to the anode by electro-osmotic drag and also can be opposite from the anode to the cathode by back diffusion due to the water concentration gradient (Figure 1.5). The dominant direction and the amount of water transport is
14
Figure 1.5 Direction of water movement in AEMFC.
15
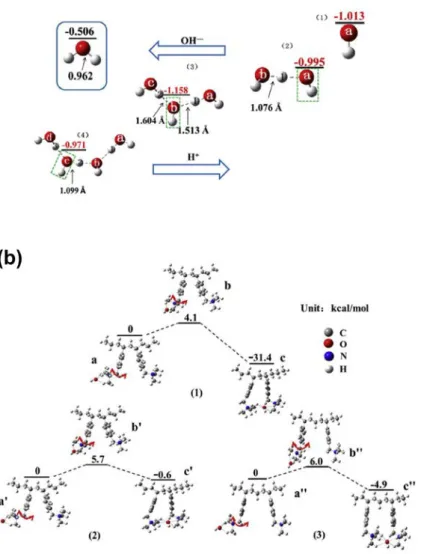
determined by the properties of AEM. Han Zhang et al.26 insist that the cell performance can be improved by promoting the back diffusion using the hydrophilic AEM and controlling the relative humidity of anode gas to prevent the water flooding. Also, hydration state in the AEMFCs also impact on the activation energy for the hydroxide conduction in AEM. The hydroxide ion transport mechanisms are considered to be Grotthuss and Vehicular mechanisms based on the research using the molecular dynamics and density functional theory (DFT).
Guoqing Yang et al. demonstrated two minimum energy pathways for hydroxide transport (Figure1.6) in AEM and used DFT to calculate the energy barrier in the rate determining step, which is significantly reduced in water solutions.27
Low long-term stability is one of the factors preventing commercialization of AEMFCs. There are two main reasons that inhibits the stability of the membrane.
One is the nucleophilic attack that occurs when the hydroxide transport from the cathode to anode. The nucleophilic OH- anions can react with the functional group in the ionomer and remove it, increasing ohmic resistance, in turn dramatically reducing the performance. Recently, it has been reported that the stability of the functional group can be improved by increasing the hydration number in the device.28 Based on the DFT calculation and experiment, it was confirmed that as the number of water molecules solvating the hydroxide ion increases, the activation energy required for nucleophilic attack increases. The functional group was rapidly decomposed when
16
Figure 1.6 Two hydroxide ion transport mechanisms. Hydroxide ion (a) transport through the water channel by forming and breaking of continuous H- bonds line in H-bonds network and (b) traversed across quaternary ammonium groups by following the rotation about C-CH2 single bond. (Adapted from Guoqing Yang et al. nt. J. Hydrog. Energy., 41, 6877-6884, 2016)
17
the hydration number was less than 4. Therefore, these results imply that maintaining a high hydration number in the actual device is crucial for ensuring the long-tern stability of AEM and AEI.
The other reason for the stability issue of AEMFCs is its susceptibility to poisoning by carbon dioxide (CO2). It has been demonstrated in many papers that performance of AEM are still considerably affected by CO2.29-31 Although precipitation of metal hydroxide cannot occur because cationic moieties are fixed to the polymer chain and are not freely mobile as in a liquid electrolyte, hydroxyl ion is substituted to CO32-
or HCO3- when exposed to air (see reaction (1) and (2)) 29
(1) OH- + CO2 ↔ HCO3- (2) HCO3- + OH- ↔ CO32-
+ H2O
Carbonation of hydroxide ions increases the ohmic resistance and lowers the local pH at the anode side, thereby degrading the performance of the AEMFCs.
Yanagi et al.32 reported rapid exchange of OH- in AEM to carbonate form within 30 min after it was exposed to air, leading to a decrease in ionic conductivity of AEM by a factor of about 1/4 (42 mS cm-1 to 10 mS cm-1). More importantly, Gunasekara et al.33 has reported on the effect of carbonate exchange on the half- cell performance with the membrane while introducing humid gas. As a result, it seems not to change the ORR kinetics that much, but lowering the oxygen
18
permeability by one order of magnitude hindering the mass transport of the reactant. Bharath et al.34 reported the correlation between this CO2 uptake and the degree of membrane hydration; the increase in hydration level opens the pores of the membrane, increasing the approach of CO2 and thus increasing the interaction between cationic head groups and carbonate ions. Varcoe et al.35 proposed the self-purging method in which the carbonate ions are released from the anode as CO2 and replaced with OH- by activating the AEMFCs at a high current density as shown in the following equation.20, 35
H2 + CO32- → CO2 + H2O + 2e-
Recently, Katayama et al.36 reported on the new approach to improve the CO2
tolerance. Under the supply of H2 gas containing NH3 to anode and ambient air to the cathode, the performance of the AEMFC was improved compared to the performance of the AEMFC with supply of pure hydrogen to anode.
Low HOR performance in AEMFCs is another critical issue. In an alkaline environment, HOR proceeds to either Tafel–Volmer or Heyrovsky–Volmer reactions as shown in the following reaction equations.37
Tafel step H2 ↔ 2Had
19
Heyrovsky step H2 + OH - ↔ Had + e - + H2O Volmer step Had + OH - ↔ H2O + e -
HOR kinetics on Pt are several orders of magnitude slower in alkaline electrolytes than in acidic electrolytes.8 Therefore, it is crucial to establish the reason for poor HOR activity in alkaline electrolytes and develop the high performance of HOR catalysts.
It has been known that the use of PtRu as the anode catalyst exhibits higher performance in a single-cell as well as a half cell in an alkaline electrolyte than when Pt is used as an anode catalyst.38, 39 However, the reason for the performance improvement of PtRu is under debate. The first interpretation of the reason for improvement is the bifunctional effect proposed by Strmcnik et al. 39 Ru, which has stronger oxophilicity than Pt, provides active sites for the adsorption of hydroxides and reacts with hydrogen absorbed on the Pt surface, promoting the HOR reaction. The enhancement of HOR performance as an anode catalyst of Pd-CeO2 was also interpreted as a bifunctional effect.40 The other interpretation is the electronic effect. The alloy of Pt and Ru accelerates the HOR by changing the electronic structure of Pt and lowering the binding energy of the hydrogen adsorbed on the Pt surface.38, 41 Besides the low intrinsic catalytic activity of Pt in alkaline conditions, another reason for low HOR performance is
20
due to the interaction between the functional groups of ionomer and Pt surface.
Chunk et al.42 reported that the cationic functional group-hydroxide-water adsorption layer on the Pt surface inhibits hydrogen diffusion, resulting in low HOR activity.
21
1.6 References
1. O. Pilatowsky, R. J. Romeo, C. A. Isaza, S. A. Gamboa, P. J. Sebastian, W. Rivera, Cogeneration fuel cell-sorption air conditioning systems, Springer Science &
Business Media, 2011.
2. J. Larminie, A. Dicks, Fuel cell systems explained, SAE International and John Wiley & Sons, 2003.
3. J. Wisniak, Electrochemistry and Fuel Cells: The Contribution of William Robert Grove, Indian Journal of History of Science, 50.3, 476-490, 2015.
4. The National Hydrogen Association, Comparison of plug-in hybrids, fuel cell EVs and battery EVs, http://www.hydrogen.energy.gov/pdfs/htac_july09_10_h2gen.
5. R. O'Hayre, S. Cha, W. Colella, F. B. Prinz, Fuel cell fundamentals, John Wiley
& Sons, 2009.
6. S Balog, U Gasser, K Mortensen, K. Mortensen, L. G.ubler, G. G. Scherer, H. B.
youcef, Correlation between Morphology, Water Uptake, and Proton Conductivity in Radiation-Grafted Proton-Exchange Membranes, Macromolecular Chemistry and Physics, 211, 635-643, 2010.
7. M Uchida, Y Fukuoka, Y Sugawara, N Eda, A. Ohta, Effects of Microstructure of
22
Carbon Support in the Catalyst Layer on the Performance of Polymer‐Electrolyte Fuel Cells, Journal of the Electrochemical Society, 143, 2245-2252, 1996.
8. M. Warshay, P. R. Prokopius, The fuel cell in space: yesterday, today and tomorrow, Journal of Power Sources, 29, 193-200, 1990.
9. B.B. Blizanac, P.N. Ross, N.M. Markovic, Oxygen electroreduction on Ag(1 1 1): The pH effect, Electrochimica Acta, 52, 2264–2271, 2007.
10. W. Sheng, H. A. Gasteiger, Y. Shao-Horn, Hydrogen oxidation and evolution reaction kinetics on platinum: acid vs alkaline electrolytes, Journal of the Electrochemical Society, 157, B1529-B1536, 2010.
11. Q. Hu, G. Li, J. Pan, L. Tan, J. Lu, L. Zhuang, Alkaline polymer electrolyte fuel cell with Ni-based anode and Co-based cathode, International Journal of Hydrogen Energy, 38, 16264–16268, 2013.
12. K. Miyazaki, N. Sugimura, K. Matsuoka, Y. Iriyama, T. Abea, M. Matsuoka, Z.
Ogumia, Perovskite-type oxides La1−xSrxMnO3 for cathode catalysts in direct ethylene glycol alkaline fuel cells, Journal of Power Sources 178, 683–686, 2008.
13. A. Kucernak, F. Bidault, G. Smith, Membrane electrode assemblies based on porous silver electrodes for alkaline anion exchange membrane fuel cells, Electrochimca Acta, 82, 284– 290, 2012.
23
14. C. Coutanceau, L. Demarconnay, C. Lamy, J.-M. Léger, Development of electrocatalysts for solid alkaline fuel cell (SAFC), Journal of Power Sources, 156, 14–19, 2006.
15. T. Sakamoto, K. Asazawa, J. Sanabria-Chinchilla, U. Martinez, B. Halevi, P.
Atanassov, P. Strasser, H. Tanaka, Combinatorial discovery of Ni-based binary and ternary catalysts for hydrazine electrooxidation for use in anion exchange membrane fuel cells, Journal of Power Sources, 247, 605-611, 2014.
16. C. Wang, B. Shen, C. Xu, X. Zhao, J. Li, Side-chain-type poly (arylene ether sulfone) s containing multiple quaternary ammonium groups as anion exchange membranes, Journal of Membrane Science, 492, 281–288, 2015.
17. N. Fujiwara, Z. Siroma, S. Yamazaki, T. Ioroi, H. Senoh, K. Yasuda, Direct ethanol fuel cells using an anion exchange membrane, Journal of Power Sources, 185, 621–626, 2008.
18. E. Antolinia, E.R. Gonzalez, Alkaline direct alcohol fuel cells, Journal of Power Sources, 195, 3431–3450, 2010.
19. K. Matsuoka, Y. Iriyama, T. Abe, M. Matsuoka, Z. Ogumia, Alkaline direct alcohol fuel cells using an anion exchange membrane, Journal of Power Sources, 150, 27–31, 2005.
20. S. Gottesfeld, D. R. Dekel, M. Page, C. Bae, Y. Yan, P. Zelenay, Y. S. Kim, Anion 24
exchange membrane fuel cells: Current status and remaining challenges, Journal of Power Sources, 375, 170-184, 2018.
21. L. Wang, E. Magliocca, E.L. Cunningham, W.E. Mustain, S.D. Poynton, R.
Escudero-Cid, M.M. Nasef, J. Ponce-González, R. Bance-Souahli, R.C.T. Slade, D.K. Whelligan, J.R. Varcoea, An optimised synthesis of high performance radiation-grafted anion-exchange membranes, Green Chemistry, 19 , 831–843, 2017.
22. B. S. Machado, N. Chakraborty, P. K. Das, Influences of flow direction, temperature and relative humidity on the performance of a representative anion exchange membrane fuel cell: A computational analysis, International Journal of Hydrogen Energy, 42, 6310-6323, 2017.
23. S. Huo, H. Deng, Y. Chang, K. Jiao, Water management in alkaline anion exchange membrane fuel cell anode, International Journal of Hydrogen Energy, 37, 18389-18402, 2012.
24. H.-S. Shiau, I. V. Zenyuk, A. Z. Weber, Water management in an alkaline- exchange-membrane fuel cell, ECS Transactions, 69, 985-994, 2015.
25. Y.-J. Sohn, J. -I. Choi, K. Kim, Numerical analysis on water transport in alkaline anion exchange membrane fuel cells, Electrochemistry, 83, 80-83, 2015.
26. H. Zhang, H. Ohashi, T. Tamaki, T. Yamaguchi, Water movement in a solid-state 25
alkaline fuel cell affected by the anion-exchange pore-filling membrane properties, The Journal of Physical Chemistry C, 117, 16791-16801, 2013.
27. G. Yang, J. Hao, J. Cheng, N. Zhang, G. He, Hydroxide ion transfer in anion exchange membrane: A density functional theory study, International Journal of Hydrogen Energy, 41, 6877-6884, 2016.
28. D. R. Dekel, M. Amar, S.Willdorf, M. Kosa, S. Dhara, C. E. Diesendruck, Effect of water on the stability of quaternary ammonium groups for anion exchange membrane fuel cell applications, Chemistry of Materials, 29, 4425-4431, 2017.
29. T. D. Myles, K. N. Grew, A. A. Peracchio, W. K. S Chiu, Transient ion exchange of anion exchange membranes exposed to carbon dioxide, Journal of Power Sources, 296, 225-236, 2015.
30. J. A. Wrubel, A. A. Peracchio, B. N. Cassenti, T. D.Myles, K. N. Grew, W. K.
S.Chiu, Anion exchange membrane ionic conductivity in the presence of carbon dioxide under fuel cell operating conditions, Journal of the Electrochemical Society, 164, F1063-F1073, 2017.
31. S. Suzuki, H. Muroyama, T. Matsui, K. Eguchi, Influence of CO2 dissolution into anion exchange membrane on fuel cell performance, Electrochimica Acta, 88, 552-558, 2013.
32. H. Yanagi, K. Fukuta, Anion exchange membrane and ionomer for alkaline 26
membrane fuel cells (AMFCs), ECS transactions, 16, 257-262, 2008.
33. I. Gunasekara, M. Lee, D. Abbott, S. Mukerjee, Mass Transport and Oxygen Reduction Kinetics at an Anion Exchange Membrane Interface: Microelectrode Studies on Effect of Carbonate Exchange, ECS Electrochemistry Letters, 1, F16- F19, 2012.
34. V. J. Bharath, J. R. Jervis, J. J. Bailey, E. Engebretsen, T. P. Neville, J. Millichamp, T. Mason, P. R. Shearing, R. J. C. Brown, G. Manos, D. J. L. Brett, Effect of humidity on the interaction of CO2 with alkaline anion exchange membranes probed using the quartz crystal microbalance, International Journal of Hydrogen Energy, 42, 24301-24307, 2017.
35. L. A. Adams, S. D. Poynton, C. Tamain, R. C. T. Slade, J. R. Varcoe, A carbon dioxide tolerant aqueous-electrolyte-free anion-exchange membrane alkaline fuel cell, ChemSusChem, 1, 79-81, 2008.
36. Y. Katayama, K. Yamauchi, K. Hayashi, T. Okanishi, H. Muroyama, T. Matsui, Y.
Kikkawa,T. Negishi, S. Watanabe, T. Isomura, K. Eguchi, Anion-exchange membrane fuel cells with improved CO2 tolerance: Impact of chemically induced bicarbonate ion consumption, ACS Applied Materials & Interfaces, 9, 28650- 28658, 2017.
37. W. Sheng, A. P. Bivens, M. N. Z. Myint, Z. Zhuang, R. V. Forest, Q. Fang, J. G.
27
Chen, Y. Yan, Non-precious metal electrocatalysts with high activity for hydrogen oxidation reaction in alkaline electrolytes, Energy & Environmental Science, 7, 1719-1724, 2014.
38. Y. Wang, G. Wang, G. Li, B. Huang, J. Pan, Q. Liu, J. Han, L. Xiao, J. Lu, L.
Zhuang, Pt–Ru catalyzed hydrogen oxidation in alkaline media: oxophilic effect or electronic effect?, Energy & Environmental Science, 8, 177-181, 2015.
39. D. Strmcnik, M. Uchimura, C. Wang, R. Subbaraman, N. Danilovic, D. Vliet, A.
P. Paulikas, V. R. Stamenkovic, N. M. Markovic, Improving the hydrogen oxidation reaction rate by promotion of hydroxyl adsorption, Nature Chemistry, 5, 300-306, 2013.
40. H. A. Miller, A. Lavacchi, F. Vizza, M. Marelli, F. D. Benedetto, F. D’Acapito, Y.
Paska, M. Page, D. R. Dekel, A Pd/C‐CeO2 anode catalyst for figh‐performance platinum‐free anion exchange membrane fuel cells, Angewandte Chemie, 128, 6108-6111, 2016.
41. J. Durst, A. Siebel, C. Simon, F. Hasch´e, J. Herranz and H. A. Gasteiger, New insights into the electrochemical hydrogen oxidation and evolution reaction mechanism, Energy & Environmental Science, 7, 2255-2260, 2014.
42. H. T. Chung, U. Martinez, I. Matanovic, Y. S. Kim, Cation–hydroxide–water coadsorption inhibits the alkaline hydrogen oxidation reaction, The Journal of Physical Chemistry Letters, 7, 4464-4469, 2016.
28
Chapter 2 Engineering the MEA parameters for Improving the Performance of AEMFCs with Platinum Cathode Catalyst
Some parts have been reedited from published results entitled “A Facile Approach to Improve the Performance of Alkaline Anion Exchange Membrane Fuel Cells
by Reducing Ionic Resistance”, J. Ind. Eng. Chem., 2017.
2.1 Introduction
Anion exchange membrane fuel cells (AEMFCs) are an alternative to PEMFCs, which have gained much attention in recent years. The most notable advantage of AEMFC is its ability to use inexpensive materials for catalysts due to high pH operating conditions1. Although numerous research has reported excellent performance of their synthesized catalysts compared to Pt in the half cell system, this does not always mean it will be superior in the case of single- cell system2-5. To overcome the challenges with different trends of performance between single-cell and half-cell systems, the optimization of the MEA condition should be prioritized.
MEA is the critical component of the single-cell system of polymer electrolyte membrane fuel cells (PEMFCs), which is composed of a gas diffusion
29
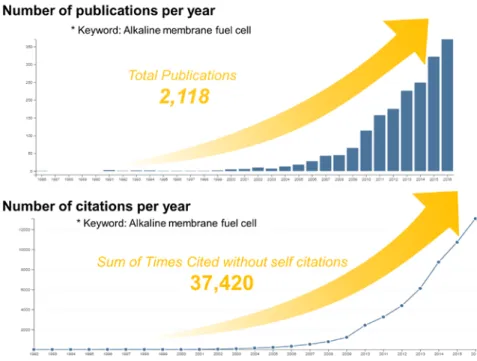
layers (GDLs), polymer electrolyte membrane, and catalyst layers. The performance of the single-cell is determined by the properties of each component of the MEA rather than the intrinsic activity of the catalyst itself. PEMFCs with a system similar to AEMFCs have been greatly improved through the study of MEA. By using carbon supported Pt instead of Pt black as the catalyst, the amount of catalyst loading is reduced by 90 % and the catalyst layer thickness also decreased 6. Furthermore, by impregnating the interstitial spaces between catalyst particles with proton conducting material (i.e. Nafion as an ionomer), the performance improved by more than 16 times than before7. To date, more than 2000 research papers on alkaline fuel cells have been published and have recorded up to 4000 citation counts (Figure 2.1). Despite the importance of membrane- electrode-assembly (MEA) to improve the performance of fuel cells, papers that studied in terms of MEA make up only 3 % of the total publications on AEMFCs.
Understanding the parameters that control the performance of MEA is of critical importance for realizing high performance of AEMFCs.
The main parameters that determines the performance of MEA are considered to be ionic conduction and mass transport in the catalyst layer. The properties of the polymer electrolyte and the catalyst layer hydration, which is controlled by precise adjustments on the fabricating MEA and operating conditions, are the important for the high ionic conductivity in the electrode 8, 9. In this respect, mass
30
Figure 2.1 Number of publications and citations per year about AEMFCs
31
transport and ionic conduction are closely correlated. Particularly, the ratio of the catalyst layer thickness to the membrane thickness is higher in AEMFCs than in PEMFCs10, therefore the ionic conductivity and mass transport in the catalyst layer can account for a larger portion of the performance than in PEMFCs case. In particular, for AEMFCs, water is not only the product at the anode side as a result of hydrogen oxidation reaction (HOR), but also the reactant for oxidation reduction reaction (ORR) at the cathode side. Therefore, water management is a tricky task but also very important especially in terms of ionic and concentration overpotential.
Water should be evenly distributed within the catalyst layer for high ion conductivity and ORR but should not block the reaction site and gas transport path of GDL.
In this chapter, I investigated the effect of MEA parameters on performance through the AEMFCs using a platinum catalyst cathode. First, the pretreatment method for activating the MEA is suggested for reducing their ohmic overpotentials in the catalyst layer. Subsequently, the effect of the catalyst layer structure on the performance of AEMFCs was investigated using catalyst ink solvents with different dielectric constants. Finally, the GDL properties were changed to optimize water management.
32
2.2 Experimental
2.2.1 Materials Preparation Preparation of MEAs
The catalysts powder, commercial ionomers (Different types of ionomers have been used for each part of this thesis due to the problem of supply from the manufacturers) and solvents were mixed and sonicated. An in-house pore-filling membrane was used. Before the deposition of catalyst layer onto the membrane, all the membranes were immersed in 1M KOH solution and rinsed in deionized (DI) water to remove excess OH- ions and other ions from the KOH solution.
The homogenized catalyst inks were deposited onto the membrane by the spraying method. The catalyst loading of Pt/C 40 wt% and the synthesized non- precious metals catalyst (NPMC) were 0.5 mg cm−2 and 2 mg cm−2, respectively.
The anode used for all AEMFC tests in this work was Pt/C 40 wt% with a load of 0.5 mg cm−2. The fabricated catalyst coated membranes (CCM) were dried for 1 day in air before testing. The CCM was immersed in 1 M KOH solution for 1 hour and then rinsed with DI water to remove excess OH− and other ions that may have been present on the electrode and on the membrane. Four different types of Carbon papers were used as a gas diffusion layer and placed next to the CCMs (detailed properties of carbon papers are described in 2.3.3).
The active electrode area was 5 cm2.
33
2.2.2 Characterizations and Electrochemical Test Characterization techniques
The field-emission scanning electron microscopy (FE-SEM, MERLIN Compact, ZEISS) and energy-dispersive X-ray spectroscopy (EDX, SU70, Hitachi) were used to characterize the morphology and chemical properties of the electrode and the anion exchange ionomer. FT-IR spectroscopy (Nicolet 6700, Thermo Scientific) was performed in attenuated total reflectance (ATR) mode. For the analysis of the ionomer by FT-IR and EDX spectroscopy, solidified ionomer was prepared by casting ionomer solution onto a silicon wafer. The size of ionomer agglomerates in the various solvents were measured by an electrophoretic light scattering spectrophotometer (ELS Z-1000, Otsuka Electronics). Mercury porosimetry (Micro Active AutoPore V 9600, Micromeritics) was used to investigate the pore size of the carbon papers. The water contact angles of the carbon papers were measured using a contact angle analyzer (Phoenix-300 Touch, S.E.O)
Electrochemical analysis
The performance of AEMFCs was tested using the fuel cell test system (CNL energy Co.). Humidified hydrogen and oxygen gases were fed to the anode and cathode sides of a single-cell, respectively, at a constant flow while operating the
34
single-cell. For the decarbonation within the cell, a constant voltage at 0.1 V was applied to the single-cell before the test. Polarization curves were measured using a current-sweep method with a rate of 10 mA cm-2 s-1 while maintaining the cell temperature at 50 °C. While operating fuel cells, the total outlet pressures were 150 kPa and atmospheric pressure for NPMC and Pt/C, respectively. Electrochemical impedance spectroscopy (EIS) was performed in galvanostatic mode at a constant current with an amplitude of 5 % of the constant current in the range from 10 mHz to 100 kHz. To compare the ionic resistance in the cathodes, humidified hydrogen and nitrogen gases were supplied to the anode and cathode, respectively. The temperature of the cell was maintained at 30 °C. The applied cell voltage was 0.45 V under a non-faradaic reaction with frequency ranging from 10 mHz to 100 kHz.
35
2.3 Results and Discussion
2.3.1 Activation Method
The single-cell results of DI- and KOH-treated MEA using AEMFC are shown in Figure 2.2. The performance of KOH-treated MEA exhibited higher performance than that of DI-treated MEA. The maximum power densities were 198 and 264 mW cm−2 for the DI- and KOH-treated MEA, respectively. The difference between the polarization curves of the DI- and KOH-treated MEA was observed in the intermediate current density region, where the ohmic resistance is the dominant factor governing the performance of single-cell11. The membranes used for both MEAs were treated with KOH solution before depositing the catalyst layer onto it. Hence, the difference in performance between KOH- and DI-treated MEAs is attributed to the difference in the catalyst layer property, especially the ionomer state. The open circuit voltages (OCV) were similar because the catalyst and its loading amount were identical for both MEAs.
Therefore, catalyst layer thickness of the DI- and KOH-treated MEAs were almost same (~14 μm) as can be observed in the cross-sectional FE-SEM images in Figure 2.3. Thus, in the low current density region, where the voltage loss is mainly affected by the activation overpotential12, the polarization curves for the two MEAs were similar to each other. The higher performance of KOH-treated MEA
36
Figure 2.2 (a) Polarization (●) and power density (○) curves of Pt/C catalyst, (b) current density at 0.6 V and (c) maximum power density of single-cells with DI- and KOH- treated MEAs.
37
Figure 2.3 Cross sectional FE-SEM images of (a) DI- and (b) KOH-treated MEAs.
38
at intermediate current density is attributed to the replacement of Cl− to OH−, leading to decrease in ohmic resistance because the ionic conductivity of OH− was more than twice that of Cl−13, 14. To demonstrate the reason for the enhanced performance, the changes in ionomer properties were analyzed by EDX and FT-IR spectroscopy.
To confirm the presence of Cl− as the counter anion in the ionomer, EDX analysis was conducted with the solidified anion exchange ionomer (Figure 2.4(a)). The signal corresponding to Kα of Cl− peak is clearly observed in the EDX spectrum of DI-treated solidified ionomer at around 2.6 keV. The atomic (weight) percentage of Cl− in the ionomer was decreased from 1.90 % (5.21 %) to 0.07 % (0.21 %) after KOH treatment. The observed Si peak near 1.7 keV is from the substrate. A comparison of the hydroxide peak in the FT-IR spectra of KOH- and DI-treated solidified ionomers supports the replacement of Cl− to OH− (Figure 2.4(b)). Wide OH– absorption peak at 3716–3050 cm–1 was only observed in the spectrum of the KOH-treated solidified ionomer. This result is consistent with EDX data and indicates that Cl– was successfully replaced with OH– through the KOH treatment. The absorption peak at 1660–1537 cm–1, corresponding to the C=O groups, were only detected in KOH-treated solidified ionomer. This could be due to the carbonization of some portion of the substituted OH– to CO32− or HCO3–
while drying the solidified ionomer to remove the water contained in it. It is
39
generally known that OH– in the AEM reacts with CO2 when the air supply to the cathode side and converted to HCO3- as shown in the following reaction equations15.
OH - + CO2 ↔ HCO3-
HCO3- + OH - ↔ CO32- + H2O
Therefore, the observed C=O group peaks can be considered to be the evidence for the existence of OH– in the KOH-treated solidified ionomer.
To clarify the reason for ohmic overpotential difference between the two MEAs, EIS analysis of the MEAs should be performed. EIS for the faradaic condition was performed in galvanostatic mode under single-cell operating conditions to keep the same amount of water in the catalyst layer. Figure 2.5 shows Nyquist plots measured at a current of −2 A, where the ohmic resistance is the dominant cause for the loss in cell potential. For porous electrode, the high- frequency intercept on the real impedance axis corresponds to the sum of the ionic resistance of membrane and ohmic resistance, which in turn is attributed to the ionic and electronic resistance through the catalyst layer, and the diameter of the semicircle represents the charge transfer resistance of reaction16. The impedance spectra showed a reduction in ohmic and charge transfer resistances after KOH treatment. At this point on the spectra, the ionic resistance of the membrane and
40
Figure 2.4 (a) EDX spectrum and (b) FT-IR spectrum of solidified ionomer after DI and KOH treatments.
41
Figure 2.5 Nyquist impedance plots of the DI- and KOH-treated MEAs for H2/O2
operation at constant current of −2 A.
42
electronic resistance of the catalyst layer, should be similar for both MEAs, suggesting that the reduction in ohmic resistance is due to the decrease in ionic resistance through the catalyst layer.
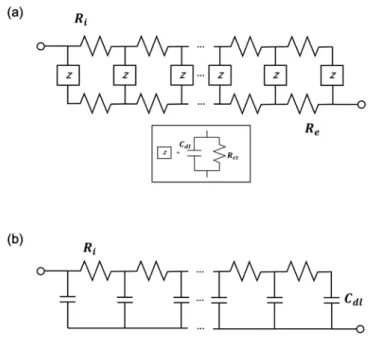
To further demonstrate the improvement in ionic resistance for hydroxide conduction in the cathode catalyst layer, EIS analysis was performed under the non-faradaic condition for the cathode. Although several studies have used EIS analysis to investigate ionic resistance in PEMFCs17, 18, there have been few reports on the EIS-based analysis of ionic resistance in AEMFCs. Generally, equivalent circuit of catalyst layers can be represented by the transmission line model shown in Figure 2.6 (a) 19, 20. The impedance of the catalyst layer is composed of ionic (Ri) and electronic resistances (Re) due to ion conduction through the ionomer networks and electron conduction through the catalyst particles, respectively. The interfacial reaction impedances (Z) at the triple phase boundaries are distributed in the catalyst layers. When inert nitrogen is supplied to the cathode side, the faradaic reactions are removed. Thus, the interfacial reaction impedances can be considered as a simple capacitor. The equivalent circuit of cathode catalyst layer under this experimental condition is shown in Figure 2.6 (b), assuming that the electronic resistance is negligible.
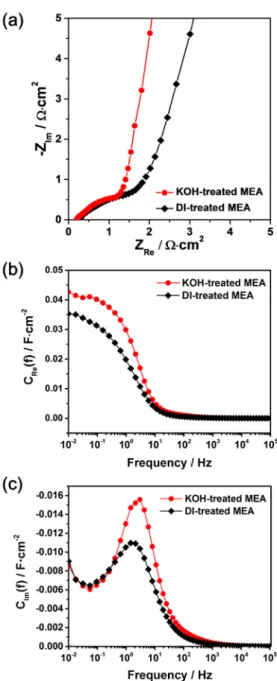
The Nyquist plots of impedance spectra of two MEAs are shown in Figure 2.7 (a), which was measured while hydrogen and nitrogen gases were supplied to the
43
Figure 2.6 Equivalent circuit for the impedance of the catalyst layer of fuel cell under (a) the faradaic condition and (b) non-faradaic condition.
44
anode and cathode, respectively. In the high-frequency range, an arc with the shape of a quarter-circle was observed for both the MEAs, which is due to the hydrogen oxidation reaction (HOR). Since exchange current density of HOR under alkaline condition is not negligible compared to that of oxygen reduction reaction, the impedance of HOR observed for AEMFCs differed from that of PEMFCs. Charge transport resistance for HOR was decreased, as confirmed by the smaller size of quarter-circle of KOH-treated MEA, which is consistent with the results shown in Figure 2.5. The ionomer networks through the catalyst were improved by the KOH treatment, which in turn leads to a decrease in the charge transport resistance. Under the non-faradaic condition of the cathode catalyst layer, interfacial capacitors are distributed with ionic resistance. (Figure 2.7 (b)). In this case, the slope of the Nyquist plot should be changed sharply from 45° to 90°.
However, in here, the slope gradually changed due to non-uniform microstructure of catalyst layer18. A comparison of the impedance of two MEAs (Figure 2.7 (a)) showed that the KOH-treated MEA has the lower ionic resistance. To obtain the quantitative data of ionic resistance, the experimental impedance data (Z(f)) is further converted to complex capacitance (Cc(f)), according to equation (1), where f denotes the AC frequency. Real and imaginary parts of the complex capacitance were plotted as a function of AC frequency. Low-frequency intercept on the real capacitance axis in Figure 2.7 (b) is the total capacitance of the cathode catalyst
45
layer (Cdl). From peak frequency in the imaginary capacitance plot (Figure 2.7 (c)), Ri and Cdl can be calculated using equation (2)19, 20. Based on this relationship, Ri
values of KOH- and DI-treated MEA are calculated to be 3.135 Ω∙cm2 and 7.941 Ω∙cm2, respectively. Thus, ionic resistance in the catalyst layer has declined by about half after the KOH treatment.
Cc (f) = 1/j2πfZc(f) = Cdl/ (j2πRiCdl f)1/2 tanh[(j2πRiCdl f)1/2] (Eq. 1)
fp = 0.404/Ri Cdl
(Eq. 2)
This method was applied to carbon-based NPMC21. Figure 2.8 (a) shows the cell performance of NPMC with a catalyst loading of 2 mg cm−2, which indicates that a higher loading of catalyst layer is required for NPMC when compared to a commercial Pt/C catalyst (0.5 mg cm−2). The maximum power density of an AEMFC with KOH-treated MEA approaches 169 mW cm−2, which is 2.4 times higher than that of the DI-treated MEA (72 mW cm-2). In this case, there is a clear enhancement of performance observed in the intermediate current density region.
The higher performance improvement ratio of MEA with NPMC to PGM catalyst after KOH treatment is due to the increased thickness of NPMC catalyst layer, as observed in Figure 2.8 (b). This clearly suggests that the enhancement of OH−
A = � 𝐼𝐼𝐼𝐼[𝑐𝑐∞ 𝑐𝑐(𝑓𝑓)]𝑑𝑑 log 𝑓𝑓
−∞ = 0.682𝐶𝐶𝑑𝑑𝑑𝑑
46
conductivity of ionomer in the catalyst layer could immensely contribute to the single-cell performance, which in turn is accomplished due to a higher proportion of catalyst layer on MEA.
47
Figure 2.7 (a) Nyquist impedance plots, (b) real part and (c) imaginary part of complex capacitances as a function of log scale frequency of the DI- and KOH-treated MEAs for H2/N2 operation at 0.45 V.
48
Figure 2.8 (a) Polarization (●) and power density (○) curves and (b) FE-SEM cross sectional FE-SEM image of MEA with NPMC.
49
2.3.2 Effect of Catalyst Ink Solvents
In order to confirm the interaction between the ionomer and solvent with distinct dielectric constant, the average ionomer agglomerates size dispersed in solvent was measured by an electrophoretic light scattering (ELS) particle size analyzer (Figure 2.9). The physical properties of these solvents are listed in Table 2.1.
The effect of the solvent on the size of the ionomer agglomerate is remarkable. As dielectric constant increases from 12.5 to 24.6, the average agglomerate size decreases markedly from 160 nm to 20 nm, which is attributed to different interactions with the side chain and back bone of ionomer in solvent22-24. The change in the size of the ionomer agglomerates depending on the solvent can be observed in an optical micrograph of solution (inset images of Figure 2.9). The ionomer dispersed state is not completely identical to the case of when the carbon supported catalyst particles coexist with the ionomer in solution, but the effect of the solvent on the ionomer with different dielectric constants is clearly confirmed. The effect on the type of catalyst dispersion solvent for practical conditions was evaluated using AEMFC single-cell analysis with MEA prepared with solvents having different dielectric constants. Figure 2.10 shows the SEM images of prepared catalyst layers.
The noticeable difference of the pore structure in the catalyst layer is observed in the SEM images. Catalyst layer originated from tert-butanol shows well-developed
50
secondary pore structure with a large size. In contrast, when using ethanol with a high dielectric constant, the catalyst layer presents a fine and dense microstructure.
As the dielectric constant of the solvent decreases, the catalyst agglomerate size increases due to the increase of the ionomer agglomerate size, which remarkably enlarges the size of the secondary pores in the catalyst layers. These results indicates correlation between the ionomer agglomeration and the catalyst layer porous structure.
The performance test results of AEMFCs are shown in Figure 2.11. The MEAs prepared from the solvents with lower dielectric constant exhibited higher performance. The best performance was observed in AEMFC prepared with catalyst dispersed in tert-butanol. The gaps between the polarization curves mainly occur at a current density region where the cell voltage loss is dominated by ohmic and concentration loss11,12. This result is attributed to the large secondary pore sizes, which originate from stronger agglomeration property of ionomer in a tert-butanol solvent, facilitating mass transfer through the catalyst layer. The enhancement of the mass transport is also confirmed by the oxygen gain, calculated by subtracting voltage obtained from oxygen-fed fuel cell to air-fed fuel cell. As seen in Figure 2.11 (c), the AEMFC prepared from tert-butanol solvent showed a much lower oxygen gain compared to one prepared from solvents with higher dielectric constant, indicating that the tert-butanol originated catalyst layer has a more
51
Table 2.1 Physical parameters of various dispersion solvents.
Solvent Boiling point Dielectric constant
tert- Butanol 82.4 12.5
2-Propanol 82.4 18.3
Ethanol 78.5 24.6
52
Figure 2.9 The size distribution of ionomer agglomerates dispersed in the (a) tert- butanol, (b) 2-propanol and (c) ethanol. Inset images are an optical micrograph of ionomer dispersion. (d) Average size of ionomer aggregates in accordance to solvents with different dielectric constants.
53