저작자표시-비영리-변경금지 2.0 대한민국 이용자는 아래의 조건을 따르는 경우에 한하여 자유롭게
l 이 저작물을 복제, 배포, 전송, 전시, 공연 및 방송할 수 있습니다. 다음과 같은 조건을 따라야 합니다:
l 귀하는, 이 저작물의 재이용이나 배포의 경우, 이 저작물에 적용된 이용허락조건 을 명확하게 나타내어야 합니다.
l 저작권자로부터 별도의 허가를 받으면 이러한 조건들은 적용되지 않습니다.
저작권법에 따른 이용자의 권리는 위의 내용에 의하여 영향을 받지 않습니다. 이것은 이용허락규약(Legal Code)을 이해하기 쉽게 요약한 것입니다.
Disclaimer
저작자표시. 귀하는 원저작자를 표시하여야 합니다.
비영리. 귀하는 이 저작물을 영리 목적으로 이용할 수 없습니다.
변경금지. 귀하는 이 저작물을 개작, 변형 또는 가공할 수 없습니다.
이학석사 학위논문
JAK-STAT signaling in breast cancer cell regulates paclitaxel
sensitivity by tumor micro- environment interactions
유방암 세포에서 JAK-STAT signaling에 의한 종양 미세환경의 조절 및 paclitaxel의 감수성에 관한 연구
2020년 2월
서울대학교 대학원 협동과정 종양생물학 전공
한 종 민
JAK-STAT signaling in breast cancer cell regulates paclitaxel
sensitivity by tumor micro- environment interactions
유방암 세포에서 JAK-STAT signaling에 의한 종양 미세환경의 조절 및 paclitaxel의 감수성에 관한 연구.
February 2020
Seoul National University Cancer Biology
Jong-Min Han
i
Abstract
JAK-STAT signaling in breast cancer cell
regulates paclitaxel sensitivity by tumor micro- environment interactions
Jong-Min Han Cancer Biology The Graduate School Seoul National University
Breast cancer is consistently the cancer type that makes up the highest proportion of cancers in women worldwide. Triple negative breast cancer (TNBC) is the most malignant and difficult to treat. Although most hormone therapies target one of three receptors in other breast cancer subtypes, TNBC does not have any targeting molecule. Therefore, triple negative breast cancers (TNBCs) often require chemotherapy. Paclitaxel is a well-known chemotherapeutic agent for breast cancer, but patients often
ii
acquire resistance to paclitaxel during chemotherapy. To understand the mechanism of paclitaxel resistance that occurs in TNBC tumors, response to paclitaxel experiment was performed using seven xenograft models derived from patients with TNBC in-vivo . For each TNBC PDX model, 10 mice were intraperitoneally injected with either PBS (Vehicle) or paclitaxel (15 mg/kg) for 4 weeks. Of the seven PDX models, the four that did not experience a reduction in tumor size by paclitaxel were designated as the paclitaxel-resistant group. The three PDX models whose tumor sizes were significantly reduced by paclitaxel were designated as the paclitaxel- sensitive group. Then, transcriptome sequencing data from both groups were analyzed. JAK-STAT pathway-related genes were identified among the many genes with increased expression levels in the paclitaxel-resistant group compared to the paclitaxel-sensitive group. Therefore, the correlation between the upregulation of the JAK-STAT pathway and paclitaxel resistance was the focus of this study. It was further observed that paclitaxel and ruxolitinib (JAK1/JAK2 inhibitor) combination treatment in five TNBC cell lines has a synergistic effect on anti-cancer activity. When JAK2 gene knockdown by JAK2 siRNA occurred in four TNBC cell lines in
iii
vitro, JAK2 inhibition TNBC cell lines were found to be more sensitive to paclitaxel. Additionally, the paclitaxel-resistant tumors upregulated the cell cycle-related genes in the tumor microenvironments. Therefore, tumor microenvironments, such as fibroblasts and endothelial cells, were found to have upregulated proliferation in the tumors of mice in the paclitaxel- resistant group. And it was confirmed that proliferation decreased in fibroblasts incubated in CM extracted from JAK2-inhibited TNBC cell lines.
The results of this study demonstrate that paclitaxel resistance in TNBC is correlated with various genomic changes and the upregulation of the JAK- STAT pathway. Further studies are essential to clarify the mechanistic pathways of the JAK-STAT pathway correlated with paclitaxel resistance.
Key words: Paclitaxel, ruxolitinib, resistance, JAK-STAT pathway, TNBC.
Student Number: 2018 – 27894
iv
Contents
Abstract --- i
Contents ---ⅳ List of Tables & Figures ---ⅴ List of Tables ---ⅴ List of Figures --- ⅵ I. Introduction --- 1
II. Materials and Methods --- 4
III. Results --- 11
IV. Discussion --- 57
V. References --- 63
Abstract – Korean --- 78
v
List of Tables
Table 1. Upregulation of the pathways in paclitaxel-resistant tumors compared to paclitaxel-sensitive tumors based on DEG data.
Table 2. IC50 of the paclitaxel- or ruxolitinib- only treated in five TNBC cell lines
Table 3. IC50 of the paclitaxel-only, ruxolitinib-only and the paclitaxel and ruxolitinib combined treatments in five TNBC cell lines
Table 4. IC50 of Paclitaxel in silencing of siCONTROL (NTC) and siJAK2 (JAK2i) in four TNBC cell lines.
Table 5. Upregulated cell cycle-related genes in tumor microenvironment of paclitaxel-resistant group.
vi
List of Figures
Figure 1. Response to paclitaxel in seven TNBC PDX models in-vivo. Figure 2. Changes in JAK-STAT signaling pathway-related gene expression in paclitaxel-resistant groups in transcriptome analysis.
Figure 3. The protein expression levels associated with the JAK-STAT pathway are upregulated in tumors of the paclitaxel-resistant group.
Figure 4. The activity of JAK2 is increased in paclitaxel resistance tumors
Figure 5. Tendency of mRNA and protein expression levels of JAK2, STAT3 and STAT5 in 11 breast cancer cell lines.
Figure 6. The effect of paclitaxel or ruxolitinib cell proliferation in five TNBC cell lines in-vitro.
Figure 7. Synergistic effect of paclitaxel and ruxolitinib combination treatment in five TNBC cell lines in-vitro.
Figure 8. Ruxolitinib effectively inhibits the JAK-STAT pathway in four TNBC cell lines in-vitro.
Figure 9. Response to paclitaxel improved JAK2i TNBC cell lines in-vitro.
vii
Figure 10. Upregulated proliferation of endothelial cells and fibroblasts in tumors of paclitaxel-resistant group.
Figure 11. Decreased proliferation of fibroblasts incubated in conditioned media extracted from JAK2 inhibited TNBC cell lines
1
Introduction
Breast cancer is the most common cancer among the woman, and the incidence of breast cancer is steadily rising in Korea. [1] Breast cancer is commonly divided into four subtypes; luminal A, luminal B, HER2 positive, and TNBC. Unlike other subtypes of breast cancer, TNBC is characterized by the absence of ER, PR and HER2.[2] TNBC is the most malignant and difficult to treat breast cancer subtype as most hormone therapies target one of the three receptors, while TNBC does not have a target molecule for treatment. Therefore, TNBCs often require chemotherapy. [3] Although TNBCs account for approximately 15-20% of breast cancers, the recurrence and fatality rates of this subtype are significantly worse than those of others.[4]
Paclitaxel is used to treat various types of solid tumors, including ovarian, breast, lung, and prostate cancers.[5] The best known anti-cancer mechanism of paclitaxel is by targeting of the microtubule.[6] In addition, stabilization of the microtubules and consequently, cell cycle arrest occur in G2-M phase. Paclitaxel also induces multi-polar spindle in cancer cells that
2
are associated with apoptotic effect. [5, 7, 8] Although, paclitaxel has been shown to be successful in preclinical and clinical studies, the intrinsic or acquired paclitaxel resistance remains a challenge in cancer treatment. [9- 12]
The JAK /STAT signaling pathway is activated by various cytokines, interferons, growth factors and regulates many genes involved in cell proliferation, survival, differentiation. [13-15] The JAK/STAT signaling pathway is upregulated in many cancers to promote tumor growth and progression. In particular, both STAT3 and STAT5 promote breast cancer growth and progression. Therefore, the JAK/STAT pathway is currently being considered a potential therapeutic target for breast cancer. [16-23]
Ruxolitinib (Jakavi) is selective JAK1 and JAK2 inhibitor that was FDA-approved in November 2011 for the treatment of myelofibrosis, a type of myeloproliferative disorder that occurs in bone marrow. [24-27] The therapeutic effect of ruxolitinib has recently been evaluated clinically in ovarian, metastatic breast, and pancreatic cancers. [27-29]
In this study, four TNBC PDX models were identified that are relatively paclitaxel-resistant, and three that are paclitaxel-sensitive.
3
Therefore, TNBC PDX models that showed paclitaxel resistance or sensitivity were analyzed via RNA sequencing. The mRNA expressions of these samples upregulated the mRNA expression of the JAK-STAT pathway-related genes in tumors showing paclitaxel resistance. Therefore, it was assumed that the paclitaxel resistance was related to upregulation of the JAK-STAT pathway activity. In-vitro and in-vivo studies were performed to investigate the relationship between paclitaxel resistance and the JAK-STAT signaling pathway in TNBC.
4
Materials and methods
1. cDNA synthesis and qPCR
RNA was extracted from cells, that were then washed once with 1x PBS and prolonged by TRIzol (Favorgen, Taiwan). Prime Script 1st strand cDNA Synthesis Kit (Takara, Japan) was used for reverse transcription of RNA, and qPCR was carried out using Power SYBR Green PCR Master mix (Applied Biosystems). Reactions were performed using a real-time PCR System (ABI7500) and the results were analyzed with the comparative Ct to establish the relative expression curves. The sequence of the primer used for JAK2 was forward 5’-TCACCAACATTACAGAGGCCTACTC-3’ and reverse 5’-GCCAAGGCTTTCATTAAATATCAAA-3’. The sequence of the primer used for STAT3 was forward 5’-GGCCCCTCGTCATCAAGA- 3’ and reverse 5’-TTTGACCAGCAACCTGACTTTAGT-3’. The sequence of the primer used for STAT5 was forward 5’-
GTCACGCAGGACACAGAGAA-3’ and reverse 5’-
CCTCCAGAGACACCTGCTTC-3’.
5
2. Western blotting
Proteins were harvested with RIPA buffer (Thermo scientific, Palm Springs, CA, USA), protease and phosphatase inhibitor, and 0.5M EDTA solution. Protein concentrations were measured using BCA assay kit (Thermo scientific, Palm Springs, CA, USA). Cell lysates containing 20ug of protein were loaded onto 10% gels and transferred to a PVDF membrane.
The membrane was blocked with 5% BSA solution and incubated with primary antibody overnight at 4'C. The second antibody was diluted 1:5000 in 5% skim milk. Bands were detected by LAS.
3. MTT cell viability assay
BT20, HCC38, HCC70, MDA-MB231, and MDA-MB468 cells were seeded into 96-well plates at a density of 3,000 cells per well. After overnight incubation, the attached cells were treated with various concentrations of paclitaxel, ruxolitinib, or a mixture of the two for 72h. The cells were incubated with MTT solution (5 mg/ml, 20μl/well) for 3h at 37°C.
The medium was removed and 200μl DMSO was added to each well to
6
dissolve the formazan crystals in the viable cells. The optical density was determined at a wavelength of 570 nm using a spectaMAX190.
4. Immunohistochemistry (IHC)
IHC was performed with an IHC staining kit (Dako, CA, USA).
Tissue sections were deparaffinized in xylene substrate, hydrated in phosphate buffered saline (PBS), and blocked with normal goat serum (AAR-6591-02, Immuno bioscience). Slides were incubated with primary antibody (1:1000 or 1:2000) at 4°C overnight. The next day, the tissue sections were incubated with biotinylated anti-rabbit/mouse antibody, followed by exposure to preformed avidin/biotinylated peroxidase solution.
Sections were then developed with diaminobenzidine and hydrogen peroxide, which produces a brown precipitate. Sections were counterstained with hematoxylin, dehydrated, and mounted.
7
5. Cell culture
In this study, 11 breast cancer cell lines were used. The MCF-7, MDA-MB231, MDA-MB468, and HS578T cell lines were cultured in Dulbecco’s modified Eagle’s (DMEM) medium supplemented with 10% FBS and 1% penicillin/streptomycin at 37°C under a humidified atmosphere of 5%
CO2. The ZR-75-1, SKBR3, BT474, MDA-MB453, BT20, HCC38, and HCC70 cell lines were cultured in RPMI 1640 with 10% FBS and 1%
penicillin/streptomycin at 37°C under a humidified atmosphere of 5% CO2.
All cell lines were sub-cultured every three to four days.
6. Transient transfection of JAK2 siRNA
Four human breast cancer cell lines (BT20, HCC38, MDAMB231, and MDA-MB468) were used in this study. Commercial JAK2 siRNA was obtained from Dharmacon Inc. and used to target human JAK2 (Gene ID:3717). Cells were transfected with siRNA (10nM) using the ON- TARGETplus Human JAK2 siRNA-SMARTpool siRNA transfection reagent, according to the manufacturer’s instructions. Nonspecific siRNA
8
(Dharmacon Inc.) was used as a negative control, and the selective silencing of JAK2 was confirmed by western blot analysis.
7. Antibodies
The following antibodies were used: β-actin (sc-47778) from Santa Cruz; JAK2 (3230s), STAT3 (4904s), and STAT5 (9363s) from Cell Signaling; pJAK2 (ab219728), pSTAT3 (ab76315), pSTAT5 (ab32364), and KI-67 (ab15580) from Abcam.
8. In-vivo TNBC patients derived xenograft experiments
In-vivo, a paclitaxel response test was performed on a patient- derived xenograft model. Seven TNBC PDX models were established separately. For each model, vehicle (n = 5) and paclitaxel (n = 5) mice were intraperitoneally (IP) injected with either PBS or paclitaxel (15 mg/kg) for 4 weeks. After the experiment, four of the PDX models were found to have less response to paclitaxel compared to the other three models, and were designated as the paclitaxel non-responding group. Meanwhile, the three models that were more sensitive to paclitaxel were designated as the
9
paclitaxel responsive group. Transcriptome and exosome sequencing data were analyzed from the remaining TNBC PDX tumors.
9. Whole transcriptome sequencing and expression analysis
RNA sequencing libraries were prepared using a Truseq RNA kit, and sequenced on an Illumina HiSeq platform. STAR aligner [30] was used to align the sequence reads to the combined genome of the GRCh37/b37 human reference genome and mm10 mouse reference genome. We used htseq-count in the HTseq [31] package to obtain the number of reads for each gene. The read counts of the genes were converted to FPKM (Fragments Per Kilobase of transcript per Million read mapped) using the rpkm function from edgeR. [32]
A differential gene expression analysis was performed with DESeq2.
[33] Genes with low read counts across all samples were excluded. Among the differentially expressed genes (DEGs) from the differential gene expression analysis, only genes with mean FPKM ≥ 1, adjusted P value <
0.05, and log2 FC(fold-change) ≥ 1 were retained. The DAVID (Database
10
for Annotation, Visualization, and Integrated Discovery) [34] functional annotation tool was used to identify significantly enriched pathways in the list of filtered DEGs. Hierarchical clustering was performed using cluster 3.0 [35] (log transformed FPKM, mean-centered, uncentered correlation, average linkage) and visualized using JAVA TreeView . [36]
10. Statistics
GraphPad prism 8 software (GraphPad Prism, USA) was used to carry out statistical analyses. For comparing means between two groups, a two-tailed Mann-Whitney t-test and multiple t-test were used (*: p < 0.05,
**: p < 0.01, ***: p < 0.005,) (GraphPad Prism v. 8.02 software for Windows).
11
Results
Establishment of TNBC PDX models with paclitaxel resistance.
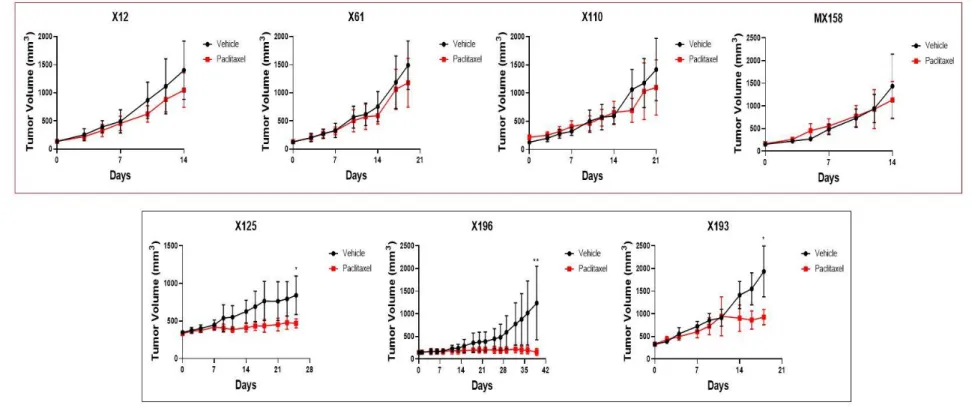
To understand what molecules affect cancer cells when paclitaxel resistance develops in triple negative cancer, in-vivo paclitaxel experiments were performed utilizing seven PDX models. Paclitaxel was administered for 4 weeks to seven PDX models of TNBC-derived tissues from passages 0 to 2. Then, the response to paclitaxel was confirmed in seven TNBC PDX tumors. In the four TNBC PDX models, X12, X61, X110, and MX158, there were no differences in tumor size reduction of the paclitaxel-treated tumors compared to the vehicle-treated tumors. However, the three TNBC PDX models of X125, X196, and X193 showed significant decreases in tumor size in paclitaxel-treated tumors compared to vehicle-treated tumors (Figure 1). Therefore, the four TNBC PDX models that did not experience a reduced tumor size because of paclitaxel were designated as the paclitaxel-resistant group, and the three PDX models whose tumor sizes were significantly reduced by paclitaxel were called the paclitaxel-sensitive group.
12
Figure 1. Response to paclitaxel in seven TNBC PDX models in-vivo. Seven PDX models were established from a single patient’s primary or recurrent tumor. X110 is a recurred case of X61. The four TNBC PDX models (red boxed) that did not experience a
13
reduction in tumor size due to paclitaxel were designated as the paclitaxel-resistant group, and the three PDX models (black boxed) whose tumor sizes were significantly reduced by paclitaxel were called the paclitaxel-sensitive group. Data were expressed as mean ± standard deviation (SD). * p ≤ 0.05; ** p ≤ 0.01 (Mann-Whitney t-tes
14
The expression of JAK-STAT related genes is upregulated in paclitaxel resistance group.
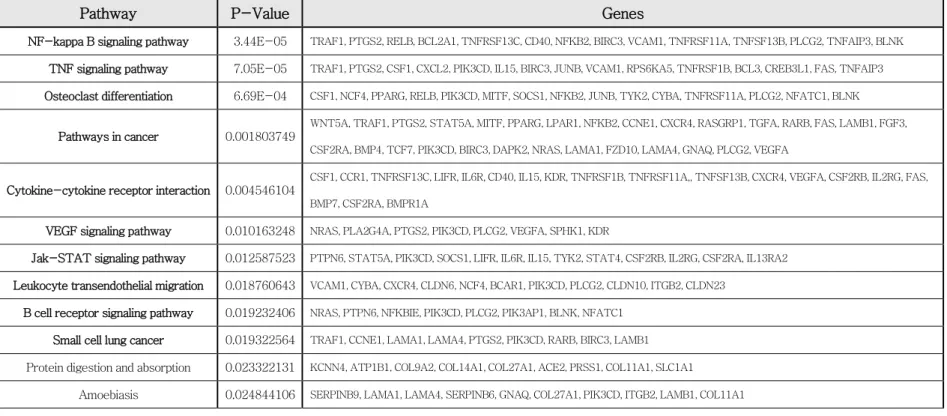
Three out of five tumors were selected for each control and the paclitaxel group, and the transcriptome data were then obtained. Then, various genes showing differences in gene expression between the paclitaxel-resistant and -sensitive groups were analyzed. Transcriptome data showed differentially expressed genes (DEGs) between the paclitaxel- sensitive and resistant groups (Figure 2A). JAK-STAT pathway-related genes were upregulated in the paclitaxel-resistant group, but downregulated in the paclitaxel-sensitive group among the various genes showing differences in gene expression (genes with mean FPKM ≥ 1, adjusted P value < 0.05, and log2 FC (foldchange) ≥ 0.8) between the paclitaxel-resistant and -sensitive groups (Figure 2B and Table 1).
Surprisingly, the JAK-STAT pathway ranked fifth, following the pathways for NF-kappa B, TNF, cancer, and osteoclast differentiation in the paclitaxel-resistant compared to the -sensitive group. In particular, when five representative genes in the JAK-STAT pathway-related genes were analyzed between the paclitaxel-sensitive and -resistant groups using
15
FPKM values, the expression levels of JAK1, JAK2, and STAT5A were found to be significantly increased in the paclitaxel resistant group. However, STAT3 and STAT5b showed no difference between the paclitaxel- sensitive and -resistant groups (Figure 2C). Therefore, we hypothesized that resistance to paclitaxel may be associated with an upregulation of the JAK-STAT signaling pathway.
16
17
Figure 2. Changes in JAK-STAT signaling pathway-related gene expression in paclitaxel-resistant groups in transcriptome analysis. (A) Volcano plot showing DEGs between the paclitaxel-sensitive and -resistant groups. The standard is a log2FC (fold- change) value of 1.0. Red points indicate genes upregulated in the paclitaxel-resistant group. Blue points represent genes upregulated in the paclitaxel-sensitive group. (B) The top ten pathways significantly enriched in the paclitaxel-resistant group using the list of filtered DEGs. (C) Differences in the expression of representative genes among the JAK-STAT pathway-related genes between the paclitaxel-sensitive and -resistant groups. JAK1, JAK2, and STAT5A, but not STAT5b or STAT3, were significantly upregulated in the paclitaxel-resistant group. **** p ≤ 0.0001 (Mann-Whitney t-test).
18
Table 1. Upregulation of the pathways in paclitaxel-resistant tumors in comparison with those in paclitaxel-sensitive tumors based on DEG data.
Pathway P-Value Genes
NF-kappa B signaling pathway 3.44E-05 TRAF1, PTGS2, RELB, BCL2A1, TNFRSF13C, CD40, NFKB2, BIRC3, VCAM1, TNFRSF11A, TNFSF13B, PLCG2, TNFAIP3, BLNK TNF signaling pathway 7.05E-05 TRAF1, PTGS2, CSF1, CXCL2, PIK3CD, IL15, BIRC3, JUNB, VCAM1, RPS6KA5, TNFRSF1B, BCL3, CREB3L1, FAS, TNFAIP3 Osteoclast differentiation 6.69E-04 CSF1, NCF4, PPARG, RELB, PIK3CD, MITF, SOCS1, NFKB2, JUNB, TYK2, CYBA, TNFRSF11A, PLCG2, NFATC1, BLNK
Pathways in cancer 0.001803749
WNT5A, TRAF1, PTGS2, STAT5A, MITF, PPARG, LPAR1, NFKB2, CCNE1, CXCR4, RASGRP1, TGFA, RARB, FAS, LAMB1, FGF3, CSF2RA, BMP4, TCF7, PIK3CD, BIRC3, DAPK2, NRAS, LAMA1, FZD10, LAMA4, GNAQ, PLCG2, VEGFA
Cytokine-cytokine receptor interaction 0.004546104
CSF1, CCR1, TNFRSF13C, LIFR, IL6R, CD40, IL15, KDR, TNFRSF1B, TNFRSF11A,, TNFSF13B, CXCR4, VEGFA, CSF2RB, IL2RG, FAS, BMP7, CSF2RA, BMPR1A
VEGF signaling pathway 0.010163248 NRAS, PLA2G4A, PTGS2, PIK3CD, PLCG2, VEGFA, SPHK1, KDR
Jak-STAT signaling pathway 0.012587523 PTPN6, STAT5A, PIK3CD, SOCS1, LIFR, IL6R, IL15, TYK2, STAT4, CSF2RB, IL2RG, CSF2RA, IL13RA2 Leukocyte transendothelial migration 0.018760643 VCAM1, CYBA, CXCR4, CLDN6, NCF4, BCAR1, PIK3CD, PLCG2, CLDN10, ITGB2, CLDN23
B cell receptor signaling pathway 0.019232406 NRAS, PTPN6, NFKBIE, PIK3CD, PLCG2, PIK3AP1, BLNK, NFATC1 Small cell lung cancer 0.019322564 TRAF1, CCNE1, LAMA1, LAMA4, PTGS2, PIK3CD, RARB, BIRC3, LAMB1 Protein digestion and absorption 0.023322131 KCNN4, ATP1B1, COL9A2, COL14A1, COL27A1, ACE2, PRSS1, COL11A1, SLC1A1
Amoebiasis 0.024844106 SERPINB9, LAMA1, LAMA4, SERPINB6, GNAQ, COL27A1, PIK3CD, ITGB2, LAMB1, COL11A1
19
Hepatitis B 0.029399943 CCNE1, NRAS, IKBKE, EGR3, STAT4, IFIH1, STAT5A, PIK3CD, CREB3L1, FAS, CCNA1, NFATC1 Other types of O-glycan biosynthesis 0.033158656 ST6GAL2, FUT7, GXYLT2, FUT4, GXYLT1
20
Protein expression levels associated with the JAK-STAT pathway are upregulated in tumors of the paclitaxel- resistant group.
The transcriptome investigations confirmed whether the increase of JAK-STAT pathway-related genes was upregulated by the protein expression levels. Therefore, the JAK-STAT pathway-related protein expression levels were analyzed by western blotting between paclitaxel- resistant and -sensitive TNBC PDX tumors (Figure 3A). One vehicle- or paclitaxel-treated individual was selected from each of the seven TNBC PDX models, and the proteins were extracted from the tumor to compare JAK2, STAT3, and STAT5 protein expression levels. Consequently, the protein expression levels of total JAK2, STAT3, and STAT5 were increased in the paclitaxel-resistant group compared to the paclitaxel- sensitive group. Differences in the protein expression levels of total STAT3 and STAT5 were statistically significant (Figure 3B).
In addition, there was no difference in the protein expression levels of JAK2, STAT3, and STAT5 between the paclitaxel-sensitive and - resistance tumors when treated with vehicle (Figure 3C). However, the
21
protein expression levels of JAK2, STAT3, and STAT5 were upregulated in the paclitaxel-resistant compared to the paclitaxel-sensitive tumors when treated with paclitaxel (Figure 3D). These results suggest that paclitaxel increased the expression levels of proteins related to the JAK- STAT pathway in the paclitaxel-resistant group and, therefore, the JAK- STAT pathway is found to be related to paclitaxel resistance in TNBC.
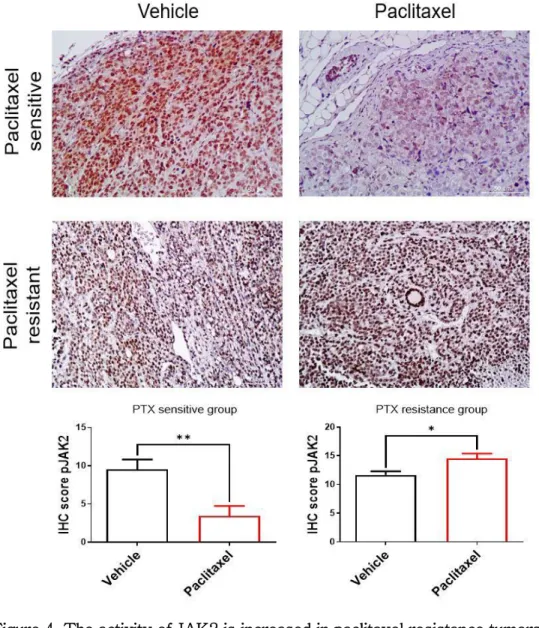
In addition, to determine whether the JAK-STAT pathway was activated, the protein expression levels of pJAK2 were analyzed through IHC staining (Figure 4). when IHC was conducted, the protein expression levels of pJAK2 declined in paclitaxel-sensitive TNBC tumors, but was upregulated in paclitaxel-resistant TNBC tumors. Consequently, it was confirmed that paclitaxel resistance is related to the activation of the JAK- STAT signaling pathway in TNBC.
22
23
Figure 3. The protein expression levels associated with the JAK-STAT pathway are upregulated in tumors of the paclitaxel-resistant group.
Comparison of the protein expression levels of JAK2, STAT3, and STAT5 in the paclitaxel-resistant and -sensitive groups based on transcriptome data. (A) Western blot analysis data. (B-D) Comparative analysis of the protein expression levels of JAK2, STAT3, and STAT5 between the paclitaxel-sensitive and -resistant groups by quantification of Western blot data. Data were expressed as mean ± standard deviation (SD). Each experiment was performed in triplicate. * p ≤ 0.05; ** p ≤ 0.01; *** p ≤ 0.001;
**** p ≤ 0.0001 (Mann-Whitney t-test). Quantification was performed using ImageJ software.
24
Figure 4. The activity of JAK2 is increased in paclitaxel resistance tumors.
Paraffin-embedded tissue microarray sections were formed through immunohistochemistry with anti-pJAK2 Ab. Representative photomicrographs of paclitaxel-sensitive or -resistant tumor tissue groups treated with vehicle or paclitaxel. Graphs represent quantification
25
immunostaining of pJAK2. * p ≤ 0.05; ** p ≤ 0.01 (Mann-Whitney t-test).
Quantitative analysis was performed by IHC scoring by multiplying the stained area by the intensity.
26
Expression of JAK2, STAT3 and STAT5 in breast cancer cell lines
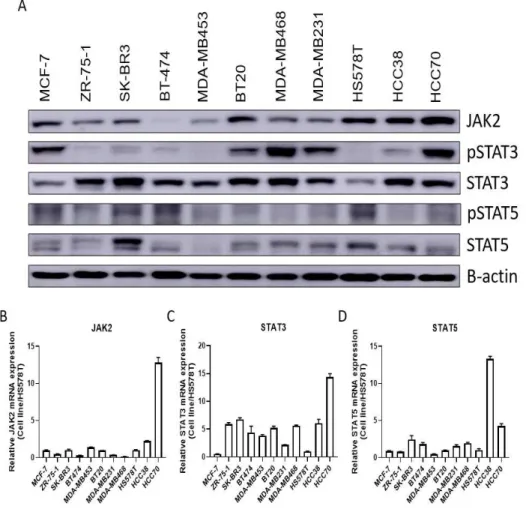
To investigate the mechanism of paclitaxel resistance by the upregulation of the JAK-STAT pathway, the JAK2, STAT3, and STAT5 genes and protein expression levels were analyzed via their mRNA and protein expression levels in 11 breast cancer cell lines. (MCF-7, ZR-75- 1, SK-BR3, BT474, MDA-MB453, BT20, MDAMB231, MDA-MB468, HS578T, HCC38, and HCC70). The activation of the JAK-STAT pathway was confirmed by the expression levels of their activation forms, pSTAT3 and pSTAT5, by Western blotting. As a result, the gene (Figure 6B-6D) and protein (Figure 6A) expression levels of JAK2, STAT3, and STAT5 in each of the 11 breast cancer cell lines were varied. Based on qPCR and Western blot analyses, BT20, MDA-MB231, MDA-MB468, HCC38, and HCC70 TNBC cell lines, which were more expressed in either mRNA or protein levels than HS578T cells, were selected for further study.
27
Figure 5. Tendency of mRNA and protein expression levels of JAK2, STAT3 and STAT5 in 11 breast cancer cell lines. (A) Using the 11 breast cancer cell lines, the protein expression levels of JAK2, STAT3, and STAT5, and their activation forms pSTAT3 and pSTAT5 were confirmed by Western blot (B-D). The gene expression levels of JAK2, STAT3, and STAT5 in 11 breast cancer cell lines were confirmed by qPCR. The gene expression levels of JAK2, STAT3, and STAT5 were normalized based on
28
the values of HS578T cells with the lowest gene expression levels ∆Ct among the 11 breast cancer cell lines. Each experiment was performed in triplicate.
29
Mono-drug effects of paclitaxel and ruxolitinib on TNBC cell lines
The IC50 for each drug was measured to determine which concentrations of paclitaxel and ruxolitinib effectively inhibited cell proliferation in the selected five TNBC cell lines. Therefore, after treatment with paclitaxel or ruxolitinib from 0 to 1000nM for 72 h in five TNBC cell lines, cell viability was measured via an MTT assay. As a result, paclitaxel and ruxolitinib inhibited cell proliferation in a dose-dependent manner, although ruxolitinib effectively inhibited cell proliferation at higher concentrations than paclitaxel (Figure 7A and 7B). In detail, the paclitaxel IC50 values were: BT20, 5.5nM; HCC38, 11.0nM; HCC70, 7.2nM;
MDAMB231, 12.2nM; MDA-MB468, 4.4nM. For ruxolitinib, the IC50 values were: BT20, 329.4nM; HCC38, 812.8nM; HCC70, 130.9nM; MDA-MB231, 412.0nM; MDA-MB468, 390.9nM (Table 2).
30
Table 2. IC50 of the paclitaxel or ruxolitinib only treated in five TNBC cell lines
Cancer cell lines Drug IC50 (nM)
BT20
Paclitaxel 5.5
Ruxolitinib 329.4
HCC38
Paclitaxel 11.0
Ruxolitinib 812.8
HCC70
Paclitaxel 7.2
Ruxolitinib 130.9
MDA-MB231
Paclitaxel 12.2
Ruxolitinib 412.0
MDA-MB468
Paclitaxel 4.4
Ruxolitinib 390.9
31
32
33
Figure 6. The effect of paclitaxel or ruxolitinib cell proliferation on five TNBC cell lines in-vitro. In five TNBC cell lines, the effective concentration of the inhibition of cell proliferation when treated with paclitaxel or ruxolitinib.
Each cell line’s IC50 was measured via MTT assay. (A) Cell viability when treated with paclitaxel in five TNBC cell lines. (B) Cell viability when treated with ruxolitinib in five TNBC cell lines. Each experiment was performed in triplicate.
34
Ruxolitinib (JAKAVI) synergistic effect with paclitaxel in five TNBC cell lines.
Based on previous results, it was inferred that resistance to paclitaxel was associated with the upregulated JAK-STAT pathway.
Therefore, the recovery of paclitaxel sensitivity when combined with ruxolitinib, a representative JAK1 and JAK2 inhibitor, in five TNBC cell lines was investigated. Ruxolitinib (JAKAVI) is a drug that is approved by the US FDA and is widely used to treat V617F leukemia [24-27]. In short, Ruxolitinib acts as an insulator as a JAK1 and JAK2 inhibitor, blocking signaling cascade by inhibiting the phosphorylation of JAK1 and JAK2 located in the cytoplasm cytokine or growth factor receptors. [37]
The IC50 of the paclitaxel- and ruxolitinib-only treatments, and the paclitaxel and ruxolitinib combination treatment in five TNBC cell lines were investigated. Each treatment was administered for 72h, then a cell viability assay was performed via an MTT assay. The synergy effects on two drugs were measured by referring to previous studies. [38, 39] The drug interaction score (FIC) for each combination was calculated by dividing the observed IC50 with the expected IC50. In short, the average IC50 value of
35
each drug is the expected IC50 and actually experimented the IC50 value of combination drugs is the expected IC50. FIC values are 1 for Loewe- additive pairs, and lower or higher than 1 for synergistic or antagonistic pairs.
[38] As a result, all five TNBC cell lines showed a synergy effect when ruxolitinib and paclitaxel were treated simultaneously (Figure 7).
Consequently, the blocking of the JAK-STAT pathway by ruxolitinib was affect to paclitaxel sensitivity.
36
Table 3. IC50 of the paclitaxel- and ruxolitinib-only treatments and the paclitaxel and ruxolitinib combination treatment in five TNBC cell lines
Cancer cell lines Drug IC50 (nM)
BT20
Paclitaxel 7.21
Combination 18.36
Ruxolitinib 220.90
HCC38
Paclitaxel 18.08
Combination 12.91
Ruxolitinib 190.7
HCC70
Paclitaxel 8.60
Combination 11.00
Ruxolitinib 37.62
MDA-MB231
Paclitaxel 11.95
Combination 47.63
Ruxolitinib 258.7
37
Cancer cell lines Drug IC50 (nM)
MDA-MB468
Paclitaxel 40.55
Combination 12.02
Ruxolitinib 203.90
38
Figure 7. Synergistic effect of the paclitaxel and ruxolitinib combination treatment on five TNBC cell lines in-vitro. In five TNBC cell lines, a
39
synergistic effect occurred when paclitaxel and ruxolitinib were simultaneously administered. In detail, the FIC2 values were: BT20, 0.161;
HCC38, 0.124; HCC70, 0.476; MDA-MB231, 0.352; and MDA-MB468, 0.098. Each experiment was performed in triplicate.
40
Ruxolitinib effectively inhibits JAK-STAT pathway in four TNBC cell lines
Whether ruxolitinib inhibited the JAK-STAT signaling pathway effectively in the TNBC cell lines was analyzed. Ruxolitinib was treated with increasing concentration from 0 to 1000nM for 24h, then proteins were extracted from four TNBC cell lines. The protein expression levels of JAK2, STAT3, and STAT5, as well as their active forms pJAK2, pSTAT3, and pSTAT5, were analyzed by Western blotting. Although slightly different for each cell line, the protein expressions of total JAK2, STAT3, and STAT5 decreased in all TNBC cell lines depending on the concentration of ruxolitinib (Figure 8). In addition, the expression levels of these active forms, pJAK2, pSTAT3, and pSTAT5, were also reduced depending on the concentration of ruxolitinib. Therefore, ruxolitinib effectively inhibited activation of the JAK-STAT signaling pathways.
41
42
Figure 8. Ruxolitinib effectively inhibits the JAK-STAT pathway in four TNBC cell lines in-vitro. Ruxolitinib was administered at increasing concentrations from 0 to 1000nM for 24h in four TNBC cell lines. The activation of JAK2, STAT3, and STAT5 decreased in a concentration-dependent manner with the concentrations of ruxolitinib in four TNBC cell lines. these data were analyzed with three repeats.
43
Inhibition of JAK2 is associated with improved response to paclitaxel.
A synergistic effect was observed when ruxolitinib and paclitaxel were administered simultaneously. In addition, to determine whether the recovery of paclitaxel sensitivity by paclitaxel and ruxolitinib combination treatment is due to the inhibition of JAK2 in TNBC cell lines. The IC50 of paclitaxel was analyzed in four TNBC cell lines after the inactivation of JAK2 using JAK2 siRNA. The inhibition of JAK2 by JAK2 siRNA was confirmed by Western blot (Figure 9A), and IC50 measurements were then performed.
When paclitaxel was administered for 72h and compared with NTC, three TNBC cell lines (BT20, HCC38, and MDA-MB231) knocked down JAK2, except the MDA-MB468 cell line, showing dramatically reduced IC50 for paclitaxel (Figure 9B and Table 3). Therefore, it was confirmed that the JAK2 signaling pathway affects sensitivity to paclitaxel.
44
45
Figure 9. Response to paclitaxel improved JAK2i TNBC cell lines in-vitro. Paclitaxel inhibited four TNBC cell lines’ survival in a dose-dependent manner. Control and JAK2 transfection of four TNBC cells were treated with paclitaxel for 72 h. IC50 was measured using MTT arrays, and data were expressed as mean ± standard deviation (SD). Each experiment was performed in triplicate. * p ≤ 0.05; ** p ≤ 0.01; *** p ≤ 0.001; **** p ≤ 0.0001 (multiple t-test).
46
Table 4. IC50 of Paclitaxel in silencing siCONTROL (NTC) and siJAK2 (JAK2i) in four TNBC cell lines.
Cancer cell lines Drug IC50 (nM)
BT20 (NTC) Paclitaxel 22.62
BT20 (JAK2i) Paclitaxel 8.01
HCC38 (NTC) Paclitaxel 12.17
HCC38 (JAK2i) Paclitaxel 1.579
MDA-MB231 (NTC) Paclitaxel 21.31
MDA-MB231 (JAK2i) Paclitaxel 6.71
MDA-MB468 (NTC) Paclitaxel 20.94
MDA-MB468 (JAK2i) Paclitaxel 35.43
47
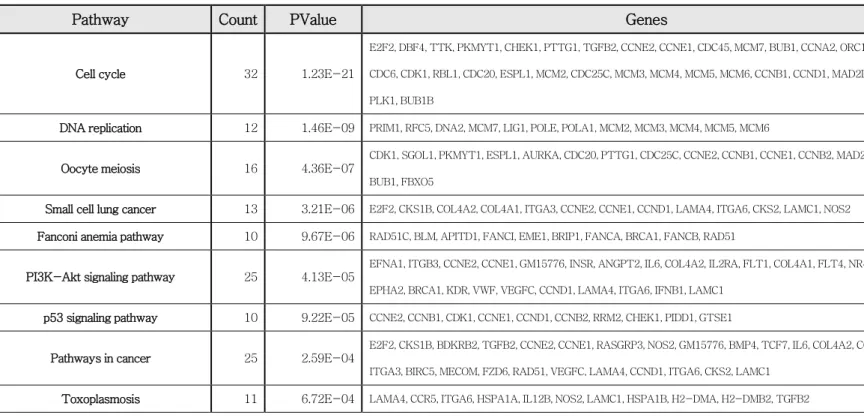
Upregulated cell cycle-related genes in the micro- environment in paclitaxel resistance tumors.
The JAK-STAT signaling pathway activity affects not only the tumors but also their microenvironments. Previous studies have shown that cancer-associated fibroblasts (CAFs) promote cancer stem cell renewal and stem cell proliferation capacity through high levels of IL-6 and CCL2 upon STAT3 activation [40] and cancer-associated adipocytes promoted radiation therapy resistance via the upregulation of IL-6 expression in breast cancer [41]. Therefore, we analyzed the expression changes of mouse genes between the paclitaxel-resistance and -sensitive group in transcriptome data.
By utilizing DAVID Functional Annotation Bioinformatics Microarray Analysis (https://david.ncifcrf.gov/), the pathways that were activated using the gene set of mice with increased expression in the paclitaxel-resistant group were analyzed. As a result, it was found that the cell cycle pathway was followed by DNA replication, oocyte meiosis, and small cell lung cancer.
These were activated in the microenvironments around the tumors of the paclitaxel-resistant group, and the difference was statistically significant.
48
(Table 5) Therefore, it was found that cell proliferation is upregulated in the microenvironments around paclitaxel-resistant tumors
49
Table 5. Upregulated cell cycle-related genes in tumor microenvironments of the paclitaxel- resistant group.
Pathway Count PValue Genes
Cell cycle 32 1.23E-21
E2F2, DBF4, TTK, PKMYT1, CHEK1, PTTG1, TGFB2, CCNE2, CCNE1, CDC45, MCM7, BUB1, CCNA2, ORC1, CDC7, CDC6, CDK1, RBL1, CDC20, ESPL1, MCM2, CDC25C, MCM3, MCM4, MCM5, MCM6, CCNB1, CCND1, MAD2L1, CCNB2, PLK1, BUB1B
DNA replication 12 1.46E-09 PRIM1, RFC5, DNA2, MCM7, LIG1, POLE, POLA1, MCM2, MCM3, MCM4, MCM5, MCM6
Oocyte meiosis 16 4.36E-07
CDK1, SGOL1, PKMYT1, ESPL1, AURKA, CDC20, PTTG1, CDC25C, CCNE2, CCNB1, CCNE1, CCNB2, MAD2L1, PLK1, BUB1, FBXO5
Small cell lung cancer 13 3.21E-06 E2F2, CKS1B, COL4A2, COL4A1, ITGA3, CCNE2, CCNE1, CCND1, LAMA4, ITGA6, CKS2, LAMC1, NOS2 Fanconi anemia pathway 10 9.67E-06 RAD51C, BLM, APITD1, FANCI, EME1, BRIP1, FANCA, BRCA1, FANCB, RAD51
PI3K-Akt signaling pathway 25 4.13E-05
EFNA1, ITGB3, CCNE2, CCNE1, GM15776, INSR, ANGPT2, IL6, COL4A2, IL2RA, FLT1, COL4A1, FLT4, NR4A1, ITGA3, EPHA2, BRCA1, KDR, VWF, VEGFC, CCND1, LAMA4, ITGA6, IFNB1, LAMC1
p53 signaling pathway 10 9.22E-05 CCNE2, CCNB1, CDK1, CCNE1, CCND1, CCNB2, RRM2, CHEK1, PIDD1, GTSE1
Pathways in cancer 25 2.59E-04
E2F2, CKS1B, BDKRB2, TGFB2, CCNE2, CCNE1, RASGRP3, NOS2, GM15776, BMP4, TCF7, IL6, COL4A2, COL4A1, ITGA3, BIRC5, MECOM, FZD6, RAD51, VEGFC, LAMA4, CCND1, ITGA6, CKS2, LAMC1
Toxoplasmosis 11 6.72E-04 LAMA4, CCR5, ITGA6, HSPA1A, IL12B, NOS2, LAMC1, HSPA1B, H2-DMA, H2-DMB2, TGFB2
50
ECM-receptor interaction 10 7.42E-04 VWF, COL4A2, LAMA4, COL4A1, ITGA6, NPNT, ITGA3, LAMC1, ITGB3, HMMR
Cytokine-cytokine receptor interaction 17 0.001185209
IL6, IL2RA, CCR1, CCL5, TNFSF18, TNFSF8, TGFB2, IL11, CXCL10, CCL12, CCR5, TNFSF13B, PPBP, IFNB1, CX3CR1, IL12B, IFNLR1
Pyrimidine metabolism 10 0.001851466 PRIM1, DCTD, TYMS, RRM2, POLE, POLA1, DCK, NT5E, TK1, DUT
Focal adhesion 15 0.001933073 PARVG, COL4A2, FLT1, COL4A1, FLT4, MYLPF, ITGA3, ITGB3, KDR, VWF, VEGFC, CCND1, LAMA4, ITGA6, LAMC1 Rheumatoid arthritis 9 0.001974306 CCL12, IL6, FLT1, TNFSF13B, CCL5, H2-DMA, H2-DMB2, TGFB2, IL11
African trypanosomiasis 6 0.002669321 HBA-A1, IL6, LAMA4, HBB-BS, IL12B, HBB-BT Progesterone-mediated oocyte
maturation
9 0.002874 CCNB1, CDK1, MAD2L1, CCNB2, PLK1, BUB1, PKMYT1, CDC25C, CCNA2
Cell adhesion molecules (CAMs) 12 0.005608879 F11R, MPZL1, ICOSL, ITGA6, CD34, ICAM2, CLDN5, ESAM, H2-DMA, PDCD1, H2-DMB2, CDH5 Homologous recombination 5 0.007179496 RAD51C, BLM, EME1, RAD54L, RAD51
Hematopoietic cell lineage 8 0.009440762 SIGLECH, IL6, IL2RA, ITGA6, CD34, ITGA3, ITGB3, IL11 Malaria 6 0.010507177 HBA-A1, CCL12, IL6, HBB-BS, HBB-BT, TGFB2
Measles 10 0.013782577 CCNE2, CCNE1, IL6, CCND1, IL2RA, IFNB1, TACR1, HSPA1A, IL12B, HSPA1B Amoebiasis 9 0.016505573 COL4A2, IL6, LAMA4, COL4A1, SERPINB2, IL12B, NOS2, LAMC1, TGFB2
Rap1 signaling pathway 13 0.016667151 VEGFC, FLT1, RASGRP3, EFNA1, FLT4, RAPGEF4, ITGB3, ARAP3, ANGPT2, INSR, EPHA2, DOCK4, KDR Chagas disease (American
trypanosomiasis)
8 0.024952209 CCL12, IL6, IFNB1, IL12B, NOS2, BDKRB2, CCL5, TGFB2
51
Increased proliferation of fibroblast and endothelial cells in the micro-environment in the tumors of the paclitaxel- resistant group
To determine which cell proliferation increased around the tumors of the paclitaxel-resistant group, the IHC staining of paclitaxel-resistant and -sensitive tumors was analyzed using the KI-67 antibody, a cell proliferation marker. It was found that KI-67 expression increased in the tumors of the paclitaxel-resistant group compared to the tumors of the paclitaxel-sensitive group in the surrounding tumor cells, such as fibroblast (Figure 10A) and endothelial cells (Figure 10B). In addition, to identified whether they were actually fibroblast and endothelial cells, IHC staining was conducted using the α-SMA and CD31 antibody, a fibroblast marker and an endothelial cell marker.
Then, the number of KI-67 positive endothelial cells and fibroblasts in the tumors of both the paclitaxel-resistant and -sensitive group were counted to compare the number of KI-67 positive endothelial cells and fibroblasts in the tumors. As a result, in the tumors of the paclitaxel- resistant group, a greater number of KI-67 positive endothelial cells and
52
fibroblast were found compared to that of the paclitaxel-sensitive group, (Figure 10C). Consequently, tumors of the paclitaxel-resistant group upregulated the proliferation of fibroblast and endothelial cells in-vivo.
53
54
Figure 10. The upregulated proliferation of endothelial cells and fibroblasts in tumors of the paclitaxel-resistant group. Paraffin-embedded tissue microarray sections were identified through IHC with anti-Ki67, α-SMA, CD31 antibody. (A) The black arrow indicates the fibroblasts in the tumor.
(B) The black open arrow indicates the endothelial cells in the tumor.
Representative photomicrographs of the paclitaxel-sensitive or -resistant group tumor tissues. (C) The differences in the number of KI-67 positive fibroblasts and endothelial cells between the paclitaxel-resistant and - sensitive tumors were counted in the tumor tissues and quantified. Data were expressed as mean ± standard deviation (SD). * p ≤ 0.05 (Mann- Whitney t-test).
55
The decreased proliferation of fibroblasts in the inhibition of the JAK2 TNBC cell line conditioned media
To determine whether the JAK-STAT pathway activity affects the fibroblasts that comprise the micro-environment around the tumor, the effects of conditioned media (CM) extracted from JAK2 inhibited TNBC cell lines on the fibroblasts of mice proliferation were analyzed using an MTT assay. As a result, it was confirmed that proliferation decreased in fibroblasts incubated in CM extracted from JAK2-inhibited TNBC cell lines, and the difference was statistically significant (Figure 11). Therefore, it confirmed that the activation of the JAK-STAT signaling pathway affects the proliferation of fibroblasts comprising the micro-environment around the tumors.
56
Figure 11. Decreased proliferation of fibroblasts incubated in conditioned media extracted from JAK2 inhibited TNBC cell lines. The proliferation of mouse fibroblasts treated with NTC or JAK2i CM was compared. The inhibition of TNBC cell lines were placed in CM for 72 h. Mouse fibroblast proliferation was measured using MTT arrays. Data were expressed as mean ± standard deviation (SD). Each experiment was performed in triplicate. * p ≤ 0.05; ** p ≤ 0.01; *** p ≤ 0.001; **** p ≤ 0.0001 (Multiple t-test).
57
Discussion
Paclitaxel is a common chemotherapeutic agent for breast cancer treatment, but the anti-tumor activity of paclitaxel is limited by resistance, which is naturally acquired after long-term exposure. One of the challenges in treating breast cancer is chemotherapy resistance. In this study, we investigated how the activation of the JAK-STAT pathway affects paclitaxel resistance in TNBC. Paclitaxel was administered for 4 weeks to seven PDX models of TNBC-derived tissues. Then, reactivity with the paclitaxel-resistant and -sensitive group was established via differences in the rate of tumor size reduction caused by paclitaxel. RNA transcriptome analysis showed that the expression levels of genes related to the JAK- STAT pathway increased in paclitaxel-resistant tumors. Therefore, we hypothesized that paclitaxel resistance in TNBC may be related to the activity of the JAK-STAT pathway. Additionally, western blot assay confirmed that paclitaxel-resistant TNBC tumors upregulated the protein expression levels of JAK2, STAT3, and STAT5 as well as increased the
58
activation of the JAK-STAT pathway through the upregulated protein expression of pJAK2.
To investigate the mechanism of paclitaxel resistance by the upregulation of the JAK-STAT pathway, various experiments were performed on TNBC cell lines. The mRNA and protein expression levels of the JAK2, STAT3, and STAT5 were analyzed in 11 breast cancer cell lines.
Of the 11 breast cancer cell lines, five TNBC cell lines were selected that had high expression and activity of JAK-STAT signaling pathway. In addition, it was confirmed that the anti-tumor function of paclitaxel increased when JAK2 was blocked through ruxolitinib, JAK1, and JAK2 inhibitors or siRNA. As a result, the JAK-STAT pathway activity was found to be correlated with paclitaxel resistance. Consequently, the JAK-STAT signaling pathway was found to affect sensitivity to paclitaxel.
To overcome chemotherapy resistance in breast cancer, various treatment methods have been introduced, such as the use of new potent anti-cancer reagents and combination chemotherapy with targeted agents.
Previous studies have reported several methods for the treatment of paclitaxel-resistant cancers [42-44]. This study demonstrates that in
59
TNBC, the chemoresistance of paclitaxel is associated with the upregulation of JAK-STAT pathway activity.
The JAK-STAT pathway affects many cancers. In recent studies, the activation of JAK-STAT signaling enhanced the proliferation of cancer stem cells (CSCs), such as side populations, [45] cancer cell migration, [46]
and tumor progression. [47] In breast cancer, carcinogenicity is caused by the activity of STAT3 [48], and lasting STAT3 activation in about 70% of breast cancers [49] Overall, STAT3 activation is found, regardless of subtypes, in breast cancer, but is most associated with TNBC. [50, 51] A recent study showed that advanced breast tumor progression is due to constantly active STAT3 caused by exploited cancer cell proliferation, angiogenesis, and EMT. [52] Specifically, STAT3 can upregulate genes promoting angiogenesis (VEGF), anti-apoptosis (such as bcl-xl and mcl1), invasion (MMP1), and proliferation (cyclinD1)-related proteins. [53]
STAT5 promotes differentiation of the mammary gland and upregulates anti-apoptosis genes. [54] More frequently in hormone responsive breast cancers, abiding activation of STAT5 has been confirmed. [50, 54]
Additionally, mice experience progression in mammary tumors via the
60
constitutive upregulation of STAT5 activity [55]. A recent study revealed that the constitutive JAK2 activation caused by the V617F mutation occurs due to the upregulation of STAT5 activity, leading to increased tumor growth and the blocking of cancer cell death in breast cancer.[56]
Inhibition of the JAK-STAT signaling pathway can potentially promote the anti-tumor activity of paclitaxel in TNBC. Although the mechanism by which the JAK-STAT pathway affects paclitaxel resistance is currently unknown, the results of the present study suggest that the inhibition of JAK-STAT signaling pathway may increase sensitivity to paclitaxel via the regulation of tumor micro-environments, such as cancer- associated fibroblasts (CAFs) and endothelial cells. Previous studies have shown that cancer-associated fibroblasts (CAFs) promote cancer stem cell renewal and mammosphere forming capacity through promoted JAK-STAT signaling [40] and cancer-associated adipocytes promoted radiation therapy resistance via the upregulation of IL-6 expression in breast cancer [41]. In breast cancer, it has been reported that CAFs are associated with resistance to chemotherapeutic drugs, such as paclitaxel. [57]
61
This study has some important limitations. First, the number of TNBC PDX models used in this experiment is limited. Seven TNBC PDX models were applied and a paclitaxel-sensitive and -resistant group were established according to the relative rate of reduction of tumor size after paclitaxel treatment. Then, RNA transcriptome was used to select genes with differences in gene expression between these two groups. Therefore, there may be enough error in the selection of genes related to paclitaxel resistance, so it is necessary to confirm whether this tendency is shown for other TNBC PDX models with paclitaxel resistance. Second, there is a lack of comparative data in other breast cancer subtypes, such as luminal or HER2+. A recent study showed that the activation of JAK2 and STAT3 is associated with resistance to tamoxifen in luminal subtype breast cancer.
[58] Therefore, in addition to TNBC, other subtypes may cause chemotherapy resistance through the activation of the JAK-STAT pathway.
Further studies related to the JAK-STAT pathway should be conducted on other subtypes of breast cancer. In this study, the paclitaxel-resistant and -sensitive groups were established via in vivo experiments using the TNBC PDX models. However, in vitro experiments were performed using general
62
TNBC cell lines. Therefore, it is necessary to establish stabilized paclitaxel- resistant breast cancer cell lines to confirm the experiments associated with paclitaxel resistance, and that they have the results and reproducibility tested in this study. There is currently a limit to our ability to fully understand how the activation of the JAK-STAT pathway acts on paclitaxel resistance associated with tumor microenvironments. Therefore, further studies are needed to elucidate this mechanism.
63
References
1. Jung, K.W., et al., Cancer Statistics in Korea: Incidence, Mortality,
Survival, and Prevalence in 2016. Cancer Res Treat, 2019. 51(2): p.
417-430.
2. Criscitiello, C., et al., Understanding the biology of triple-negative
breast cancer. Annals of Oncology, 2012. 23: p. 13-18.
3. Shao, F.Y., H. Sun, and C.X. Deng, Potential therapeutic targets of
triple-negative breast cancer based on its intrinsic subtype.
Oncotarget, 2017. 8(42): p. 73329-73344.
4. Jhan, J.R. and E.R. Andrechek, Triple-negative breast cancer and
the potential for targeted therapy. Pharmacogenomics, 2017. 18(17):
p. 1595-1609.
64
5. Taxman, D.J., et al., Transcriptional profiling of targets for
combination therapy of lung carcinoma with paclitaxel and mitogen-
activated protein/extracellular signal-regulated kinase kinase
inhibitor. Cancer Res, 2003. 63(16): p. 5095-104.
6. Blagosklonny, M.V. and T. Fojo, Molecular effects of paclitaxel:
Myths and reality (a critical review). International Journal of Cancer,
1999. 83(2): p. 151-156.
7. Jordan, M.A. and L. Wilson, Microtubules as a target for anticancer
drugs. Nature Reviews Cancer, 2004. 4(4): p. 253-265.
8. Zasadil, L.M., et al., Cytotoxicity of Paclitaxel in Breast Cancer Is due
to Chromosome Missegregation on Multipolar Spindles. Science
Translational Medicine, 2014. 6(229).
9. Westerhoff, H.V., A. Riethorst, and A.P.M. Jongsma, Relating
65
multidrug resistance phenotypes to the kinetic properties of their
drug-efflux pumps. European Journal of Biochemistry, 2000.
267(17): p. 5355-5368.
10. Kadoyama, K., et al., Hypersensitivity reactions to anticancer agents:
data mining of the public version of the FDA adverse event reporting
system, AERS. J Exp Clin Cancer Res, 2011. 30: p. 93.
11. Tanimukai, H., et al., Paclitaxel induces neurotoxicity through
endoplasmic reticulum stress. Biochemical and Biophysical Research
Communications, 2013. 437(1): p. 151-155.
12. Symmans, W.F., Breast cancer response to paclitaxel in vivo. Drug
Resistance Updates, 2001. 4(5): p. 297-302.
13. Bournazou, E. and J. Bromberg, Targeting the tumor
microenvironment: JAK-STAT3 signaling. JAKSTAT, 2013. 2(2):
66 p. e23828.
14. O'Shea, J.J., et al., The JAK-STAT Pathway: Impact on Human
Disease and Therapeutic Intervention. Annual Review of Medicine,
Vol 66, 2015. 66: p. 311-328.
15. Liongue, C., R. Sertori, and A.C. Ward, Evolution of Cytokine
Receptor Signaling. Journal of Immunology, 2016. 197(1): p. 11-18.
16. Britschgi, A., et al., JAK2/STAT5 Inhibition Circumvents Resistance
to PI3K/mTOR Blockade: A Rationale for Cotargeting These
Pathways in Metastatic Breast Cancer. Cancer Cell, 2012. 22(6): p.
796-811.
17. Creamer, B.A., et al., Stat5 promotes survival of mammary epithelial
cells through transcriptional activation of a distinct promoter in Akt1.
Mol Cell Biol, 2010. 30(12): p. 2957-70.
67
18. Hosford, S.R. and T.W. Miller, Clinical potential of novel therapeutic
targets in breast cancer: CDK4/6, Src, JAK/STAT, PARP, HDAC,
and PI3K/AKT/mTOR pathways. Pharmgenomics Pers Med, 2014.
7: p. 203-15.
19. Iavnilovitch, E., et al., Deregulation of Stat5 expression and activation
causes mammary tumors in transgenic mice. Int J Cancer, 2004.
112(4): p. 607-19.
20. Marotta, L.L., et al., The JAK2/STAT3 signaling pathway is required
for growth of CD44(+)CD24(-) stem cell-like breast cancer cells
in human tumors. J Clin Invest, 2011. 121(7): p. 2723-35.
21. O'Shea, J.J., S.M. Holland, and L.M. Staudt, JAKs and STATs in
immunity, immunodeficiency, and cancer. N Engl J Med, 2013.
368(2): p. 161-70.
68
22. Ren, S.X., et al., Loss of Stat5a delays mammary cancer progression
in a mouse model. Oncogene, 2002. 21(27): p. 4335-4339.
23. Schmidt, J.W., et al., Stat5 Regulates the Phosphatidylinositol 3-
Kinase/Akt1 Pathway during Mammary Gland Development and
Tumorigenesis. Molecular and Cellular Biology, 2014. 34(7): p.
1363-1377.
24. Quintas-Cardama, A. and S. Verstovsek, Molecular pathways:
Jak/STAT pathway: mutations, inhibitors, and resistance. Clin
Cancer Res, 2013. 19(8): p. 1933-40.
25. Verstovsek, S., et al., Long-term treatment with ruxolitinib for
patients with myelofibrosis: 5-year update from the randomized,
double-blind, placebo-controlled, phase 3 COMFORT-I trial. J
Hematol Oncol, 2017. 10(1): p. 55.
69
26. Saenz, D.T., et al., BET protein bromodomain inhibitor-based
combinations are highly active against post-myeloproliferative
neoplasm secondary AML cells. Leukemia, 2017. 31(3): p. 678-687.
27. Yu, H.A., et al., A Phase 1/2 Trial of Ruxolitinib and Erlotinib in
Patients with EGFR-Mutant Lung Adenocarcinomas with Acquired
Resistance to Erlotinib. J Thorac Oncol, 2017. 12(1): p. 102-109.
28. Hurwitz, H.I., et al., Randomized, Double-Blind, Phase II Study of
Ruxolitinib or Placebo in Combination With Capecitabine in Patients
With Metastatic Pancreatic Cancer for Whom Therapy With
Gemcitabine Has Failed. Journal of Clinical Oncology, 2015. 33(34):
p. 4039-+.
29. Ju, W., et al., Augmented efficacy of brentuximab vedotin combined
with ruxolitinib and/or Navitoclax in a murine model of human
70
Hodgkin's lymphoma. Proceedings of the National Academy of
Sciences of the United States of America, 2016. 113(6): p. 1624-
1629.
30. Dobin, A., et al., STAR: ultrafast universal RNA-seq aligner.
Bioinformatics, 2013. 29(1): p. 15-21.
31. Anders, S., P.T. Pyl, and W. Huber, HTSeq-a Python framework to
work with high-throughput sequencing data. Bioinformatics, 2015.
31(2): p. 166-169.
32. Robinson, M.D., D.J. McCarthy, and G.K. Smyth, edgeR: a
Bioconductor package for differential expression analysis of digital
gene expression data. Bioinformatics, 2010. 26(1): p. 139-140.
33. Love, M.I., W. Huber, and S. Anders, Moderated estimation of fold
change and dispersion for RNA-seq data with DESeq2. Genome Biol,
71 2014. 15(12): p. 550.
34. Huang, D.W., B.T. Sherman, and R.A. Lempicki, Systematic and
integrative analysis of large gene lists using DAVID bioinformatics
resources. Nature Protocols, 2009. 4(1): p. 44-57.
35. de Hoon, M.J., et al., Open source clustering software. Bioinformatics,
2004. 20(9): p. 1453-4.
36. Saldanha, A.J., Java Treeview-extensible visualization of microarray
data. Bioinformatics, 2004. 20(17): p. 3246-3248.
37. Mascarenhas, J. and R. Hoffman, Ruxolitinib: The First FDA
Approved Therapy for the Treatment of Myelofibrosis. Clinical
Cancer Research, 2012. 18(11): p. 3008-3014.
38. Cokol-Cakmak, M., et al., Diagonal Method to Measure Synergy
Among Any Number of Drugs. Jove-Journal of Visualized
72 Experiments, 2018(136).
39. Foucquier, J. and M. Guedj, Analysis of drug combinations: current
methodological landscape. Pharmacology Research & Perspectives,
2015. 3(3).
40. Tsuyada, A., et al., CCL2 Mediates Cross-talk between Cancer Cells
and Stromal Fibroblasts That Regulates Breast Cancer Stem Cells.
Cancer Research, 2012. 72(11): p. 2768-2779.
41. Bochet, L., et al., Cancer-associated adipocytes promotes breast
tumor radioresistance. Biochemical and Biophysical Research
Communications, 2011. 411(1): p. 102-106.
42. Wang, L., et al., Targeting HDAC with a novel inhibitor effectively
reverses paclitaxel resistance in non-small cell lung cancer via
multiple mechanisms. Cell Death & Disease, 2016. 7.
73
43. Bae, T., et al., Restoration of paclitaxel resistance by CDK1
intervention in drug-resistant ovarian cancer. Carcinogenesis, 2015.
36(12): p. 1561-1571.
44. Mi, Y.J., et al., Apatinib (YN968D1) Reverses Multidrug Resistance
by Inhibiting the Efflux Function of Multiple ATP-Binding Cassette
Transporters. Cancer Research, 2010. 70(20): p. 7981-7991.
45. Ruan, Z.Y., X.Y. Yang, and W.W. Cheng, OCT4 accelerates
tumorigenesis through activating JAK/STAT signaling in ovarian
cancer side population cells. Cancer Management and Research,
2019. 11: p. 389-398.
46. Khanna, P., et al., GRAMD1B regulates cell migration in breast cancer
cells through JAK/STAT and Akt signaling. Scientific Reports, 2018.
8.
74
47. Zhu, D.Y., et al., Long noncoding RNA PART1 promotes progression
of non-small cell lung cancer cells via JAK-STAT signaling
pathway. Cancer Medicine, 2019.
48. Burke, W.M., et al., Inhibition of constitutively active Stat3
suppresses growth of human ovarian and breast cancer cells.
Oncogene, 2001. 20(55): p. 7925-34.
49. Alvarez, J.V., et al., Identification of a genetic signature of activated
signal transducer and activator of transcription 3 in human tumors.
Cancer Research, 2005. 65(12): p. 5054-5062.
50. Walker, S.R., et al., Reciprocal Effects of STAT5 and STAT3 in
Breast Cancer. Molecular Cancer Research, 2009. 7(6): p. 966-976.
51. Marotta, L.L.C., et al., The JAK2/STAT3 signaling pathway is
required for growth of CD44(+)CD24(-) stem cell-like breast
75
cancer cells in human tumors. Journal of Clinical Investigation, 2011.
121(7): p. 2723-2735.
52. Banerjee, K. and H. Resat, Constitutive activation of STAT3 in breast
cancer cells: A review. International Journal of Cancer, 2016.
138(11): p. 2570-2578.
53. Walker, S.R., M. Xiang, and D.A. Frank, Distinct roles of STAT3 and
STAT5 in the pathogenesis and targeted therapy of breast cancer.
Mol Cell Endocrinol, 2014. 382(1): p. 616-621.
54. Cui, Y., et al., Inactivation of Stat5 in mouse mammary epithelium
during pregnancy reveals distinct functions in cell proliferation,
survival, and differentiation. Molecular and Cellular Biology, 2004.
24(18): p. 8037-8047.
55. Iavnilovitch, E., B. Groner, and I. Barash, Overexpression and forced
76
activation of Stat5 in mammary gland of transgenic mice promotes
cellular proliferation, enhances differentiation, and delays
postlactational apoptosis. Molecular Cancer Research, 2002. 1(1): p.
32-47.
56. Caffarel, M.M., et al., Constitutive activation of JAK2 in mammary
epithelium elevates Stat5 signalling, promotes alveologenesis and
resistance to cell death, and contributes to tumourigenesis. Cell
Death Differ, 2012. 19(3): p. 511-22.
57. Li, X., et al., Reverse of microtubule-directed chemotherapeutic
drugs resistance induced by cancer-associated fibroblasts in breast
cancer. Onco Targets Ther, 2019. 12: p. 7963-7973.
58. Kim, J.W., et al., Inhibition of tumor growth and angiogenesis of
tamoxifen-resistant breast cancer cells by ruxolitinib, a selective
77
JAK2 inhibitor. Oncol Lett, 2019. 17(4): p. 3981-3989.
78
국문초록
유방암은 전 세계적으로 여성암 중 가장 높은 비율을 차지하고 있으며,
한국에서는 유방암의 발병률이 해마다 꾸준히 증가하고 있다. 삼중 음성 유방암 은 여러가지 아형 유방암 중 가장 악성이며 치료하기가 가장 어려운 유형이다.
다른 아형 유방암에서는 호르몬 요법을 통해 estrogen 수용체, progesterone 수용체, 그리고 HER2 수용체 중 하나를 표적으로 하여 치료하지만, 삼중 음성 유방암의 경우 이러한 수용체 분자가 존재하지 않기 때문에 치료가 어려우며
보통 항암치료를 동반하게 된다. 파클리탁셀은 유방암의 치료에 대표적인 항암제 중 하나이지만, 항암치료를 하는 과정에서 파클리탁셀에 대한 내성을
획득하기도 하며, 이러한 항암제에 대한 내성은 유방암의 치료에 있어 여전히 큰 문제 중 하나이다. 따라서 본 연구는 삼중 음성 유방암에서 어떠한 기작으로 파클리탁셀에 대한 내성이 발생하는지를 알아보기 위해 7가지 삼중 음성 유방암 환자유래조직 모델을 이용하여 파클리탁셀에 대한 반응성을 평가하였다.
각각의 삼중 음성 유방암 환자유래조직 모델들은 대조군과 파클리탁셀 투여군으로 구성되었고, PBS 또는 파클리탁셀을 15mg/kg으로 4주간 복강 내 주사로 투여�