저작자표시-비영리-변경금지 2.0 대한민국 이용자는 아래의 조건을 따르는 경우에 한하여 자유롭게
l 이 저작물을 복제, 배포, 전송, 전시, 공연 및 방송할 수 있습니다. 다음과 같은 조건을 따라야 합니다:
l 귀하는, 이 저작물의 재이용이나 배포의 경우, 이 저작물에 적용된 이용허락조건 을 명확하게 나타내어야 합니다.
l 저작권자로부터 별도의 허가를 받으면 이러한 조건들은 적용되지 않습니다.
저작권법에 따른 이용자의 권리는 위의 내용에 의하여 영향을 받지 않습니다. 이것은 이용허락규약(Legal Code)을 이해하기 쉽게 요약한 것입니다.
Disclaimer
저작자표시. 귀하는 원저작자를 표시하여야 합니다.
비영리. 귀하는 이 저작물을 영리 목적으로 이용할 수 없습니다.
변경금지. 귀하는 이 저작물을 개작, 변형 또는 가공할 수 없습니다.
공학석사학위논문
초기 가열 속도가 박막 고체산화물 연료전지에 끼치는 영향
Effect of initial heating rate on thin-film solid oxide fuel cell
2015년 2월
서울대학교 대학원 기계항공공학부
강 성 민
초기 가열 속도가 박막 고체산화물 연료전지에 끼치는 영향
Effect of initial heating rate on thin-film solid oxide fuel cell
지도교수 차 석 원
이 논문을 공학석사 학위논문으로 제출함
2014년 10월 서울대학교 대학원
기계항공공학부 강 성 민
강성민의 공학석사 학위논문을 인준함 2014년 12월
위 원 장 (인)
부위원장 (인)
위 원 (인)
Abstract
Thin-film solid oxide fuel cells supported on nano-porous anodic aluminum oxide substrates were fabricated by sequential sputtering methods. Cells were initially heated by three levels of heating rates (10 °Cmin-1, 30 °Cmin-1 and 50 °Cmin-1) from room temperature to the operating temperature of 450 °C. Grain growth of the electrolyte thin film was observed at the faster initial heating rate; average grain sizes were measured by 13.09 nm (10 °Cmin-1), 25.92 nm (30 °Cmin-1) and 89.87 nm (50 °Cmin-1), respectively. Growth of Pt clusters of cathode was followed by grain growth of supporting electrolyte surface, resulting in the reduction of porosity and triple phase boundary. Cell performance was significantly decreased by slowed cathodic reaction kinetics originated from the grain growth of thin-film electrolyte surface and reduction of triple phase boundary. Faradaic area-specific resistance was almost doubled at the 50 °Cmin-1 of initial heating to the cell, compared to 10 °Cmin-1 heated cell. Annealing electrolyte before the deposition of cathode layer enhanced the crystallinity and interfacial stability with the cathode. As a result, increase of faradaic impedance by fast initial heating was significantly reduced.
Keywords : Solid oxide fuel cell, thin film, electrolyte, initial heating rate, grain boundary
Student Number : 2013-20638
Contents
Abstract ··· i
Contents ··· ii
List of Tables ··· iv
List of Figures ··· iv
1. Introduction ··· 1
1.1 Fuel cell ··· 1
1.2 Thin-film solid oxide fuel cell ··· 4
1.3 Objective of the research ··· 7
2. Experimental ··· 9
2.1 Cell fabrication ··· 9
2.2 Electrochemical performance measurement ··· 12
2.3 Annealing electrolyte ··· 15
2.4 Further measurements and analyses ··· 15
3. Result and discussions ··· 16
3.1 Effect of initial heating rate on non-annealed cells ··· 16
3.1.1 Performance variation of non-annealed cells ··· 16
3.1.2 Surface morphology variation of non-annealed cells ··· 21
3.2 Effect of initial heating rate on annealed-electrolyte cells ··· 28
3.2.1 Annealing YSZ electrolyte ··· 28
3.2.2 Performance variation of annealed-electrolyte cells ··· 32
3.2.3 Surface morphology variation of annealed-electrolyte cells ··· 37
4. Conclusion ··· 41
Reference ··· 42
국문 초록 ··· 45
List of Tables
Table. 1.1 Fuel cell types [1]
Table. 3.1 Equivalent-circuit fitted area-specific resistances of electrochemical impedance spectra of thin-film solid oxide fuel cells initially heated by 10 ˚Cmin-1, 30 ˚Cmin-1 and 50 ˚Cmin-1. Time constants of faradaic area-specific resistances arc specified in parenthesis
Table. 3.2 Equivalent-circuit fitted area-specific resistances of electrochemical impedance spectra of annealed-electrolyte thin- film solid oxide fuel cells initially heated by 10 ˚Cmin-1 and 50 ˚Cmin-1. Time constants of faradaic area-specific resistances are specified in parenthesis
List of Figures
Fig.1.1 Ionic conductivities of representative ceramic electrolytes [1].
Oxygen ionic conductivities are shown, except BYZ which has protonic conductivity
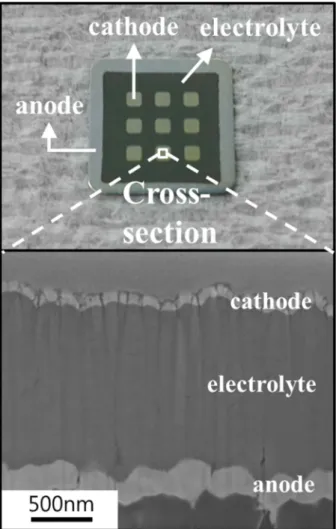
Fig.2.1 Fabricated thin-film solid oxide fuel cell and its cross-sectional image obtained by focused-ion beam technique
Fig.2.2 Schematics of the experimental setup
Fig.2.3 Cell temperature profile. Electrochemical performances were measured at black arrow points
Fig.3.1 Electrochemical impedance spectra of thin-film solid oxide fuel cells initially heated by 10 ˚Cmin-1, 30 ˚Cmin-1 and 50 ˚Cmin-1 Fig.3.2 Surface morphologies of YSZ electrolytes initially heated by
(a)10 ˚Cmin-1, (b)30 ˚Cmin-1 and (c)50 ˚Cmin-1 obtained by field- emission scanning electron microscopy
Fig.3.3 Surface morphologies of Pt cathodes of thin-film solid oxide fuel cells initially heated by (a)10 ˚Cmin-1, (b)30 ˚Cmin-1 and
(c)50 ˚Cmin-1 obtained by field-emission scanning electron microscopy
Fig.3.4 Binary images of surface morphologies of Pt cathodes of thin- film solid oxide fuel cells initially heated by (a)10 ˚Cmin-1, (b)30 ˚Cmin-1 and (c)50 ˚Cmin-1 processed by ImageJ software Fig.3.5 X-ray diffraction results of annealed and as-deposited YSZ thin
films
Fig.3.6 Three-dimensional surface morphologies of as-deposited and annealed YSZ thin films obtained by atomic forced microscopy Fig.3.7 Electrochemical impedance spectra of annealed-electrolyte thin-
film solid oxide fuel cells initially heated by 10 ˚Cmin-1 and 50 ˚Cmin-1
Fig.3.8 Surface morphologies of YSZ electrolytes of annealed- electrolyte cells initially heated by (a)10 ˚Cmin-1 and
(b)50 ˚Cmin-1 obtained by field-emission scanning electron microscopy
Fig.3.9 Surface morphologies of Pt cathodes of annealed-electrolyte cells initially heated by (a)10 ˚Cmin-1 and
(b)50 ˚Cmin-1 obtained by field-emission scanning electron microscopy
Fig.3.10 Binary images of Pt cathode surface morphologies of annealed- electrolyte cells initially heated by (a)10 ˚Cmin-1 and (b)50
˚Cmin-1 processed by ImageJ software
1. Introduction
1.1 Fuel cell
Technologies about eco-friendly energy are being researched with great attention and investigation, because of the growth of energy demand and global warming. Fuel cell, solar cell and wind energy device are the representative technologies about renewable energy. Among them, fuel cell is regarded as the core research field for the future hydrogen economy, being studied in many institutes around the world.
Fuel cell is the energy conversion device which converts hydrogen and oxygen gases into the H2O, generating electrical energy. The device is named as “cell” like batteries, but actually works continuously with the fuel supply similar to engines.
However, fuel cells generate energy directly converted from the chemical reaction, while combustion engines extract energy from the thermal energy formed by combustion reaction of the fuel. Therefore there is no Carnot limitation of the thermal efficiency with the fuel cell, expecting much higher thermal efficiency. In addition, fuel cells do not produce pollutants such as oxides of nitrogen and sulfur.
Table 1.1 Fuel cell types [1]
Fuel cells are classified by their electrolytes and fuels into a few types shown in Table 1.1. Polymer electrolyte membrane fuel cell (PEMFC) and solid oxide fuel cell (SOFC) are the representative fuel cell types. PEMFC operates at room temperature, utilizing the proton-conducting polymer membrane as an electrolyte [2]. Novel metal catalyst such as platinum (Pt) must be used at both anode and cathode in order to activate electrochemical reactions at room temperature. Only highly-pure hydrogen gas should be supplied into the anode of PEMFC because of preventing intoxication of Pt catalyst by the carbon monoxide. PEMFC produces liquid water at the cathode interface and causes water flooding at the fuel chamber, which is one of the most critical issues for design of the PEMFC system.
SOFC operates at over 700 ˚C and utilizes ceramic materials as the electrolyte [3].
Novel metal is not necessary as the catalyst because of the high operating temperature, resulting in relatively low-cost fabrication of the stack. Various hydrocarbon fuels are available, and therefore SOFC can easily be applied to wide power range area without fuel processing devices, which also lose some part of energy and cost a lot [4–6].
Especially, carbon monoxide can also be used as a fuel, which acts a crucial poison to the PEMFC catalyst. And H2O is produced at the anode in gas phase, so that water flooding does not occur. Therefore simple and cost-effective design of electrode and fuel channel is possible compared to room-temperature fuel cell such as PEMFC. On the other hand, there are also disadvantages from the high-temperature operation. One important problem is destabilization of materials. Materials get destabilized and cracks are formed when exposed at high temperature for long time, having degradation of overall cell performance [7–10]. Thereby the selection of materials for each part of system is strongly limited, especially for interconnectors. Besides, there
is an additional cost for thermal balance in the whole SOFC system.
1.2 Thin-film solid oxide fuel cell
Thin-film solid oxide fuel cell is a type of SOFC utilizing ceramic thin film as its ion-conducting electrolyte [11]. Comparably low-temperature operation at below 500
˚C is possible with this type of SOFC because of significantly short ionic conduction path, even though the electrolyte has very small conductivity at low temperature. The ultimate goal of thin-film SOFC is low-temperature operation with high performance, and a large number of researches are being actively studied with various thin-film deposition technologies.
Lower temperature limit of general SOFC is near 600~700 ˚C. Gadolinia-doped ceria (GDC) is often used as intermediate-temperature SOFC, because GDC has higher ionic conductivity at below 700 ˚C than yttria-stabilized zirconia (YSZ), which is most common material for electrolyte of SOFC [12–14]. But the partial reduction of Ce4+ occurs at anode, losing the cell voltage by current leakage through the GDC electrolyte. Thin-film SOFC can utilize YSZ without voltage loss by leakage current, lower the operating temperature at the same time. Therefore thin-film SOFC can easily be fabricated with chemical, mechanical stability. Fig 1.1 shows ionic conductivities of various ceramic electrolytes.
Thin-film SOFC generally operates at below 500 ˚C. Low-cost and highly- functional materials such as stainless steel can be utilized as part of cell at low temperature range, which are not available in conventional SOFC. SOFC has designed for distributed electrical generation systems or large power plants so far, but
portable-size device can be fabricated with thin-film SOFC. That is, thin-film SOFC extends the application area to few-watt systems in portable scales.
Fig 1.1 Ionic conductivities of representative ceramic electrolytes [1]. Oxygen ionic conductivities are shown, except BYZ which has protonic conductivity
1.3 Objective of the research
One of the challenging issues for the research about SOFC is slow start-up. Slow initial heating and cooling down of the system is necessary in order to avoid the thermal destabilization of materials of each part of SOFC. An entire day is generally drawn for initializing and turning off SOFC system. If fast initial heating or cooling down is imposed to SOFC system, crack or destabilization of materials will occur, resulting in irreversible cell performance degradation.
Slow start-up issue should be resolved in order to apply thin-film SOFC into portable-scale devices. However, researches about start-up in thin-film SOFC area have not been studied so far, while thermal cycling and long-term durability were studied [15]. Studies about thin-film SOFC systems have yet been searched considerably, because thin-film SOFC are currently researched in the level of single cell performance.
Nano-scale materials have different thermal, mechanical properties from their bulk materials. Therefore start-up issue must be dealt with thin-film specialized point of view as separated from conventional SOFC. Electrode-electrolyte interlayer or multi- layer electrolyte approaches and multi-scale configuration of electrode have been applied in previous studies to enhance the performance of thin-film SOFC, but the cells are very difficult to be analyzed electrochemically [16]. Therefore, in this study, simple cell figure was introduced by Pt electrodes and YSZ electrolyte thin films deposited by sputtering on nano-porous anodic aluminum oxide (AAO) substrate in order to measure electrochemical properties analytically.
YSZ is a greatly stable material with chemical, mechanical strength and has good
ionic conductivity at over 700 ˚C of temperature range. Most of conventional SOFC utilize YSZ as electrolyte. And Pt is one of the best electronic conductors and known for the best catalyst in the Earth. Pt pure metal electrode is unavailable in conventional SOFC because agglomeration of particle occurs at high temperature, causing complete destabilization of material structure and losing active area of chemical reaction and pores for gas diffusion. But agglomeration is alleviated at comparably low temperature in thin-film SOFC, and Pt enhances the reaction kinetics at electrode interfaces.
All electrodes and electrolyte thin films were deposited by direct-current (DC) sputtering technique. Fabricated cells were experienced by initial heating rates of 10
˚Cmin-1, 30 ˚Cmin-1 and 50 ˚Cmin-1, respectively. Electrochemical performances were examined just after operating temperature of 450 ˚C had been reached. YSZ thin film had been annealed at 400 ˚C for 2 hours before Pt cathode was deposited in order to resolve the performance decrease at fast initial heating, and electrochemical properties was also measured with annealed-electrolye cells initially heated by 10
˚Cmin-1 and 50 ˚Cmin-1, respectively.
2. Experimental
2.1 Cell fabrication
Fig 2.1 shows the fabricated thin-film SOFC and its cross-section image obtained by focused-ion beam (FIB) technique. As seen in the FIB image, anode, electrolyte and cathode thin films are well-uniformly deposited.
Commercial nano-porous anodic aluminum oxide (AAO; Synkera Technology Inc.) was used as mechanical support for thin-film SOFC. AAO has average nano-pores of 80 nm-diameter, 1 X 1 cm2 of rectangle surface area and 100 μm-thickness.
300 nm-thick Pt thin-film anode was deposited on AAO substrate by direct-current (DC) sputtering method. DC power of 200 W was delivered to Pt target, and the 5 mTorr-argon (Ar) atmosphere was maintained in the sputtering chamber. Though 5 mTorr is relatively high-vacuum condition for dense film deposition, gas-permeable porous film can be achieved because of the porous substrate and columnar growth of sputtered film.
Dense 8 mol% YSZ thin film electrolyte was deposited on Pt anode layer by reactive DC sputtering and the thickness is 1.4 μm. 200 W of DC power was delivered to YSZ target and the chamber pressure was 7 mTorr of Ar-O2 (2:8) mixture gas. Only 8 X 8 mm2 of rectangle area was covered with YSZ electrolyte thin film in order to collect anodic current to silver wire.
Finally, 1 X 1 mm2 of porous Pt thin film cathode was deposited on YSZ electrolyte layer by DC sputtering of 100 W power. 90 mTorr-Ar was maintained in the sputtering chamber and the thickness is 150 nm.
99.9 % Pt metal was used as Pt anode and cathode sputtering target, and the target has a 5 cm-diameter and 2 mm-thickness. Zr0.84Y0.16 alloy was utilized as YSZ reactive sputtering target which has a 5 cm-diameter and 5mm in thinkness. O2
atmosphere in the chamber causes reactive sputtering to make ceramic-phase thin film.
All sputtering was conducted at room temperature and substrate-to-target distance was 15 cm.
Fig 2.1 Fabricated thin-film solid oxide fuel cell and its cross-sectional image obtained by focused-ion beam technique
2.2 Electrochemical performance measurement
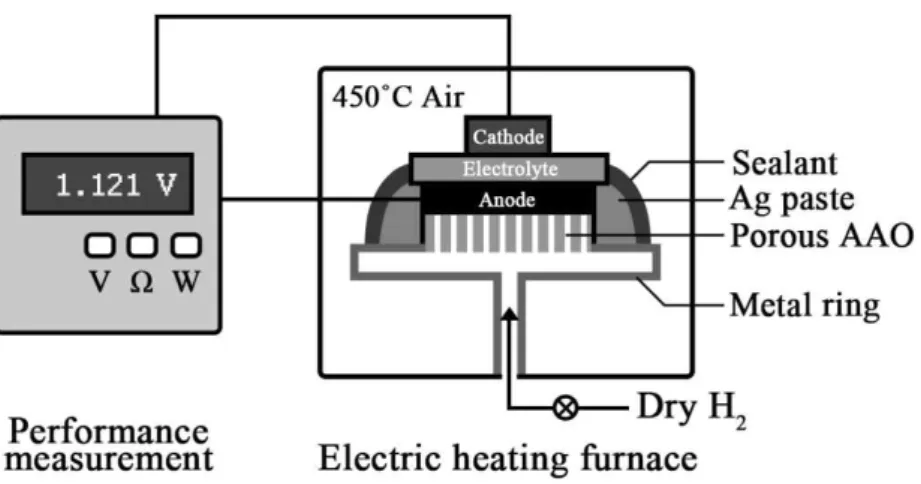
Fig 2.2 shows the simply-expressed experimental setup schematics. Stainless-steel ring holder was connected with Pt anode of fabricated thin-film SOFC by utilizing silver paste (597A, Aremco Products Inc.). Sealant paste (CP4010, Aremco Products Inc.) was used to ensure gas tightness between anode and cathode atmospheres. Silver wire was connected to ring holder by silver paste for anodic current collection.
Cathodic current was collected by contacting stainless-steel probe tip to the cathode surface. Pure and dry hydrogen gas was supplied to anode with flow rate of 50 cm3min-1 and cathode was exposed to ambient air (Air-breathing cathode).
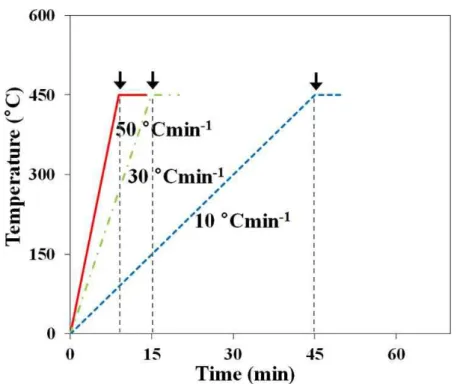
Thin-film SOFCs were heated in electrical heating furnace containing halogen heater and temperature control system. Electrochemical performances of cells were measured at 450 ˚C by utilizing Solartron 1287/1260 Impedance analyzer (Solartron Inc.), after the initial heating rates of 10 ˚Cmin-1, 30 ˚Cmin-1 and 50 ˚Cmin-1 had been imposed to the cells. Cell temperature profile is shown in Fig 2.3. Electrochemical impedance spectra were measured at open circuit voltage (OCV), 0.5 V, and 0.3 V of cell voltages, applied by 30 mV-alternating current (AC) input with frequency range from 2 Hz to 2 X 10⁶ Hz. Result of electrochemical impedance spectra showed constant x-axis intercept at the highest frequency and varying semi-circles, which means that capacitive behaviors in electrochemical impedance spectra represent the electrochemical reaction impedances at electrode-electrolyte interfaces or mass transfer polarizations at electrodes, while x-axis intercept shows ohmic impedance of cell. Electrochemical impedance results were fitted with the equivalent circuit comprising of one series R and several R-CPE (Constant-phase element) pairs.
Fig 2.2 Schematics of the experimental setup
Fig 2.3. Cell temperature profile. Electrochemical performances were measured at black arrow points
2.3 Annealing electrolyte
To suppress the performance degradation by rapid start-up, annealing YSZ thin film electrolyte was conducted. AAO-Pt anode-YSZ electrolyte assembly was annealed at 400 ˚C for 2 hours before Pt cathode had been deposited in order to avoid thermal agglomeration of air-exposed Pt cathode thin film, and cooled down naturally in ambient. Heating rate was 5 ˚Cmin-1. Then Pt cathode thin film was deposited by the same method as non-annealed cells, and fabricated cells are named as annealed- electrolyte cells. Electrochemical performances were identically measured at 450 ˚C after suffering from the initial heating rates of 10 ˚Cmin-1 and 50 ˚Cmin-1.
2.4 Further characterizations and analyses
Surface morphologies of YSZ electrolyte and Pt cathode thin films were achieved by field-emission scanning electron microscopy (FESEM; SUPRA 55VP, Carl Zeiss).
Achieved images by FESEM were processed into binary images and analyzed by ImageJ software (National Institute of Health, USA) to estimate the numerical values of average Pt cluster or YSZ grain sizes. Image processing steps were (1) reading the image and adjusting its contrast; (2) converting a gray scale image into a binary image; (3) counting the numbers of particles in a binary image. X-ray diffraction (XRD; X’pert Pro, PANalytical) was conducted with as-deposited YSZ and annealed YSZ thin films in order to measure crystal structure. Atomic-forced microscopy (AFM; Lab-customized, AFM workshop) was also implemented to find three- dimensional mirco-morphologies of YSZ surfaces.
3. Result and discussions
3.1 Effect of initial heating rate on non-annealed cells
3.1.1 Performance variation of non-annealed cells
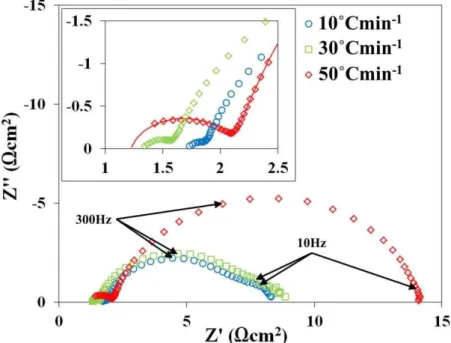
Electrochemical impedance spectra of 10 ˚Cmin-1, 30 ˚Cmin-1 and 50 ˚Cmin-1 initially heated cells are shown in Fig 3.1. Three semi-circles appear at the cells initially heated by 10 ˚Cmin-1 and 30 ˚Cmin-1, while two semi-circles appear at the 50
˚Cmin-1 heated cell. The additional semi-circles of 10 ˚Cmin-1 and 30 ˚Cmin-1 heatec cells appear at the lowest frequency range from 2 Hz to 10 Hz. Capativie behavior at below 10 Hz in the electrochemical impedance spectra of SOFC is believed to be the concentration polarization from the gas diffusion limitation of electrode [17–19]. And according to the study of Holme et al., semi-circles in electrochemical impedance spectra of thin-film SOFC complexily represent the impedances from chemical reactions occurred at both electrodes, and, semi-circle at high frequency range is dominated by hydrogen oxidation reaction at anode, while semi-circle at low frequency range is mostly determined by oxygen reduction reaction at cathode [20].
Therefore, in Fig 3.1, semi-circle which appears at the high frequency range of 2 X 10⁶ Hz ~ 5 X 10⁴ Hz is regarded as anodic electrochemical reaction impedance, and semi-circles which appear at the frequency range from 2 Hz to 5 X 10⁴ Hz are considerably determined by cathodic electrochemical reaction and partially mass transfer at far lower frequency range below 10 Hz.
electrochemical impedance spectra are shown in Table 3.1. 10 ˚Cmin-1 and 30 ˚Cmin-1 initially heated cells show similar impedance variations, but the impedance spectra of 50 ˚Cmin-1 heated cell varies significantly. Particularly, semi-circle at low frequency range was almost doubled. Estimated faradaic area-specific resistances at low frequency range (2 Hz ~ 5 X 10⁴ Hz) are 6.51 Ωcm2, 7.53 Ωcm2 and 12.06 Ωcm2 for 10 ˚Cmin-1, 30 ˚Cmin-1, and 50 ˚Cmin-1, recpectively. Large semi-circles of 10 ˚Cmin-
1 and 30 ˚Cmin-1 intially heated cells at the frequency range (10 Hz ~ 5 X 10⁵ Hz) have the time constant of near 300 Hz-1, and additional semi-circle appears at below 10 Hz. But semi-circle of 50 ˚Cmin-1 heated cell at same frequency range has the time constant of near 160 Hz-1, which is quite lower than other cells. Semi-circles originated by same eletrochemical reaction should have identical time constants, thus it is expected that there is hidden semi-circle at far lower frequency range below 10 Hz in the electrochemical impedance spectra of 50 ˚Cmin-1 initially heated cell. By determining the time constant of 300 Hz-1 for the semi-circle located at the frequency range of 10 Hz ~ 5 X 10⁴ Hz, further equivalent-circuit fitting was conducted with the electrochemical impedance spectra. Faradaic area-specific resistances of semi-circles at the frequency range of 10 Hz ~ 5 X 10⁴ Hz were calculated by 5.47 Ωcm2 for 10
˚Cmin-1, 6.19 Ωcm2 for 30 ˚Cmin-1, and 9.00 Ωcm2 for 50 ˚Cmin-1 initially heated cells. And the faradaic area-specfic resistances of semi-circles at the lowest frequency range below 10 Hz are 1.06 Ωcm2 for 10 ˚Cmin-1, 1.34 Ωcm2 for 30 ˚Cmin-1, and 3.06 Ωcm2 for 50 ˚Cmin-1 initially heated cells, respectively. Both semi-circles are much larger at the faster initial heating rate. Meanwhile, ohmic area-specific resistances were estimated by 1.75 Ωcm2, 1.34 Ωcm2, and 1.22 Ωcm2 for 10 ˚Cmin-1, 30 ˚Cmin-1, and 50 ˚Cmin-1 initially heated cells. Ohmic area-specific resistance was rather lower
when thin-film SOFC suffered from fast initial heating rate. Faradaic area-specific resistances from the semi-circle (time constant 2.5 X 10⁵ Hz-1) at the high-frequency range are 0.07 Ωcm2 for 10 ˚Cmin-1, 0.13 Ωcm2 for 30 ˚Cmin-1, and 0.88 Ωcm2 for 50
˚Cmin-1 initially heated cells, which is slightly increased at the faster initial heating rate. However, the changes of ohmic area-specific resistance and faradaic area- specific resistance at the high-frequency range (time constant 2 X 10⁵ Hz) were very little compared to the whole cell impedance. It is obvious that the faradaic area- specific resistance at the low-frequency range of 2 Hz ~ 5 X 10⁴ Hz dominates the whole cell performance.
Fig 3.1 Electrochemical impedance spectra of thin-film solid oxide fuel cells initially heated by 10 ˚Cmin-1, 30 ˚Cmin-1 and 50 ˚Cmin-1
Table 3.2 Equivalent-circuit fitted area-spectific resistances of electrochemical impedance spectra of thin-film solid oxide fuel cells initially heated by 10 ˚Cmin-1,
30 ˚Cmin-1 and 50 ˚Cmin-1. Time constants of faradaic area-specific resistance are specified in parenthesis
3.1.2 Surface morphology variation of non-annealed cells
Fig 3.2 shows the surface morphologies of YSZ electrolyte of cells initially heated by 10 ˚Cmin-1, 30 ˚Cmin-1, and 50 ˚Cmin-1 obtatined by FESEM. Larger surface grains were observed at faster initial heating rate; estimated average grain sizes are 13.09 nm for 10 ˚Cmin-1, 25.92 nm for 30 ˚Cmin-1, and 89.87 nm for 50 ˚Cmin-1 initially heated cells. Grain growth of YSZ at high-temperature annealing or sintering is general material behavior according to previous researches [21,22]. In this study, grain growth of YSZ surface was occurred when the rapid initial heating rate was imposed, even though the operating temperature was identical 450 ˚C for all cells.
The surface morphology of as-deposited YSZ electrolyte thin-film showed similar figure with 10 ˚Cmin-1 initially heated YSZ surface.
Shim et al. reported that 18O/16O ratio is three-time higher at the grain boundary of YSZ surface compared to bulk grain, thus oxygen exchange is more active when the YSZ surface adjacent to cathode has smaller grain size and high grain density [23].
As seen in Fig 3.2, thin-film SOFC under fast initial heating rate showed larger YSZ surface grains and lower grain density, resulting in slowed oxygen reduction reaction at cathode interface. Significantly increased faradaic area-specific resistance at low frequency range of 10 Hz ~ 5 X 10⁴ Hz is parallel to this consideration.
As the initial heating rate increases from 10 ˚Cmin-1 to 50 ˚Cmin-1, the ohmic area- specific resistance decreses from 1.75 Ωcm2 to 1.26 Ωcm2. A little lower ohmic area- specific resistance may come from the larger grains in YSZ thin film electrolyte.
According to Peters et al., the ionic conductivity of YSZ thin film increases with its grain size, and converges to the bulk polycrystalline YSZ level at above 700 nm of
grain size [24]. Thus, grain growth at faster initial heating rate can cause the increased ionic conductivity of YSZ electrolyte.
Fig 3.2 Surface morphologies of yttria-stabilized zirconia electrolyte initially heated by (a)10 ˚Cmin-1, (b)30 ˚Cmin-1 and (c)50 ˚Cmin-1 obtained by field-emission
scanning electron microscopy
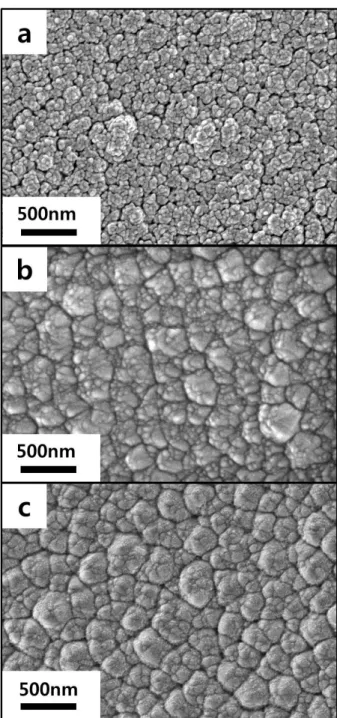
Micro-morphologies of Pt cathode surface initially heated by 10 ˚Cmin-1, 30 ˚Cmin-
1, and 50 ˚Cmin-1 obtained by FESEM are shown in Fig 3.3. And Fig 3.4 shows the binary images of Fig 3.3 processed by ImageJ software. Thin films deposited by physical vapor deposition methods such as sputtering strongly tend to have similar structure to the substrates, because of epitaxial and columnar tendency of film growth.
In this respect, Pt cathodes show analogous surface morphogies with YSZ electrolyte surfaces, having larger Pt clusters at faster initial heating rate, as seen in Fig 3.3.
Electrochemical reaction in cathode interface occurs where reactant gas, electrolyte and electrode catalyst are in contact, which is called as triple phase boundary. Wang et al. reported that Pt thin films exposed at high temperature range of 300 ˚C ~ 600 ˚C show significant morphology change by thermal agglomeration of Pt particles and loose triple phase boundary [25]. As Pt particle agglomerates and Pt cluster grows, triple phase boundary would be reduced and cathodic reaction would be slowed. Thus, larger Pt cluster at faster initial heating rate may be another important reason for increased faradaic area-specific resistance at low frequency range (10 Hz ~ 5 X 10⁴ Hz).
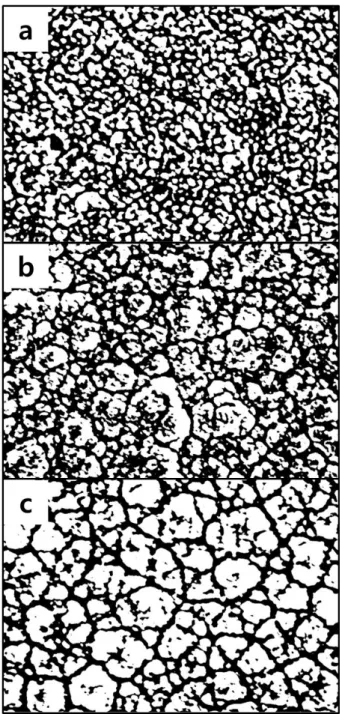
As seen in the binary images in Fig 3.4, surface porosity is lower at the faster initially heated Pt cathode. Calculated porosities of Pt cathode surfaces initially heated by 10 ˚Cmin-1, 30 ˚Cmin-1, and 50 ˚Cmin-1 are 53.41 %, 51.24 %, and 39.80 %, respectively. Reduced cathode porosity might have caused the increase of faradaic area-specific resistance at the lowest frequency range below 10 Hz. Cathode porosity is a critical structural property which directly affects concentration polarization of SOFC, especially when the cathode is air-breating.
Ohmic area-specific resistance of thin-film SOFC is sensitively affected by current
collection resistance as well as ionic conductivity of electrolyte, because of sheet resistance of high aspect ratio of thin film electrode [26]. In this study, the influence of current collection resistance is much significant because cathode current collection is utilized by tip-contacting. Agglomerated Pt particles and large Pt clusters extends electronic conduction path. Therefore, slightly reduced ohmic area-specific resistance at fast initial heating rate was considerably followed by larger Pt clusters of cathode as well as increased ionic conductivity of YSZ electrolyte.
Fig 3.3 Surface morphologies of Pt cathode of thin-film solid oxide fuel cells initially heated by (a)10 ˚Cmin-1, (b)30 ˚Cmin-1 and (c)50 ˚Cmin-1 obtained by field-emission
scanning electron microscopy
Fig 3.4 Binary images of surface morphologies of Pt cathodes of thin-film solid oxide fuel cells initially heated by (a)10 ˚Cmin-1, (b)30 ˚Cmin-1 and
(c)50 ˚Cmin-1 processed by ImageJ software
3.2 Effect of initial heating rate on annealed-electrolyte cells
3.2.1 Annealing YSZ electrolyte
Galinski et al. reported that thin-film stability and interfacial adhesion energy are higher at the interface between crystalline film and crystalline film than the interface between amorphous film and crystalline film [27]. Thermo-mechanical stability of interface is sensitively affected by adhesion energy. In this study, cathode reaction takes place at the interface between YSZ electrolyte thin film and Pt cathode thin film.
Pt thin film deposited by sputtering has fully crystalline structure of face-centered cubic [28]. However, YSZ thin film deposited by reactive sputtering at room temperature is known to be amorphous-crystalline biphasic structure according to previous research [29]. Actually, as-deposited YSZ electrolyte thin film used in this experiment shows low crystallinity, as seen in the Fig 3.5 of XRD result with red line.
According to the research of Jankowski et al., high-crystalline cubic YSZ thin film can be achieved by high-substrate-temperature sputtering method [30]. In this study, nevertheless, YSZ electrolyte thin film is deposited on Pt anode thin film. Thus high- substrate-temperature sputtering of YSZ should cause thermal agglomeration and following structural degradation of Pt anode thin film. Therefore YSZ electrolyte thin film must be deposited by room-temperature sputtering, inevitably. As a result, the interface between low-crystalline YSZ electrolyte thin film and fully crystalline Pt cathode thin film would be less stable than crystalline film and crystalline film.
In order to increase the crystallinity of YSZ electrolyte thin film, AAO-Pt anode- YSZ electrolyte assembly was annealed at 400 ˚C. XRD result of annealed YSZ thin
Pt cathode thin film was deposited after annealing process to prevent thermal agglomeration, and annealed-electrolyte cell was successfully fabricated. With high- crystalline YSZ electrolyte thin film, enhanced interfacial stability at the interface between annealed YSZ electrolyte thin film and Pt cathode thin film is expected.
Fig 3.6 shows the three-dimensional morphologies of as-deposited and annealed YSZ thin films obtained by AFM technique. Crystal growth was observed at the surface of annealed YSZ thin film. Average surface roughness of as-deposited and annealed YSZ are estimated by 4.62 nm and 4.87 nm, respectively. Though crystallinity and surface morphology were changed, surface roughness does not differ from each other.
Fig 3.5 X-ray diffraction results of annealed and as-deposited YSZ thin films
Fig 3.6 Three-dimensional surface morphologies of as-deposited and annealed YSZ thin films obtained by atomic forced microscopy
3.2.2 Performance variation of annealed-electrolyte cells
In order to examine the effect of annealing YSZ electrolyte, electrochemical performance of fabricated annealed-electrolyte thin-film SOFCs were measured. Fig 3.7 shows the electrochemical impedance spectra of annealed-electrolyte cells initially heated by 10 ˚Cmin-1 and 50 ˚Cmin-1, respectively. Numerical numbers of each area-specific resistance were obtained by equivalent-circuit fitting, and the results are shown in Table 3.2. Ohmic area-specific resistances were measured by 1.10 Ωcm2, 1.13 Ωcm2 for 10 ˚Cmin-1 and 50 ˚Cmin-1, which are lower than non- annealed cells. Faradaic area-specific resistances from the semi-circle (time constant 5 X 10⁵ Hz-1) at the high frequency range are 1.07 Ωcm2 for both 10 ˚Cmin-1 and 50
˚Cmin-1 initially heated cells, which are slightly increased compared to non-annealed cells. Sizes of semi-circles at the low frequency range of 2 Hz ~ 5 X 10⁴ Hz were estimated by 4.00 Ωcm2 for 10 ˚Cmin-1 and 5.40 Ωcm2 for 50 ˚Cmin-1 heated cell.
Low-frequency faradaic area-specific resistances are quite reduced, especially at 50
˚Cmin-1 initially heated cell compared to non-annealed cells, and the ratio of increase when fast initial heating rate was imposed is also significantly decreased.
10 ˚Cmin-1 initially heated cell shows one semi-circle at the low-frequency range of 10 Hz ~ 5 X 10⁴ Hz, and 50 ˚Cmin-1 heated cell shows two semi-circles. Time constants for the semi-circle at the frequency range of 10 Hz ~ 5 X 10⁴ Hz are estimated by near 350 Hz-1 for both 10 ˚Cmin-1 and 50 ˚Cmin-1 initially heated cells.
This indicates that there is no additional semi-circle at far lower frequency range below 10 Hz at the electrochemical impedance spectra of 10 ˚Cmin-1 initially heated cell. This means that the faradaic area-specific resistance from mass transfer only
appears at the electrochemical impedance spectra of 50 ˚Cmin-1 initially heated cell.
By setting the time constant of 400 Hz-1 for the semi-circle at the frequency range of 10 Hz ~ 5 X 10⁴ Hz, the semi-circle sizes were calculated by 4.00 Ωcm2 for 10 ˚Cmin-
1, and 4.91 Ωcm2 for 50 ˚Cmin-1 initially heated cell. And the faradaic area-specific resistance of the lowest frequency range below 10 Hz was estimated by 0.49 Ωcm2 for 50 ˚Cmin-1 heated cell.
High-frequency semi-circles (time constant 5 X 10⁵ Hz-1) were larger with annealed-electrolyte cells compared to non-annealed cells, considering increase of anodic reaction polarization. Annealing process was conducted with the assembly of AAO substrate-Pt anode-YSZ electrolyte. Thus thermal agglomeration and degradation of film structure could be occurred at Pt anode thin film, and cause the loss of triple phase boundary at anode interface. Though Pt anode layer is protected by AAO substrate and YSZ electrolyte, direct annealing of the assembly may apply thermal impact to Pt anode thin film. However, the change of anodic faradaic area- specific resistance does not give significant effect to whole cell impedance, as well as ohmic area-specific resistance. And the degradation of anodic reaction polarization can be simply prevented by utilizing cermet anode materials such as nickel-YSZ, which are widely used in SOFC.
Rapid start-up considerably causes the mass transfer area-specific resistance at 50
˚Cmin-1 initially heated cell. Non-uniform temperature distribution of cell can be occurred because the temperature rise from room temperature to the operating temperature of 450 ˚C had been conducted within only 9 minutes, which is significantly fast start-up. Besides, hydrogen gas input at room temperature aggravates the non-uniform distribution of temperature. Gas pressure and diffusion
coefficient are strongly dependent on temperature, thus non-uniformity of temperature causes unwanted-directional gas convection or diffusion, resulting in decrease of mass transfer rate at reaction interface, especially with air-breathing electrode. Accordingly, small concentration polarization would appear at the electrochemical impedance spectra measured just after rapid start-up. Non-annealed cells are also considered to be affected by this effect from non-uniform temperature distribution.
Fig 3.7 Electrochemical impedance spectra of annealed-electrolyte thin-film solid oxide fuel cells initially heated by 10 ˚Cmin-1 and 50 ˚Cmin-1
Table 3.2 Equivalent-circuit fitted area-spectific resistances of electrochemical impedance spectra of annealed-electrolyte thin-film solid oxide fuel cells initially
heated by 10 ˚Cmin-1 and 50 ˚Cmin-1. Time constants of faradaic area-specific resistance are specified in parenthesis
3.2.3 Surface Morphology variation of annealed-electrolyte cells
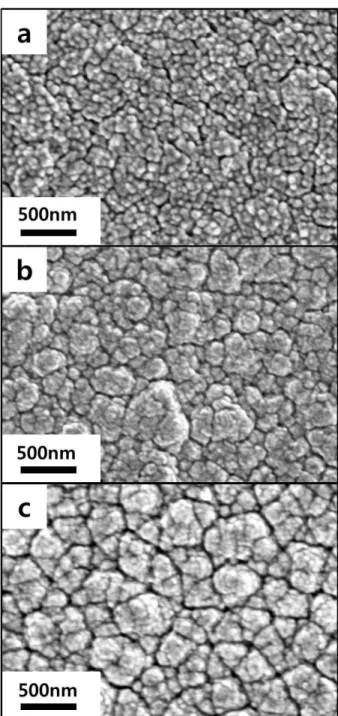
Fig 3.8 shows the surface morphologies of annealed YSZ electrolyte initially heated by 10 ˚Cmin-1 and 50 ˚Cmin-1 obtained by FESEM. Surface morphologies of both YSZ electrolytes are almost identical, having similar grain sizes and distributions. Surface morphologies of Pt cathodes of annealed-electrolyte cells are shown in Fig 3.9. Like annealed YSZ electrolyte surfaces, there is no morphological variation between 10 ˚Cmin-1 and 50 ˚Cmin-1 initially heated cells. Binary images of Fig 3.9 processed by ImageJ software are shown in Fig 3.10. As expected at the similar morphologies in Fig 3.9, there is nealy no loss of triple phase boundary. And estimated surface porosities are also similar to each other, indicating that mass transfer impedance occurred at rapidly-started cell is not caused by morphological change of cathode. It is expected that enhanced interfacial stability by annealing YSZ electrolyte suppressed the YSZ surface grain growth and Pt cluster growth. Therefore faradaic area-specific resistance from cathodic electrochemical reaction is not critically increased by rapid start-up.
Fig 3.8 Surface morphologies of YSZ electrolytes of annealed-electrolyte cells initially heated by (a)10 ˚Cmin-1 and (b)50 ˚Cmin-1 obtained by field-emission
scanning electron microscopy
Fig 3.9 Surface morphologies of Pt cathodes of annealed-electrolyte cells initially heated by (a)10 ˚Cmin-1 and (b)50 ˚Cmin-1 obtained by field-emission scanning
electron microscopy
Fig 3.10 Binary images of Pt cathode surface microphologies of annealed-electrolyte cells initially heated by (a)10 ˚Cmin-1 and (b)50 ˚Cmin-1 processed by ImageJ
software
4. Conclusion
In this research, electrochemical properties of thin-film solid oxide fuel cells varied by three initial heating rates were studied. By searching morphological variations of YSZ electrolyte and Pt cathode thin films, the influence of rapid start-up to the electrochemical impedance was examined. Thin-film solid oxide fuel cell imposed by rapid start-up undergoes grain growth of YSZ electrolyte surface, and Pt cluster growth of cathode. As a result, faradaic area-specific resistance from cathodic reaction significantly increases. However, by annealing YSZ electrolyte before deposition of Pt cathode thin film, the crystallinity of YSZ can be increased and YSZ grain growth by fast initial heating can also be suppressed. Agglomeration of Pt particle by rapid start-up is also alleviated with enhanced crystallinity of adjacent YSZ electrolyte thin film, resulting in little loss of triple phase boundary at the cathode interface. In conclusion, rapid start-up of thin-film solid oxide fuel cell causes significant increase of cathodic faradaic impedance. And the degradation can be suppressed by annealing YSZ electrolyte and increasing YSZ crystallinity.
References
[1] R. O'Hayre, S.-W. Cha, W. Colella, F. B. Prinz, Fuel cell fundamentals, Wiley (2009).
[2] B.C.H. Steele, A. Heinzel, Materials for fuel-cell technologies, Nature 414 (2001) 345.
[3] S.C. Singhal, Advances in solid oxide fuel cell technology, Solid State Ionics 135 (2000) 305.
[4] X. Hou, O. Marin-Flores, B.W. Kwon, J. Kim, M.G. Norton, S. Ha, Gasoline- fueled solid oxide fuel cell with high power density, Journal of Power Sources 268 (2014) 546.
[5] Y. Takagi, B.-K. Lai, K. Kerman, S. Ramanathan, Low temperature thin film solid oxide fuel cells with nanoporous ruthenium anodes for direct methane operation, Energy and Environmental Science 4 (2011) 3473.
[6] T.H. Shin, S. Ida, T. Ishihara, Doped CeO2-LaFeO3 composite oxides as an active anode for direct hydrocarbon-type solid oxide fuel cells, Journal of the American Chemical Society 133 (2011) 19399.
[7] W. Bujalski, C.M. Dikwal, K. Kendall, Cycling of three solid oxide fuel cell types, Journal of Power Sources 171 (2007) 96.
[8] I.P. Kilbride, Preparation and properties of small diameter tubular solid oxide fuel cells for rapid start-up, Journal of Power Sources 61 (1996) 167.
[9] T. Yamaguchi, S. Shimizu, T. Suzuki, Y. Fujishiro, M. Awano, Evaluation of extruded cathode honeycomb monolith-supported SOFC under rapid start-up operation, Electrochimica Acta 54 (2009) 1478.
[10] J.-H. Lee, H. Kim, S.M. Kim, T.-W. Noh, H.-Y. Jung, H.-Y. Lim, H.-G. Jung, J.-W. Son, H.-R. Kim, B.-K. Kim, H.-J. Je, J.-C. Lee, H. Song, H.-W. Lee, Effect of elastic network of ceramic fillers on thermal cycle stability of a solid oxide fuel cell stack, Advanced Energy Materials 2 (2012) 461.
[11] E.D. Wachsman, K.T. Lee, Lowering the temperature of solid oxide fuel cells, Science 334 (2011) 935.
[12] C. Xia, M. Liu, Microstructures, conductivities, and electrochemical properties of Ce0.9Gd0.1O2 and GDC-Ni anodes for low-temperature SOFCs, Solid State Ionics 153 (2002) 423.
[13] Y. Leng, S. Chan, S. Jiang, K. Khor, Low-temperature SOFC with thin film GDC electrolyte prepared in situ by solid-state reaction, Solid State Ionics 170 (2004) 9.
[14] C. Ding, T. Hashida, High performance anode-supported solid oxide fuel cells based on thin-film electrolyte and nanostructured anode, Energy and
Environmental Science 3 (2010) 1729.
[15] H.-S. Noh, K.J. Yoon, B.-K. Kim, H.-J. Je, H.-W. Lee, J.-H. Lee, J.-W. Son, Thermo-mechanical stability of multi-scale-architectured thin-film-based solid oxide fuel cells assessed by thermal cycling tests, Journal of Power Sources 249 (2014) 125.
[16] H.-S. Noh, K.J. Yoon, B.-K. Kim, H.-J. Je, H.-W. Lee, J.-H. Lee, J.-W. Son, The potential and challenged of thin-film electrolyte and nanostructured electrode for yttria-stabilized zirconia-base anode-supported silid oxide fuel cells, Journal of Power Sources 247 (2014) 105.
[17] W.G. Bessler, Gas concentration impedance of solid oxide fuel cell anodes I.
Stagnation point flow geometry, Journal of the Electrochemical Society 153 (2006) A1492.
[18] W.G. Bessler, S. Gewies, Gas concentration impedance of solid oxide fuel cell anodes II. Channel geometry, Journal of the Electrochemical Society 154 (2007) B548.
[19] A. M. Hussain, J.V.T. Høgh, T. Jacobsen, N. Bonanos, Nickel-ceria infiltrated Nb-doped SrTiO3 for low temperature SOFC anodes and analysis on gas diffusion impedance International Journal of Hydrogen Energy 37 (2012) 4309.
[20] T.P. Holme, R. Pornprasertsuk, F.B. Prinz, Interpretation of low temperature solid oxide fuel cell electrochemical impedance spectra, Journal of the Electrochemical Society 157 (2010) B64.
[21] I.-W. Chen, X.-H Wang, Sintering dense nanocrystalline ceramics without final-stage grain growth, Nature 404 (2000) 6.
[22] R. S. Averback, H.J. Höfler, H. Hahn, J. C. Logas, Sintering and grain growth in nanocrystalline ceramics, Nanostructured Materials 1 (1992) 173.
[23] J.H. Shim, J.S. Park, T.P. Holme, K. Crabb, W. Lee, Y.B. Kim, X. Tian, T.M.
Gür, F.B. Prinz, Enhanced oxygen exchange and incorporation at surface grain boundaries on an oxide ion conductor, Acta Materialia 60 (2012) 1.
[24] C. Peters, A. Weber, B. Butz, D. Gerthsen, E. Ivers-Tiffée, Grain-size effects in YSZ thin-film electrolytes, Journal of the American Ceramic Society 92 (2009) 2017.
[25] X. Wang, H. Huang, T. Holme, X. Tian, F.B. Prinz, Thermal stabilities of nanoporous metallic electrodes at elevated temperatures, Journal of Power Sources 175 (2008) 75.
[26] J. Park, I. Chang, J.Y. Paek, S. Ji, W. Lee, S.W. Cha, J.-M. Lee, Fabrication of the large area thin-film solid oxide fuel cells, CIRP Annals - Manufacturing Technology 63 (2014) 513.
[27] H. Galinski, T. Ryll, P. Elser, J.L.M. Rupp, a. Bieberle-Hütter, L.J. Gauckler, Agglomeration of Pt thin films on dielectric substrates, Physical Review B 82 (2010) 235415.
[28] I. Chang, S. Woo, M.H. Lee, J.H. Shim, Y. Piao, S.W. Cha, Characterization of porous Pt films deposited via sputtering, Applied Surface Science 282 (2013) 463.
[29] R. Frison, S. Heiroth, J.L.M. Rupp, K. Conder, E.J. Barthazy, E. Müller, M.
Horisberger, M. Döbeli, L.J. Gauckler, Crystallization of 8 mol% yttria- stabilized zirconia thin-films deposited by RF-sputtering, Solid State Ionics 232 (2013) 29.
[30] A. F. Jankowski, J.P. Hayes, Reactive sputter deposition of yttria-stabilized zirconia, Surface and Coatings Technology 76-77 (1995) 126.
국문초록
초기 가열 속도가 박막 고체산화물 연료전지에 끼치는 영향
강 성 민 기계항공공학부 대학원 서울대학교
본 논문은 초기 가열 속도가 박막 고체산화물 연료전지의 전기화학적 특성에 끼치는 영향에 대한 연구이다. 나노 기공을 가지는 양극 산화 알루미늄 기판을 기계적 지지체로 사용하여 스퍼터링 박막 증착 기법으로 박막 고체산화물 연료전지를
제작하였고, 각 단위전지는 10 ˚Cmin-1, 30 ˚Cmin-1, 50 ˚Cmin-1 의 세 가지 초기 가열 속도를 가하여 상온에서 작동 온도인 450 ˚C 까지 온도가 올라간 후 전기화학적 특성이 측정되었다. 초기 가열 속도에 따라 yttria-stabilized zirconia 전해질 박막 표면의 grain 의 크기가 다르게 나타났다. 10 ˚Cmin-1의 초기 가열 속도가 가해진 단위전지의 경우 13.09 nm, 30 ˚Cmin-1 의 초기 가열 속도가 가해진 경우에 25.92
nm, 그리고 50 ˚Cmin-1의 가장 빠른 초기 가열 속도가 가해진 경우에
89.87 nm 의 평균 grain 크기가 측정되었다. 백금 공기극 표면의 Pt
cluster 의 크기 또한 전해질 표면과 비슷하게 빠른 가열 속도에서
커지는 현상이 나타났고, 그에 따라 공기극 계면의 porosity 와 triple
phase boundary 가 감소하였다. 단위전지의 패러데이 임피던스가 10
˚Cmin-1 의 초기 가열과 비교하여 50 ˚Cmin-1 의 빠른 초기 가열
속도를 겪는 경우 두 배 가까이 상승하여 성능이 대폭 감소하였다.
전해질을 열처리하여 결정성을 높인 박막 고체산화물 연료전지를 제작하였고, 빠른 초기 가열을 가하였음에도 불구하고 yttria-stabilized
zirconia 전해질 박막 표면의 grain 성장과 백금 공기극의 Pt cluster 의
성장을 억제할 수 있었다. 그리고 패러데이 임피던스의 증가 또한 크게 감소시킬 수 있었다.
주요어 : 고체산화물 연료전지, 박막, 전해질, 초기 가열, grain boundary 학 번 : 2013-20638
![Table 1.1 Fuel cell types [1]](https://thumb-ap.123doks.com/thumbv2/123dokinfo/11752101.0/11.772.107.671.350.607/table-1-1-fuel-cell-types-1.webp)
![Fig 1.1 Ionic conductivities of representative ceramic electrolytes [1]. Oxygen ionic conductivities are shown, except BYZ which has protonic conductivity](https://thumb-ap.123doks.com/thumbv2/123dokinfo/11752101.0/15.772.111.666.389.691/conductivities-representative-ceramic-electrolytes-oxygen-conductivities-protonic-conductivity.webp)