저작자표시-비영리-동일조건변경허락 2.0 대한민국 이용자는 아래의 조건을 따르는 경우에 한하여 자유롭게
l 이 저작물을 복제, 배포, 전송, 전시, 공연 및 방송할 수 있습니다. l 이차적 저작물을 작성할 수 있습니다.
다음과 같은 조건을 따라야 합니다:
l 귀하는, 이 저작물의 재이용이나 배포의 경우, 이 저작물에 적용된 이용허락조건 을 명확하게 나타내어야 합니다.
l 저작권자로부터 별도의 허가를 받으면 이러한 조건들은 적용되지 않습니다.
저작권법에 따른 이용자의 권리는 위의 내용에 의하여 영향을 받지 않습니다. 이것은 이용허락규약(Legal Code)을 이해하기 쉽게 요약한 것입니다.
Disclaimer
저작자표시. 귀하는 원저작자를 표시하여야 합니다.
비영리. 귀하는 이 저작물을 영리 목적으로 이용할 수 없습니다.
동일조건변경허락. 귀하가 이 저작물을 개작, 변형 또는 가공했을 경우 에는, 이 저작물과 동일한 이용허락조건하에서만 배포할 수 있습니다.
이학석사학위논문
Establishment and Characterization of 26 Human Pancreatic Cancer Cell Lines: Pathway Approach and Mutation Analysis Related to Drug
Reactivity
췌장암 유래 세포주 26 종의 수립과 특성 분석 : 약제 반응성과 연관된 신호 전달 체계적 접근과 돌연변이
분석
2020 년 8 월 서울대학교 대학원 협동과정 종양생물학 전공
김 재 현
Establishment and Characterization of 26 Human Pancreatic Adenocarcinoma Cell Lines:
Pathway Approach and Mutation Analysis Related to Drug Reactivity
Jae-Hyeon Kim
A Thesis Submitted in Partial Fulfillment of the Requirements for the Degree of Master of Science in Tumor Biology
at Seoul National University College of Medicine
June, 2019
Approved by Thesis Committee:
Professor Chairman
Professor Vice chairman
Professor
i
ABSTRACT
Jae-Hyeon Kim Major in Tumor Biology The Graduate School Seoul National University Pancreatic cancer is one of the most fatal malignancies, with a low survival rate of 9% for a patient's 5-year average survival rate.
Pancreatic cancer is difficult to elucidating mutational characteristics due to the high heterogeneity between tumors. We established 26 different pancreatic cancer cell lines and performed whole exome sequencing, RNA sequencing and western blotting to confirm the mutational properties and protein expression of each cell line and examine the anti-cancer drug sensitivity. KRAS mutations, known to be representative of pancreatic cancer, were found in codon 12 a total of in 22 of the 26 cell lines, and four cell line didn’t harbor KRAS mutations. Pancreatic cancer cell lines with the wild type KRAS displays good response to anti-cancer drugs, except for the SNU-3752 cell line, and protein expression and different genetic factors
ii
contribute to this difference. Other mutations in the KRAS wild-type cell lines were found to be related to signal transduction about composition and degradation of the extracellular matrix. High inter- tumor heterogeneity was observed in KRAS mutant cell lines in terms of anti-cancer drug differences and protein expression. For instance, a strong positive correlation between trametinib sensitivity and p-ERK 1/2 protein expression levels in KRAS mutant cell lines was confirmed.
HER2 over-expressing pancreatic cancer cell lines generally showed high resistance to anti-cancer drugs, and exhibited various results according to differences in genetic variations and expression of certain proteins. Based on these results, anti-cancer drug reactivity can be predicted by associating each mutant property and protein expression level.
Keywords: Pancreatic cancer, Drug sensitivity, Mutational characteristics
학번: 2017-22304
iii
CONTENTS
Abstract ... i
Contents ... iii
List of tables ... vi
List of figures ... viii
Introduction ...
1Material and methods
Establishment and maintenance of human pancreatic
cancer cell lines ...
4Cell growth properties ...
5Nucleic acid isolation and complementary DNA
synthesis ...
6DNA fingerprinting analysis using 15 Short Tandem
iv
Repeat (STR) loci and amelogenin marker...
6Drug sensitivity test and analyze ...
7Whole exome sequencing ...
8RNA sequencing and fusion gene analysis ...
9Protein isolation and western blotting ...
10Mutational signature analysis ...
12Mutation profiling and enriched pathway analysis ....
12Code availability ...
13Results
General characteristics of the cell lines ...
14Mutational landscape of
26 established pancreatic cancer ...
22Enriched pathways of
v
26 established pancreatic cancer cell lines ...
31Mutational signature of
26 established pancreatic cancer cell lines ...
35Anti-cancer reagents response with mutational contexts ...
38Western blottingof
26 established pancreatic cancer cell lines ...
43Fusion gene analysis of
26 established pancreatic cancer cell lines ...
46Discussion ...
48Acknowledgements ...
54References ...
55Abstracts in Korea ...
67vi
LIST OF TABLES
Table 1. Clinical characteristics of
26 established pancreatic cancer cell lines ... 17 Table 2. In vivo characteristics of
26 established pancreatic cancer cell lines ... 18 Table 3. DNA fingerprinting using 15 STR loci
and Amelogenin marker... 19 Table 4. Mutation list of
26 established pancreatic cancer cell lines ... 28 Table 5. Pathway associated with
26 established pancreatic cancer cell lines ... 33 Table 6. List of Anti-cancer drugs ... 41 Table 7. Summary of discovered fusion genes in
vii
26 established pancreatic cancer cell lines. ... 47
viii
LIST OF FIGURES
Figure 1. Phase-contrast microscope
of established 26 SNU pancreatic cancer cell lines ....
16Figure 2. Mycoplasma test by the 16s-rRNA--based
polymerase chain reaction ...
21Figure 3. Mutations of key genes in 26 established pancreatic
cancer. ...
27Figure 4. Mutational signature of 26 established pancreatic
cancer cell lines ...
37Figure 5. Pathway associated with mutations in 26 established
pancreatic cancer cell lines. ...
34Figure 6. Mapped data from drug sensitivity of 26 established
pancreatic cancer cell lines. ...
42Figure 7. Western blotting of 26 established pancreatic cancer
cell lines ...
451
1. Introduction
The pancreatic cancer (PA) is the seventh common cause of tumor- related mortality worldwide with a median survival rate of 6 months and the 5-year survival rate of less than 5% (1). Despite low incidences, pancreatic cancer is ranked to the highest mortality in 5-year survival rates (1,2). Advances in sequencing technology have enabled various omics analyses such as whole exome sequencing (WES), RNA sequencing, and reverse-phase protein lysate microarray (RPPA), which has allowed the discovery of mutations that can be considered characteristics of various carcinomas. Pancreatic cancer is known for its difficulty in initial diagnosis, rapid and aggressive local invasions, the potential for metastasis, and poor prognosis (3-5).
Histologically, most pancreatic cancers occur in exocrine pancreas, and 85% of the tumors were originate from the epithelial lining of the pancreatic duct. As a feature of the pancreas composed of both exocrine and endocrine structure, the configuration of the pancreas is complicated. Consequently, even with a surgical resection, the tumor
2
often proceeds with recurrences or local metastasis, which leads to a poor prognosis of pancreatic cancer patients. Another cause of poor prognosis is the heterogeneity of mutational characteristics in pancreatic cancer. The high rates of KRAS mutations (>80%), inactivation of the tumor suppressor genes TP53, SMAD4, and CDKN2A occur at rates of >30% (6-8). The prevalence of mutations involved in chromatin modification, DNA damage repair, and other mechanisms important for carcinogenesis is known to be less than 10%.
The cause of pancreatic cancer is also unclear. There are a significant number of KRAS mutations present in patients, but this is a consequential interpretation. Mutated KRAS does not affect alone in tumor progression (9,10). Along with mutated KRAS, inflammation in pancreas is essential for progression to carcinoma (10,11). In addition, it has been reported that activation of notch signaling has an effect on tumor development (12). Even though molecular classification of pancreatic cancer is significant to precise diagnosis, and it has not been studied with Korean patients’ cohorts. The pancreatic cancer cell line status established worldwide has 21 types in ATCC (https://www.atcc.org/), 10 types in DSMZ (https://www.dsmz.de/), 20
3
types in RIKEN cell bank (https://cell.brc.riken.jp/en/), and 3 types in
ECACC (https://www.phe-
culturecollections.org.uk/products/celllines/generalcell/). And the Korea Cell Line Bank (http://cellbank.snu.ac.kr) stores 18 types, including 4 types of overseas cell lines and 14 types established by itself. Therefore, we investigated the mutational characteristics of pancreatic cancer from newly established 26 pancreatic cancer cell lines through whole exome sequencing, RNA sequencing, and drug sensitivity assays. In addition, 26 established pancreatic cancer cell lines were divided into KRAS wild-type, mutated KRAS, and HER2 over-expressing with mutated KRAS according to the status of KRAS and HER2. Each group compared mutational characteristics and anti- cancer drug resistance.
4
2. Material and methods
2.1. Establishment and maintenance of human pancreatic cancer cell lines
Cell lines from pathologically proven pancreatic carcinomas were established. 22 pancreatic carcinoma samples are obtained from patients in Seoul national university hospital. 5 pancreatic cancer cell lines are derived from organoid culture system. Solid tumors were finely minced with scissors and dispersed into small aggregates by pipetting. Appropriate amounts of fine neoplastic tissue fragments were seeded into 25 cm 2 flasks. Most of the tumor cells were initially cultured in Opti-MEM I (Thermo Fisher Scientific, MA, USA) supplemented with 5% fetal bovine serum. Confined-area trypsinization or scraping method was used to attain a pure tumor cell population when stromal cells like mesothelial cells or fibroblasts grew in the initial culture. Established cell lines were sustained in RPMI 1640 medium with 10% fetal bovine serum and 1% (v/v) penicillin and streptomycin (10,000U/ml). Cultures were maintained in humidified
5
incubators at 37°C in an atmosphere of 5% CO2 and 95% air. The initial passage was assigned when substantial tumor cell growth was detected, and successive passages were given at sub-confluence after trypsinization. When one culture population contains both floating and adherent cells, floating cells were gathered by centrifuging the medium and dispersed by pipetting. Established cell lines were deposited to the Korean Cell Line Bank (Seoul, Korea)
2.2. Cell growth properties
At 70-80% of confluency, Cells were detached from a T75 flask with 2X trypsin. After centrifugation, the cells were re-suspended with a culture medium. Suspensions of 5×10⁴ to 2×10⁵ cells were seeded on 24 identical well of 96-well culture plates in 80 μL of complete culture medium and incubated in humidified incubators at 37°C in an atmosphere of 5% CO2 and 95% air. Since the first cell seeding, in every 24 hours of incubation, 10 μL of CellTiter-Glo® (Promega) was added to well of each seeded pancreatic cancer cells in triplicate. After 10 minutes adding CellTiter-Glo®, the optical density was measured at
6
fluorescence using Luminoskan Ascent™ (Thermo Fisher Scientific, MA, USA). The number of cells was counted at 24-hour intervals for at least 5 days. The morphology of cells grown in T-75-cm2 culture flasks was observed daily by phase-contrast microscopy. In addition, mycoplasma contamination was tested by the 16S-rRNA gene-based PCR amplification method using the e-Myco Mycoplasma PCR detection kit (Intron Biotechnology, Gyeonggi, Korea).
2.3. Nucleic acid isolation and complementary DNA synthesis
Genomic DNA was extracted from the cell lines using QIAamp DNA Mini Kit (Qiagen, Hilden, Germany) and RNA was extracted using the TRIzol (Life technologies, CA, USA) and RNeasy Plus Mini Kit (Qiagen, Hilden, Germany) according to the manufacturer’s protocol.
2.4. DNA fingerprinting analysis using 15 Short Tandem Repeat (STR) loci and amelogenin marker
The genomic DNA from each cell line was amplified using an
7
AmpFlSTR identifier polymerase chain reaction (PCR) amplification kit (Applied Biosystems, CA, USA). A single cycle of PCR amplified 15 short tandem repeat markers (CSF1PO, D2S1338, D3S1358, D5S818, D7S820, D8S1179, D13S317, D16S539, D18S51, D19S433, D21S11, FGA, TH01, TPOX and vWA) and an amelogenin gender- determining marker containing highly polymorphic microsatellite markers. Amplified PCR products were analyzed by an ABI 3500XL Genetic analyzer (Applied Biosystems, CA, USA).
2.5. Drug sensitivity test and analyze
Cell suspensions were prepared in the previously described. According to various growth rates, 2-8 x 10⁵ cells/mL were seeded on 96-well tissue culture plates in 80 μL of complete culture medium and incubated in humidified incubators at 37°C for 24 hours in an atmosphere of 5%
CO2 and 95% air. 18 Anti-cancer agents were serially diluted in DPBS and were then added to each well with a volume of 20 μL. After 72 hours of incubation, 10 μL of CellTiter-Glo® (Promega, WI, USA) was added to each well. After 20 minutes of incubation at 37°C, the optical
8
density was measured at fluorescence using Luminoskan Ascent™
(Thermo Fisher Scientific, MA, USA). To compare and analyze between established cell lines, calculates area under curve (AUC) using R program version 3.6.3 (R Foundation for Statistical Computing, Vienna, Austria) with various packages
2.6. Whole exome sequencing
Whole-exome capture was performed on all samples with the SureSelect Human All Exon V5 Kit (Agilent Technologies, Tokyo, Japan), using the Bravo automated liquid handler. The captured targets were subjected to sequencing using HiSeq 2500 (Illumina, San Diego, CA, USA) with the pair-end 100 bp read option for organoid samples and 200 bp read option for tissue materials. The sequence data were processed through an in-house pipeline. Briefly, paired-end sequences are firstly mapped to the human genome, where the reference sequence is UCSC assembly hg19 (original GRCh37 from NCBI, Feb. 2009) using the mapping program BWA (version 0.7.12), and generated a mapping result file in BAM format using BWA-MEM. Then, Picard-
9
tools (ver.1.130) were applied in order to remove PCR duplicates. The local realignment process is performed to locally realign reads with BAM files reducing those reads identically match to a position at start into a single one, using MarkDuplicates.jar, which requires reads to be sorted. By using Genome Analysis Toolkit, base quality score recalibration (BQSR) and local realignment around insertion, deletions (indels) were performed. Haplotype Caller of GATK (GATKv3.4.0) was used for variant genotyping for each sample based on the BAM file previously generated (SNP and short indels candidates are detected).
Those variants are annotated by SnpEff v4.1g, to vcf file format, filtering with dbSNP for the version of 142 and SNPs from the 1000 genome project. Then, SnpEff was applied to filter additional databases, including ESP6500, ClinVar, dbNSFP 2.9.
2.7. RNA sequencing and fusion gene analysis
Total RNA was isolated from cell lysate using TRIzol (Qiagen, Hilden, Germany) and Qiagen RNeasy kit (Qiagen, Hilden, Germany).
Sequencing libraries were prepared using the Illumina TruSeq stranded
10
total RNA library prep kit. Fifty-one million reads were obtained from the cell lysates. Following base-calling and alignment with the Tuxedo Suite, the rejected reads were analyzed using FusionMap, ChimeraScan, and Defuse with default parameters for RNA and alignment to GRCh37.72.
The fusion gene extracted from FusionMap and Defuse was sorted through fusionGDB, fusion gene annotation data base.
2.8. Protein isolation and western blotting
Cells were harvested with a cell scraper after washing with cold PBS.
Whole protein was extracted with EzRIPA buffer (ATTO Co., Tokyo, JAPAN) supplied with 1% protease inhibitor and 1% of phosphatase inhibitor. The protein concentration was calculated by Pierce™ BCA Protein Assay Kit (Thermo Fisher Scientific, MA, USA), Equal amounts of protein were loaded on 4%-15% Mini-PROTEAN TGX Precast Gels (BIO-RAD, Hercules, CA) and blotted at 50 V for 2 hours.
Proteins were transferred to a Trans-Blot Turbo Transfer Pack (BIO- RAD) using the Trans-Blot Turbo Transfer System V1.02 machine
11
(BIO-RAD) at 2.5 A and 25 V. The membrane was incubated in 1.5 % skim milk containing 0.5 % Tween 20 for an hour at room temperature.
Primary antibodies against KRAS (Abcam, Cambridge, UK) (1:500), EGFR (Cell Signaling Technology, Danvers, MA, USA) (1:1000), Phospho-EGFR-Tyr1068 (Cell Signaling Technology, Danvers, MA, USA) (1:1000), HER2 (Cell Signaling Technology, Danvers, MA, USA) (1:1000), ERK (Applied Biological Materials Inc., Richmond, BC, Canada) (1:1000), Phospho-ERK-Thr202/Tyr204 (Cell Signaling Technology, Danvers, MA, USA) (1:1000), PTEN (Cell Signaling Technology, Danvers, MA, USA) (1:1000), mTOR (Cell Signaling Technology, Danvers, MA, USA) (1:1000), Phospho-mTOR-Ser2448 (Cell Signaling Technology, Danvers, MA, USA) (1:1000), Akt (Cell Signaling Technology, Danvers, MA, USA) (1:1000), Phospho-Akt- Thr308 (Cell Signaling Technology, Danvers, MA, USA) (1:500), β- actin (Invitrogen, Carlsbad, CA, USA) (1:1000) were introduced to the membrane and incubated at room temperature for 1 hour. Peroxidase- conjugated mouse or rabbit IgG antibody (Jackson Immunoresearch, West Grove, PA, USA) (1:5000) was added as a secondary antibody and incubated at room temperature for 1 hour. After chemiluminescent working solution, SuperSignal™ West Pico PLUS (Thermo Fisher
12
Scientific, MA, USA), was decanted to the membrane. The membrane was exposed to Fuji RX film for 1-5 minutes.
2.9. Mutational signature analysis
The Analysis was performed using R program version 3.6.3 (R Foundation for Statistical Computing, Vienna, Austria) with various packages including dplyr, stringr, tidyr, MutationalPattern. The R package ‘MutationalPattern’ was also used to identify significant sub- networks of differentially mutated genes.
2.10. Mutation profiling and enriched pathway analysis
The Analysis was performed using R program version 3.6.3 (R Foundation for Statistical Computing, Vienna, Austria) with various packages including dplyr, rvest, stringr, tidyr, clusterProfiler, org.Hs.eg.db, ReactomePA. The R package ‘ReactomePA’ was also used to identify significant sub-networks of differentially mutated genes.
13
To identifying significant mutations,we searched for what was reported in ClinVar database (https://www.ncbi.nlm.nih.gov/clinvar/) for a given rs number. An indexing file was created by matching the gene defined in Cancer Gene Census (https://cancer.sanger.ac.uk/census) (13) and indexing its role in cancer. After that, we predicted the weight of each mutation and selected only those with significant influence.
2.11. Code availability
Computational pipelines for calling significant somatic mutations and procedurally explained instructions are available to the public repository (https://github.com/jh-HOS/panc-by-R.git).
14
3. Results
3.1. General characteristics of the cell lines
The clinical characteristic of the established cell lines is summarized in Table 1. Twenty-one cell lines were established from tumor tissues, and 5 cell line were derived from organoid cultures (Table 1). Morphology and growth pattern of most cell lines displayed an adherent polygonal shape. SNU-2822 and SNU-2913 cell lines showed fibroblast-like shape, and SNU-3375 had densely aggregated and round morphologies (Figure 1, Table 2). All cell lines were subjected to characteristic analysis after passaged at least 3 times. Growth rates were ranged from 22.6 to 119.5 hours. According to fifteen tetranucleotide repeat loci and Amelogen sex-determining markers, short tandem repeats (STR) fingerprinting, each marker was heterogeneously distributed and all newly established cell lines were not cross-contaminated (Table 3). All cell lines were confirmed to be free of contamination from mycoplasma (Figure 2). All cell lines introduced in this study including its molecular characterization and drug responses will be deposited to Korean Cell
15
Line Bank (http://cellbank.snu.ac.kr) at initial passages to be distributed to researchers worldwide.
16
Figure 1. Phase-contrast microscopy of 26 established pancreatic cancer cell lines. Phase-contrast microscopy of 26 pancreatic cancer cell lines. Scale bar in microscope of SNU-5177 represent 50 μm and all microscopy have same magnification.
17
Table 1. Clinical characteristics of 26 established pancreatic cancer cell lines
No. Cell line Sex Age Derived Origin
1 SNU-2729B1 M 46 Tissue
2 SNU-2822 M N.A. Tissue
3 SNU-2913 M N.A. Tissue
4 SNU-2918 F N.A. Tissue
5 SNU-2982-1 F N.A. Tissue
6 SNU-3139 M 78 Tissue
7 SNU-3294 M 66 Tissue
8 SNU-3375 M 55 Tissue
9 SNU-3573 M 49 Tissue
10 SNU-3608 M 76 Tissue
11 SNU-3615 M 77 Tissue
12 SNU-3752 F 70 Tissue
13 SNU-3923T M 69 Organoid
14 SNU-4208T F N.A. Organoid
15 SNU-4223 F 47 Tissue
16 SNU-4305T F N.A. Organoid
17 SNU-4340T F N.A. Organoid
18 SNU-4354T F N.A. Organoid
19 SNU-4405 F 61 Tissue
20 SNU-4482 M 65 Tissue
21 SNU-4492 F 80 Tissue
22 SNU-4525 M 56 Tissue
23 SNU-4733 M 61 Tissue
24 SNU-4771 M 73 Tissue
25 SNU-4866 M 67 Tissue
26 SNU-5177 M N.A. Tissue
18
Table 2. In vivo characteristics of 26 established pancreatic cancer cell lines
No. Cell line Growth Pattern Doubling
Time (hr) Cell Morphology
1 SNU-2729B1 Adherent 50.4 Polygonal
2 SNU-2822 Adherent 60.7 Fibroblast-like
3 SNU-2913 Adherent 22.6 Fibroblast-like/Polygonal
4 SNU-2918 Adherent 75 Oval
5 SNU-2982-1 Adherent 66 Polygonal
6 SNU-3139 Adherent 77.2 Polygonal
7 SNU-3294 Adherent 85.4 Polygonal
8 SNU-3375 Adherent 52.3 Round
9 SNU-3573 Adherent 67.6 Polygonal
10 SNU-3608 Adherent 59.5 Polygonal
11 SNU-3615 Adherent 68.4 Oval/Round
12 SNU-3752 Adherent 113 Polygonal/Round
13 SNU-3923T Adherent 80.4 Round
14 SNU-4208T Adherent 61.9 Round
15 SNU-4223 Adherent 79.3 Polygonal
16 SNU-4305T Adherent 45.1 Polygonal
17 SNU-4340T Adherent 85.1 Polygonal
18 SNU-4354T Adherent 73.2 Polygonal
19 SNU-4405 Adherent 119.5 Polygonal
20 SNU-4482 Adherent 48.6 Polygonal
21 SNU-4492 Adherent 37.9 Oval/Round
22 SNU-4525 Adherent 78.2 Oval
23 SNU-4733 Adherent 63.8 Polygonal
24 SNU-4771 Adherent 48.3 Polygonal
25 SNU-4866 Adherent 85.7 Polygonal
26 SNU-5177 Adherent 92.3 Polygonal
19
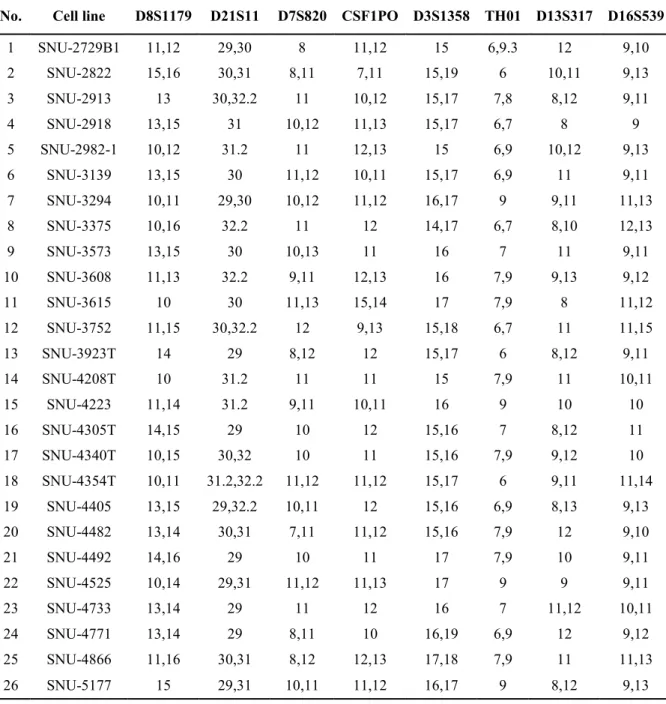
Table 3. DNA fingerprinting using 15 STR loci and Amelogenin marker
No. Cell line D8S1179 D21S11 D7S820 CSF1PO D3S1358 TH01 D13S317 D16S539
1 SNU-2729B1 11,12 29,30 8 11,12 15 6,9.3 12 9,10
2 SNU-2822 15,16 30,31 8,11 7,11 15,19 6 10,11 9,13
3 SNU-2913 13 30,32.2 11 10,12 15,17 7,8 8,12 9,11
4 SNU-2918 13,15 31 10,12 11,13 15,17 6,7 8 9
5 SNU-2982-1 10,12 31.2 11 12,13 15 6,9 10,12 9,13
6 SNU-3139 13,15 30 11,12 10,11 15,17 6,9 11 9,11
7 SNU-3294 10,11 29,30 10,12 11,12 16,17 9 9,11 11,13
8 SNU-3375 10,16 32.2 11 12 14,17 6,7 8,10 12,13
9 SNU-3573 13,15 30 10,13 11 16 7 11 9,11
10 SNU-3608 11,13 32.2 9,11 12,13 16 7,9 9,13 9,12
11 SNU-3615 10 30 11,13 15,14 17 7,9 8 11,12
12 SNU-3752 11,15 30,32.2 12 9,13 15,18 6,7 11 11,15
13 SNU-3923T 14 29 8,12 12 15,17 6 8,12 9,11
14 SNU-4208T 10 31.2 11 11 15 7,9 11 10,11
15 SNU-4223 11,14 31.2 9,11 10,11 16 9 10 10
16 SNU-4305T 14,15 29 10 12 15,16 7 8,12 11
17 SNU-4340T 10,15 30,32 10 11 15,16 7,9 9,12 10
18 SNU-4354T 10,11 31.2,32.2 11,12 11,12 15,17 6 9,11 11,14
19 SNU-4405 13,15 29,32.2 10,11 12 15,16 6,9 8,13 9,13
20 SNU-4482 13,14 30,31 7,11 11,12 15,16 7,9 12 9,10
21 SNU-4492 14,16 29 10 11 17 7,9 10 9,11
22 SNU-4525 10,14 29,31 11,12 11,13 17 9 9 9,11
23 SNU-4733 13,14 29 11 12 16 7 11,12 10,11
24 SNU-4771 13,14 29 8,11 10 16,19 6,9 12 9,12
25 SNU-4866 11,16 30,31 8,12 12,13 17,18 7,9 11 11,13
26 SNU-5177 15 29,31 10,11 11,12 16,17 9 8,12 9,13
20 Continued
No. Cell line D2S1338 D19S433 Vwa TPOX D18S51 Amelogenin D5S818 FGA
1 SNU-2729B1 24,25 14 17 8,11 16 X,Y 12 21
2 SNU-2822 18,24 14 14 8 14,15 X,Y 11,12 21,22
3 SNU-2913 17,18 13,16.2 16 8,11 19 X,Y 10,11,12 17,20
4 SNU-2918 20,23 12,13 16,18 8 14 X 11,12 22
5 SNU-2982-1 17,18 13 17 11 18 X 11 19,22
6 SNU-3139 19,20 13,15 17,18 8,11 19,22 X,Y 9,11 24,25
7 SNU-3294 20,21 13,14 16,19 8 13,15 X,Y 11,13 22,26
8 SNU-3375 18,23 14.2 17,18 11 15 X,Y 11,13 23,24
9 SNU-3573 18,19 13,16.2 17 8 14,20 X,Y 11 22,23
10 SNU-3608 18,23 14,14.2 14,16 9,11 13,15 X,Y 10 26
11 SNU-3615 22,23 13,15.2 18 8,9 12 X,Y 9,11 23,24
12 SNU-3752 19,24 14,14.2 17,18 8,9 18 X 9,10 19,28
13 SNU-3923T 20,27 14 18 8 14 X,Y 11 23
14 SNU-4208T 22,25 14,15.2 16 8 20 X 12 23
15 SNU-4223 17,23 12,14 17 8 16 X 11 24
16 SNU-4305T 23 13 17,18 8 16 X 11 24
17 SNU-4340T 23 14 17,18 8,11 17 X 9 24
18 SNU-4354T 17,18 14 17 11 14 X 10 20,25
19 SNU-4405 18,19 12,13 17,18 8 13 X 11 19,25
20 SNU-4482 23 13,13.2 18,19 8 16 X,Y 10,11 21,23
21 SNU-4492 18,23 13,14.2 18,19 8 15,16 X,Y 10,12 21,22
22 SNU-4525 18,23 13,15 18 8,10 14 X,Y 10,13 23,24
23 SNU-4733 22,23 13,14.2 18 8,11 15 X,Y 11,12 25
24 SNU-4771 22,24 13,14 14,16 11 19 X,Y 9,11 24
25 SNU-4866 17,23 13 16,18 11 13 X,Y 11,13 23,24
26 SNU-5177 19,25 14 18 8,11 13,15 X,Y 10,11 21.2,24
21
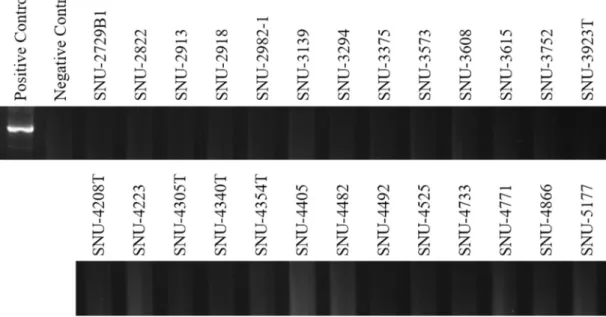
Figure 2. Mycoplasma test by the 16s-rRNA-gene-based polymerase chain reaction. PCR was performed to confirm the infection of mycoplasma. All cell lines were free of mycoplasma contamination.
22
3.2. Mutational landscape of 26 established pancreatic cancer
We sequenced cancer-related genes in 26 established pancreatic cancer cell lines. The mean read depth of exome sequencing was 100x. After filtering out non-significant variants, we identified 14,792 point mutations, including insertions and deletions, with at least 29 to 101 influential mutations in each cell line. First, we selected 5 representative genes of pancreatic cancer (KRAS, TP53, CDKN2A, BRAF, and MET), 7 SWI/SNP complexes and Chromatin remodeling (KDM6A, MLL3, PBRM1, ARID1A, ARID1B, and SMARCA4), 4 TGF-β signaling (SMAD4, TGFBR2, ACVR1B, and ACVR2A), 4 ROBO SLIT signaling (ROBO1, ROBO2, SLIT2, and MYCB2) and 5 DNA repair related genes (MLH1, MSH2, BRCA1, BRCA2, and MSH6) (6-8,14- 18). Forty-seven missense mutations, 10 highly effective splice site mutations, 3 nonsense mutations, 4 amino-acid modifications, 1 deletion frameshift are founded (Figure 3). A list of major mutations of KRAS, TP53, SMAD4, CDKN2A, BRAS genes are summarized in Table 4.
23
KRAS codon G12 mutations were found in 85% of our cell lines, which is in line with reported statistics (6,8,19). In the type of alteration, G12D (Gly to Asp) mutations were found more frequently with G12D: 13, G12V: 5, G12R: 4, and Wild Type KRAS: 4. The SNU-2822, SNU- 3752, SNU-4354T, and SNU-4223 without the KRAS mutation.
Specifically, a small number mutations were found in the CDKN2A (8 %), BRAF genes (4 %), which are known to have more than 30% of patients (6-8,20,21). It has been reported that Asn486_Pro490delinsThr, Thr491del BRAF mutation is found in KRAS wild type pancreatic cancer (22-24), and these deletions are located in the tyrosine kinase domain with functional effects. However, in the TP53 gene belonging to the same cell cycle regulation with CDKN2A, more than two-thirds of missense mutations were found (25-27) in our cell lines. There are 5 types of TP53 mutations: codon 31 (SNU-3608), codon 72 (SNU-2913, SNU-2918, SNU-3294, SNU-3139, SNU-3573 and SNU-3752), codon 175 (SNU-4492), codon 248 (SNU-3608) and codon 285 (SNU-3294) and are reported to be pathogenic in most cases. The TP53 mutation at codon 72 was first reported in 1990 (28), subsequent studies have reported that it is not pathogenic but affects the reactivity and side effects of paclitaxel and platinum-based anti-cancer drugs in gastric
24
cancer (29), breast cancer (30), and ovarian cancer (31,32). The remaining four mutations (codon 31, 175, 248, 285) are all reported to be pathogenic, and in particular, the codon 285 mutation is located in the DNA binding domain (33).
Genes related to the TGF-β signaling pathway are known to have mutations in 47% of pancreatic cancer patients. Especially SMAD4 loss is associated with metastatic prognosis of cancer (34,35). In our cell lines, mutations were found in SMAD4 and TGFBR2, and only benign mutations were found in ACVR1B and ACVR2A genes (filtered). The TGFBR2 codon 315 mutation of SNU-3294 was known to be benign, but has recently been associated with colorectal cancer (36). SMAD4 codon 171 mutation has not been reported to ClinVar database, but the codon 445 nonsense mutation found in SNU-3615 has been reported as a pathogenic mutation associated with juvenile polyposis in colorectal cancer (37).
Among DNA repair related genes, there were benign and nonsense mutations in BRCA1, BRCA2, and MSH6. The cell lines had two types of mutations in BRCA2. The codon 372 mutations of SNU-2913, SNU- 2918, SNU-2822, SNU-3294, SNU-4482, and SNU-3608 have been
25
reported as benign mutations (38), and the additional codon 2044 mutation of SNU-2822 has been reported as an uncertain significance in breast and ovarian cancer (39,40). Three types of BRCA1 mutations in codon 871, codon 1038, codon 1183 were found in eight cell lines (SNU-2822, SNU-2729B1, SNU-3139, SNU-3294, SNU-3752, SNU- 4405, SNU-4223 and SNU-4482), but these were all reported to have benign effects (41).
In MSH6, effective mutations were observed. The missense mutations in SNU-3615 and SNU-3294 have been reported to have a benign effect (42), and the frameshift by deletion in codon 958 found in SNU-4492 is pathogenic and has been shown to be associated with lynch syndrome, particularly in colorectal cancer (43,44). Specifically, the frameshift due to insertion of SNU-4482 and SNU-3752 has not been reported to ClinVar, but it has been reported by COSMIC database with genomic mutation ID: COSV52273912 (45). This mutation is located at the C- terminus rather than the functional domain of MSH6, so the impact as a frameshift mutation is not expected to critical. In the Chromatin remodeling and ROBO/SLIT pathways, the SNU-4733 cell lines exclusively harbored nonsense mutation of MYCBP2 (Glu2506*) with
26 an effective variant.
27
Figure 3. Mutations of key genes in 26 established pancreatic cancer.
The upper bar plots show non-silent single nucleotide variants and small insertions or deletions. The matrix shows alteration types: missense mutations (blue), frameshift (orange), nonsense mutation (yellow), protein-protein interactions related (sky), amino acid modifications (dark green), splice-site mutations (purple) and right bar plots show the proportion of mutations in the gene among all cell lines.
28
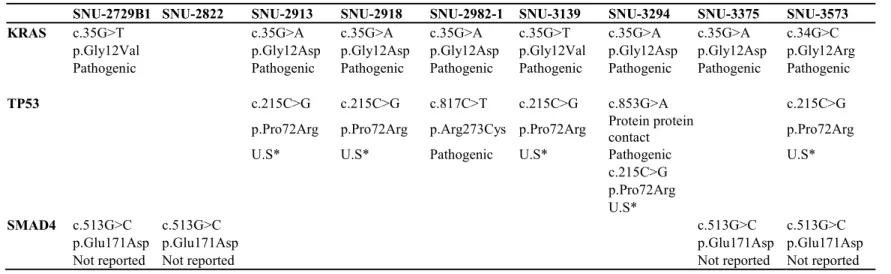
Table 4. Mutation list of 26 established pancreatic cancer cell lines.
SNU-2729B1 SNU-2822 SNU-2913 SNU-2918 SNU-2982-1 SNU-3139 SNU-3294 SNU-3375 SNU-3573 KRAS c.35G>T c.35G>A c.35G>A c.35G>A c.35G>T c.35G>A c.35G>A c.34G>C
p.Gly12Val p.Gly12Asp p.Gly12Asp p.Gly12Asp p.Gly12Val p.Gly12Asp p.Gly12Asp p.Gly12Arg Pathogenic Pathogenic Pathogenic Pathogenic Pathogenic Pathogenic Pathogenic Pathogenic
TP53 c.215C>G c.215C>G c.817C>T c.215C>G c.853G>A c.215C>G p.Pro72Arg p.Pro72Arg p.Arg273Cys p.Pro72Arg Protein protein
contact p.Pro72Arg
U.S* U.S* Pathogenic U.S* Pathogenic U.S*
c.215C>G p.Pro72Arg U.S*
SMAD4 c.513G>C c.513G>C c.513G>C c.513G>C
p.Glu171Asp p.Glu171Asp p.Glu171Asp p.Glu171Asp
Not reported Not reported Not reported Not reported
29 continued
SNU-3608 SNU-3615 SNU-3752 SNU-3923T SNU-4208T SNU-4305T SNU-4340T SNU-4354T KRAS c.34G>C c.34G>C c.35G>A c.35G>T c.35G>A c.35G>T
p.Gly12Arg p.Gly12Arg p.Gly12Asp p.Gly12Val p.Gly12Asp p.Gly12Val Pathogenic Pathogenic Pathogenic Pathogenic Pathogenic Pathogenic
TP53 c.743G>A c.215C>G c.380C>T c.722C>A c.475G>C c.659A>G c.524G>A p.Arg248Gln p.Pro72Arg p.Ser127Phe p.Ser241Tyr p.Ala159Pro p.Tyr220Cys p.Arg175His Pathogenic U.S* Not reported Not reported Not reported Pathogenic C.I.P*
c.91G>A c.215C>G c.215C>G
p.Val31Ile p.Pro72Arg p.Pro72Arg
U.S* U.S* U.S*
SMAD4 c.513G>C c.513G>C p.Glu171Asp p.Glu171Asp Not reported Not reported
CDKN2A c.804G>A
p.Trp268*
Not reported
BRAF c.1471_1473delACA
p.Thr491del Not reported
c.1457_1468delATGTGACAGCAC p.Asn486_Pro490delinsThr
Not reported
30 continued
SNU-4405 SNU-4482 SNU-4492 SNU-4525 SNU-4733 SNU-4771 SNU-4866 SNU-5177 KRAS c.35G>A c.35G>T c.35G>A c.35G>A c.34G>C c.35G>A c.35G>A c.35G>A
p.Gly12Asp p.Gly12Val p.Gly12Asp p.Gly12Asp p.Gly12Arg p.Gly12Asp p.Gly12Asp p.Gly12Asp Pathogenic Pathogenic Pathogenic Pathogenic Pathogenic Pathogenic Pathogenic Pathogenic
TP53 c.215C>G c.524G>A c.524G>A c.560-1G>T c.994-1G>A c.817C>T c.524G>A p.Pro72Arg p.Arg175His p.Arg175His Intron variant Intron variant p.Arg273Cys p.Arg175His U.S* C.I.P * C.I.P* Not reported Pathogenic Pathogenic C.I.P *
c.215C>G c.215C>G c.215C>G c.215C>G p.Pro72Arg p.Pro72Arg p.Pro72Arg p.Pro72Arg
U.S* U.S* U.S* U.S*
CDKN2A c.247C>T c.131dupA
p.His83Tyr p.Tyr44fs
Likely
pathogenic Not reported
SMAD4 c.513G>C p.Glu171Asp Not reported
(* C.I.P: Conflicting interpretations of pathogenicity, *U.S: Uncertain significance)
31
3.3. Enriched pathways of 26 established pancreatic cancer cell lines
Mutations were further analyzed for gene set enrichment analysis to find representative pathways that were mostly aberrated in the established pancreatic cancer cell lines. (Figure 4, Table 4-5). Overall, factors that were related to general disease were mostly affected, and therefore
‘Diseases of signal transduction’ had the highest count with low p-value.
One of the most disrupted pathway was ‘PI3K /AKT Signaling in Cancer’
(0.001<p) and Constitutive Signaling by Aberrant PI3K in Cancer (0.001<p). There have been many reports that associates the “abnormal activation of Akt/mTOR pathway in cancer” (46,47). Associated genes in our cohort were FGFR4, PIK3CD, ERBB3, IRS2, KIT, ERBB2, and PIK3R2, which were all connected to signal transduction of Akt/mTOR pathway. With similar gene sets, “Constitutive Signaling by Aberrant PI3K in Cancer” pathway includes FGFR4, PIK3CD, PIK3R2, ERBB3, IRS2, KIT, ERBB2, PIK3R2 and SRC which were related to downstream cascade of Akt/mTOR pathway. This suggested that newly established pancreatic cancer cell lines were generally affected by alteration of Akt/mTOR signaling pathway and thus further research is
32
essential. Next, we identified genes that Oncogenic MAPK signaling (0.001<p) as well as KRAS pathway (0.001<p) were altered at a high rate, which included NF1, MAP2K2, BRAF (48,49).
33
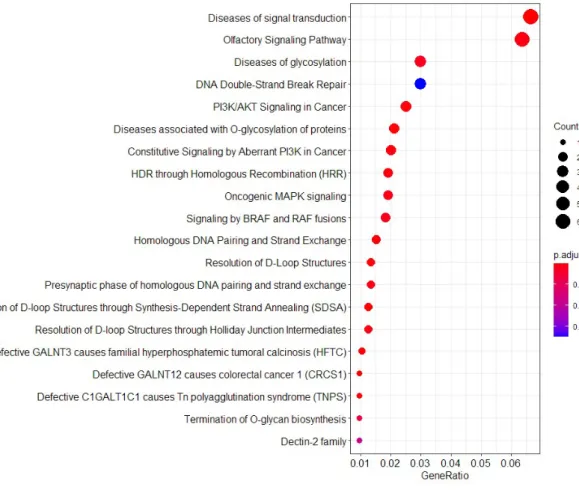
Table 5. Pathway associated with 26 established pancreatic cancer cell lines
Related Pathway Adjusted p value
Diseases of signal transduction 7.06E-05
Olfactory Signaling Pathway 0.000609944
Extracellular matrix organization 0.020561207
Diseases of glycosylation 0.001085179
DNA Double-Strand Break Repair 0.017567872
Degradation of the extracellular matrix 0.020561207
PI3K/AKT Signaling in Cancer 0.000373901
Negative regulation of the PI3K/AKT network 0.018037729
O-linked glycosylation 0.020561207
Diseases associated with O-glycosylation of proteins 7.06E-05 PI5P, PP2A and IER3 Regulate PI3K/AKT Signaling 0.018037729 Constitutive Signaling by Aberrant PI3K in Cancer 0.000609944 HDR through Homologous Recombination (HRR) 0.000412568
Oncogenic MAPK signaling 0.000770565
Signaling by BRAF and RAF fusions 0.001031236
34
Figure 4. Pathway associated with mutations in 26 established pancreatic cancer cell lines. Enriched pathway of mutations in 26 established pancreatic cancers. The size of the circle refers to the number of genes found in cell lines.
35
3.4. Mutational signature of 26 established pancreatic cancer cell lines
Accumulation of mutations in cancer constructs different combinations of mutation types. The types of mutations formed by similar causes are collectively referred to as signatures (50). Having, therefore, such a mutation signature can reflect a similar mutation accumulation. It can be considered as influenced by the same risk factor, and this was analyzed in connection with the mutation characteristics (51). COSMIC signatures 1 is predominance of C>T transition with the age of patient at time of cancer diagnosis. The underlying proposed biological mechanism is the spontaneous deamination of 5-methylcytosine (50), COSMIC signatures 2, 13, APOBEC enzymes enriched for C>T and C>G substitutions.
These are thought to arise from cytidine deaminase activity of the AID/APOBEC enzymes family. Both Signature 2 and Signature 13 are features with cytosine to uracil substitutions due to cytidine deaminases.
COSMIC signatures 3, 6 is related to Homologous recombination deficiency and Mismatch repair deficiency (52), COSMIC signatures 5, has a predominance of T>C substitutions with transcriptional strand bias.
Having the widest bar among the signatures displayed on each cell line
36
is considered to be the main cause of mutation in that cell line. Signature 5 is the most common in our cell line, Signature 5 contains mutations caused by errors during transcription, and it was frequently founded in most carcinomas (13).
37
Figure 5. Mutational signature of 26 established pancreatic cancer cell lines.
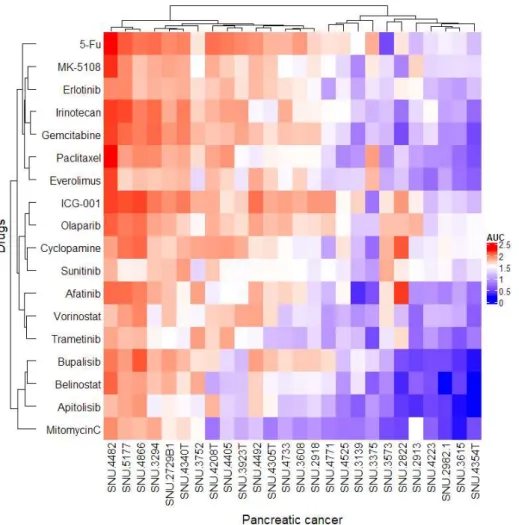
38 3.5. Anti-cancer reagents response with mutational contexts
As a first validation, the grouping of drugs based on their AUC values identified a diverse range of sensitivities across the cell lines, and 3 major sub-groups in accordance with KRAS mutation status were separated (Table 6, Figure 5). One group (SNU-2822, SNU-3752, SNU-4223, and SNU-4354T) displayed wild type KRAS. Another group (SNU-2729B1, SNU-2913, SNU-3139, SNU-3294, SNU-3615, SNU-4305T, SNU-4405, SNU-4525, SNU- 4733 and SNU-4866) exhibited mutated KRAS. The other group (SNU-3375, SNU-4208T, SNU-4340T, SNU- 4482, SNU-4492, SNU-4771, and SNU-5177) displayed mutated KRAS with HER2 over-expression.
The KRAS wild-type group has been shown to generally have a high sensitivity to anti-cancer drugs except SNU- 3752 cell lines. As a result of examining 12 genes specifically observed in wild type KRAS (BRAF, ERBB2, FGFR4, NF1, SPRED1, DUSP6, RREB1, GNAS, CTNNB1, JAK1, ATM, and PRSS1) (22), it was found that all
39
KRAS wild type cell lines had a pathogenic mutation in FGFR4 (Gly388Arg) except SNU-3752. In the SNU- 4354T cell line, there was a deletion in the tyrosine kinase domain of BRAF, which was previously reported (22).
In particular, SNU-2822 has low activity in the MAPK and Akt/mTOR pathways as much as more resistant to afatinib, sunitinib, erlotinib, and trametinib targeting RTK, EGFR, HER2, and its signaling proteins MEK1/2 than other cell lines. Therefore, it is thought that the tumor progression of SNU-2822 was induced through a non- canonical signaling pathway.
The KRAS mutant cell lines reflect the tumor heterogeneity of pancreatic cancer. Despite being a cell line that does not express HER2 protein, it shows various differences in reactivity for anti-cancer drugs. SNU-4866 is the most resistant to anti-cancer drugs in KRAS mutated cell lines. SNU-3294 and SNU-2729B1 also have similar resistance with SNU-4833, all of which are most sensitively response to trametinib, sunitinib, and erlotinib targeting EGFR, MEK1/2, and multiple receptor tyrosine kinases (RTKs). Therefore, the proliferation and replicating signals of these cell lines are expected to activate the non-canonical pathway by various RTKs.On the
40
other hand, it can be seen that the six cell lines (SNU-4525, SNU-3139, SNU-3573, SNU-2982-1, SNU-2913, and SNU-3615) with low anticancer drug resistance differ depending on the characteristics of each cell line.
HER2 over-expressing pancreatic cancer was reported as a lower survival rate than HER2 negative pancreatic cancer (53). Our HER2 over-expressing cell lines exhibit high anti-cancer drug resistance. SNU-4482 and SNU5177 have the highest resistance among all cell lines. Specifically, the expression of HER2 appears to have a great influence on the regulation of proliferation and replication, but the resistance to afatinib, a targeted inhibitor of EGFR and HER2, was shown to be different.
41 Table 6. List of Anti-cancer drugs
Names Target Effects
Everolimus Mammalian target of rapamycin (mTOR). Inhibition of mTORC1
Paclitaxel Tubulin Inhibition of mitotic spindle assembly, chromosome segregation, and cell division.
5-Fu Thymidylate synthase Interrupting synthesis of the pyrimidine, thymidine
Gemcitabine Act as pyrimidine nucleosides Competitive inhibition of DNA synthesis by masquerade as deoxycytidine triphosphate Irinotecan Topoisomerase I Inhibition of DNA replication and transcription
Mitomycin C Act as alkylating agent DNA crosslinking, guanine nucleoside alkylation in DNA Sunitinib Multi-targeted receptor tyrosine kinase (RTK) Reduces tumor vascularization and induces cancer cell apoptosis
Erlotinib Epidermal growth factor receptor (EGFR) Reversibly binding to the adenosine triphosphate (ATP) binding site of the receptor.
MK-5108 Aurora Kinase A Inhibition of mitotic spindle assembly
Bupalisib Pan-class I phosphoinositide 3-kinase (p110α/β/δ/γ) Inhibiting the production of the secondary messenger Apitolisib Pan-class I phosphoinositide 3-kinase (p110α/β/δ/γ), mTOR Inhibiting the production of the secondary messenger Vorinostat Histone deacetylases (HDAC) Accumulation of acetylated histones and proteins Belinostat Histone deacetylases (HDAC) Accumulation of acetylated histones and proteins Trametinib Mitogen-activated protein kinase kinase 1/2 (MEK1/2) Inhibition of MAPK pathway
Afatinib Epidermal growth factor receptor (EGFR), EGFR2 Decreasing phosphorylation between ErbB dimers, thus blocking the activity of downstream Cyclopamine Smoothened of sonic hedgehog (Shh) pathway Inactivation and interrupts of hedgehog signaling
ICG-001 CREB binding protein (CBP) Binding CREB-binding protein (CBP) and disruption of Wnt/β-catenin transcription Olaparib poly ADP ribose polymerase (PARP) Inhibition of single-strand DNA breaks repairs
42
Figure 6. Mapped data from drug sensitivity of 26 established pancreatic cancer cell lines. Area under curve (AUC) was calculated and presented to the heatmap. The higher AUC revealed higher resistance in anti-cancer drugs.
43
3.6. Western blotting of 26 established pancreatic cancer cell lines
Protein expression was confirmed with western blotting. PTEN, Akt, p- Akt, mTOR, p-mTOR was detected for activity of Akt/mTOR pathway, KRAS, EGFR, p-EGFR, HER2, ERK, p-ERK was detected for the RAS- MEK-ERF pathway. Differences in protein expression in cell lines are indicated by tumor heterogeneity. In particular, in terms of pathway, highly activated EGFR cell lines are likely to have high expression levels of the lower cascade, p-ERK, but are unreliable. Likewise, the activity of p-mTOR is to be induced by p-Akt, but this also discordant. Perhaps there is another pathway activation via the non-canonical signal activation occurs. Representatively, it can be confirmed that the expressions of p-EGFR and HER2 of SNU-4340T, SNU-4492, SNU- 4866, and SNU-2822 are not consistent with the activity of p-ERK and p-Akt.
Our KRAS wild-type cell lines have low activity of signaling proteins compared to other subgroups. This is prominent in the pattern of activation of p-EGFR, HER2, and p-mTOR by p-Akt.
44
Subgroups with KRAS mutated cell lines exhibit various inter-tumor heterogeneities representing pancreatic cancer. Among them, PTEN, an important tumor suppressor gene of the Akt/mTOR pathway, was expressed in four cell lines (SNU-2729B1, SNU-3139, SNU-4528, and SNU-4866), and showed significantly divergent resistance to everolimus, bupalisib, and apitolisib targeting the Akt/mTOR pathway. Only in this group, sensitivity to the MEK1/2 inhibitor trametinib appears to have a positive correlation with the expression level of phospho-ERK.
Unusually, Over-expressing HER2 cell lines were more frequently mutated rather than previous studies (6). The proportion is about 26% of 7 out of 26 cell lines, which is significantly higher than the reported percentage of 6%. This subgroup has higher activation of signaling proteins than the previous two groups. Since it has the expression of p- EGFR and HER2, the activity of the signal transduction proteins p-ERK and p-Akt and the basal expression level of mTOR are significantly higher.This is thought to be characteristic of cell lines with superior anti- cancer drug resistance.
45
Figure 7. Western blotting of 26 established pancreatic cancer cell lines.
46
3.7. Fusion gene analysis of 26 established pancreatic cancer cell lines
In order to collect more genetic mutations, fusion gene was sorted from RNA sequencing results to detect NRG1 protein fusion that activates Akt and ERK pathways by replacing KRAS in recently discovered KRAS wild type pancreatic cancer (54,55). For analysis, the genes and junction types of the fusion genes found using FusionGDB were confirmed. As a result, no effective fusion gene was found. However, because translocation occurs frequently in carcinoma, the fusion genes found for each cell line are summarized in Table 7.
47
Table 7. Summary of discovered fusion genes in established 26 pancreatic cancer cell lines.
Sample 5’end fusion 3’end fusion Fusion description 5’end fusion position 3’end fusion position
SNU-2729B1 STAT1 ACTB cancer,m2 2:191863388:- 7:5567269:-
SNU-2729B1 TNRC18 JAK1 oncogene,cancer,m2 7:5352605:- 1:65363274:-
SNU-2913 ALK ZNF587 oncogene,cancer,tumor,m2 2:29600117:- 19:58375744:+
SNU-3139 ACTB ANXA1 cancer,m5,exon-exon 7:5566787:- 9:75772570:+
SNU-3139 FN1 CMBL cancer 2:216250519:- 5:10279671:-
SNU-4305T ACTB GNE cancer,m3,exon-exon 7:5580307:- 9:36227455:-
SNU-4340T CNN2 SMAD3 cancer,exon-exon 19:1036999:+ 15:67482751:+
SNU-4425T ACTB ANXA1 cancer,m5,exon-exon 7:5566787:- 9:75772570:+
SNU-4208T ACTB DNAJC13 cancer,exon-exon 7:5580307:- 3:132153382:+
SNU-4354T ACTB MYOF cancer,m7,exon-exon 7:5580307:- 10:95211898:-
SNU-4354T AHNAK GATD1 N.A 11:62279338:- 11:767868:-
SNU-4405 ACTB ADAM9 oncogene,cancer,exon-exon 7:5580307:- 8:38959382:+
SNU-4405 RAC1 ANXA1 oncogene,cancer,exon-exon 7:6442151:+ 9:75772570:+
SNU-4482 S100A6 ITGB1 N.A 1:153507085:- 10:33276684:-
SNU-4492 ACTN4 METAP1 oncogene,exon-exon 19:39220784:+ 4:99943923:+
SNU-4733 ACTB F11R cancer,m3 7:5575497:- 1:160967770:-
SNU-4733 ACTB PDIA3 cancer,exon-exon 7:5566787:- 15:44038590:+
SNU-4866 ACTB NSD1 oncogene,cancer,tumor,exon-exon 7:5566787:- 5:176692728:+
SNU-4866 AKT2 TJAP1 oncogene,cancer,tumor 19:40736935:- 6:43472140:+
48
4. Discussion
Advances in sequencing have made it possible to find variants that can be considered characteristic of carcinomas. Pancreatic cancer is well- known for early and aggressive invasion, high metastatic potential and poor prognosis. As a feature of the pancreas composed of both exocrine and endocrine structure, the configuration of the pancreas is complicated.
Consequently, even with a surgical resection, the tumor often proceeds with recurrences or local metastasis, which leads to a poor prognosis.
Another cause of poor prognosis is the heterogeneity of mutational characteristics. The high rates of KRAS mutations (>80%), inactivation of the tumor suppressor genes TP53, SMAD4, and CDKN2A occur at rates of >30% (6-8). The prevalence of mutations involved in chromatin modification, DNA damage repair, and other mechanisms important for carcinogenesis is known to be less than 10%. Even though molecular classification of pancreatic cancer is significant to precise diagnosis, and it has not been studie