한경연 정책세미나
글로벌 금융위기의 영향과 대응방안
◆ 일 시: 2008년 10월 27일(월) 14:00~17:00
◆ 장 소: 전경련회관 3층 제2회의실
한 국 경 제 연 구 원
시 간 내 용
13:30~14:00
등 록14:00~14:10
(10분) ◈
인사말: 김종석(한국경제연구원 원장)
14:10~14:30 (20분)
◈
제1주제:
글로벌 금융위기 전개와 한국경제상황오석태
(씨티은행 이코노미스트 )
14:30~14:50 (20분)
◈
제2주제:
외환시장의 불안요인 점검과 대응방안안순권 (한국경제연구원 연구위원
)
14:50~15:10 (20분)
◈
제3주제:
금융시장의『시스템 리스크 』와
금융감독의 개선방향박기환 (국민대학교 경영대학 교수
)
15:10~15:20
(10분) ◈ Coffee Break
15:20~17:00 (100분)
◈
패널 토론: 금융위기가 우리경제에 미치는 영향과 바람직한 대응은?
∙ 사 회 자 :
허찬국(한국경제연구원 선임연구위원 )
∙ 토 론 자 :
박원암 (홍익대학교 경영대학 교수)
이종욱 (서울여자대학교 경제학과 교수)
조 만(KDI
국제정책대학원 교수)
주제발표자 3인 포함(가나다順)
∙ 청중 질문 및 답변
<프로그램>
제1주제
글로벌 금융위기 전개와 한국경제상황
오석태
(씨티은행 이코노미스트 )
See the Disclosure Appendix for the Analyst Certification and Other Disclosures.
글로벌 금융 위기 전개와 한국 경제 상황
오 석 태
한국씨티은행 이코노미스트 (02)2077-4014,
[email protected]
2008 년 10 월
2
미국 경제 전망
• 회사채 신용 스프레드의 급등 , 자금 시장의 혼란 등 신용 경색 현상은 이제 일반적인 경기 순환의 범주를 넘어서고 있다 . 금융 상황의 긴축 , 실물 경제의 침체 및 이로 인한 신용 긴축의 악화라는 악순환이 아직 계속되는 듯하다
• 극심한 신용 경색은 심각한 불황으로 이어질 것이며 , 경기 회복을 위해서는 금융 중개 기능의 재작동이 필수적이다 . 금융 시장이 어느 정도 작동을
재개한다는 가정 하에서 , 우리는 내년 미국 경제 성장률을 –0.8% 로 하향
조정하였다 . 마이너스 성장률이 올 3 분기부터 내년 2 분기까지 지속될 것으로 예상한다 . 특히 고용 및 소비의 약화가 심각할 것이다 .
• 인플레이션 압력의 급속한 약화는 투자 심리에 도움을 줄 수 있다 . 실제로 우리는 내년 명목 성장률이 1954 년 이래 최저일 것으로 예상한다 . 최근의 자산가격 폭락 , 금융 혼란 및 수요 위축을 고려할 때 인플레이션 상승이라는
“정책 실패” 가능성을 두려워하지 않는 과감한 통화 완화 정책을 펼칠 때이다 .
• 금융기관의 자금 조달 환경 개선 및 자기자본에 대한 시장의 확신이
회복되었다는 뚜렷한 신호가 없는 한 경기 회복 시점을 논하는 것은 너무
이른 듯하다 .
3
미국: 리먼브러더스 파산 이후의 TED Spread 동향
3-Mon. LIBOR and Treasury Yields -- Spreads to Expected Fed Funds Rate
-150 -100 -50 0 50 100 150 200 250 300 350 400
Jan-06 Jul-06 Jan-07 Jul-07 Jan-08 Jul-08
Basis Points
-150 -100 -50 0 50 100 150 200 250 300 350 400 Basis Points
Paribas suspe nds 3 hedge funds
Bear Stearns Rescue
Sources: Bloomberg and Citi
Spread between LIBOR and Expected Fed Funds Rate
Spread between Treasury Yields and Expected Fed Funds Rate
Lehman
Failure
4
미국 : 금융 상황 지수와 실물 경제의 관계
Financial Conditions and the Output Gap
-6 -5 -4 -3 -2 -1 0 1 2 3 4
1985 1987 1989 1991 1993 1995 1997 1999 2001 2003 2005 2007 2009
-6 -4 -2 0 2 4
Financial Conditions (St.Dev.) Output Gap (% of GDP)
F
Shading indicates recessions. Source: BEA and Citi
5
미국 : 부동산 및 주식 가격 하락이 소비에 미칠 악영향
소득 대비 부동산 및 주식 가치 변동 비율
-50 -40 -30 -20 -10 0 10 20 30 40 50 60
80 82 84 86 88 90 92 94 96 98 00 02 04 06 08
-50 -40 -30 -20 -10 0 10 20 30 40 50 60 Real Estate
Equities
Source: Federal Reserve, First American Loan Performance, and Haver.
6
유럽으로 번진 금융 불안
Spread Between 3-Mon. Interbank Interest Rates and OIS
(basis points)
0 50 100 150 200 250
Jan-06 Jul-06 Jan-07 Jul-07 Jan-08 Jul-08
0 50 100 150 200 250
Euro GBP
Paribas S uspends 3 He dge Funds
Bear Stearns Rescue
Lehman Failure
Source: Bloomberg
7
신흥시장국의 외부 취약성 지표
Foreign Stock Ownership, 2006 (Pe rcent of GDP)
0 10 20 30 40
So uth Africa Korea Russia Me xico Brazil India Turkey Chile China Arg entina
Sour ces: IMF
Gross Financing Requirements (%
of Int’l Reserves)
-50 0 50 100 150
Turkey Korea Hungary South Africa Mexico Poland Brazil India Argentina Russia Chile China
Sources: Citi
Banking Assets Held by Foreign-owned Banks
(Percent)
0 20 40 60 80 100
Mexico Hungary
Poland Korea Chile South Africa Argentina Brazil Russia T urkey China India
Sources: Fitch Country Analysis reports and IMF Global
Financial Stability Report
8
심각한 세계 경기 침체 가능성
Growth in Global GDP (PPP, y/y, perc ent)
0 1 2 3 4 5 6 7 8
1950 1955 1960 1965 1970 1975 1980 1985 1990 1995 2000 2005 2010
Percent
0 1 2 3 4 5 6 7 8 Percent
Actual Trend
Trend -1.25 S.D.
Source : Maddison, IMF, Citi
9
한국 경제 전망
• 세계 금융 위기로부터의 부정적인 영향을 반영하여 2009년 GDP 성장률 전망치를 2.2%로 하향 조정하였다. 거시 지표들은 최근 금융 위기 이전에도 성장이 이미 둔화되고 있었음을 나타내고 있다. 미국 경기 침체로부터 야기된 세계 경제 침체가 수출 둔화로 이어지는 한편, 외채/환헤지를 통한 유동성 공급 메커니즘의 중단으로 인한 국내 신용 긴축은 내수에 악영향을 줄 것이다.
• 낮아진 유가와 상품 가격으로 인해 2009년 소비자 물가 성장률은 하락할 것이다. 원화 약세가 인플레이션을 지지할 것이나 뚜렷한 성장 둔화 또한 인플레이션 압력 완화에 일조할 것이다.
• 낮은 상품 가격, 원화 약세와 내수 부진 등으로 경상수지는 2009년에 큰 폭의 흑자를 낼 수 있을 듯하다. 그러나 해외 자본 유입의 회복은 상당히 더딜 것으로 예상한다. 낮은 상품 가격으로 인한 수출 및 수입 가격 하락은 달러화 표시
수출, 수입 성장률의 급격한 하락을 가져올 듯하다.
• 한국은행은 경기 회복을 위한 적극적인 통화 완화 정책을 시행할 것으로 본다.
2009년 상반기까지 정책 금리가 3.5%로 하락할 것으로 예상한다. 또한
한국은행은 신용 위기를 완화하기 위해 금융 시장에 직접 유동성을 공급할
것으로 예상된다. 2009년 정부 예산도 성장 전망 악화를 반영하여 수정될
것이다. 정부는 세금 감면과 지출 확대를 동시에 실행할 듯하다.
10
한국 : 주요 거시경제 지표 예측
2007 2008F 2009F
GDP 성장률 5.0% 4.2% 2.2%
국내최종수요 4.5 1.9 1.5
민간소비 4.5 2.1 1.7
정부소비 5.8 4.3 3.8
설비투자 7.6 1.5 -1.5
건설투자 1.2 -1.1 1.5
수출 (국민계정, 서비스 포함) 12.1 10.6 4.8
수입 (국민계정, 서비스 포함) 11.9 8.9 3.7
상품수출 증가율 (달러 기준) 14.1 21.2 11.5
상품수입 증가율 (달러 기준) 15.3 28.9 8.0
경상수지 (억 달러) 60 -95 168
경상수지 (GDP 대비 %) 0.6 -1.0 2.0
실업률 3.2 3.2 3.5
소비자물가 상승률 2.5 4.7 3.0
통합재정수지(GDP 대비 %) 3.8 3.0 1.5
11
환율 급등의 원인은 경상수지 적자라기 보다는 기초수지의 누적된 적자 …
무역수지 및 경상수지 기초수지 및 단기자본수지
Source: The Bank of Korea
-5 -4 -3 -2 -1 0 1 2 3 4 5 6
1995 1996 1997 1998 1999 2000 2001 2002 2003 2004 2005 2006 2007 2008
Trade Account Current Account
-12 -10 -8 -6 -4 -2 0 2 4 6 8 10 12 14
2001 2002 2003 2004 2005 2006 2007 2008
Basic Balance Short-term Capital A ccount
12
… 혹은 외채 증가세의 급감
국제수지 주요계정
Source: The Bank of Korea
-40 -30 -20 -10 0 10 20 30 40 50
20 03
20 04
20 05
20 06
20 07
20 08
-40 -30 -20 -10 0 10 20 30 40 50
External Borrowing Current Account
Eq uity-Related Investment Others
Changes in FX Reserve
13
외환 수급 분석
외화 유출입 추이 (2006-2007년) 억 달러 외화 수급 추이 추정 (2008년 8월까지)
외화 유입 금액 외화 유출 금액
경상수지 흑자 113 직접투자수지 적자
182
외국투자자의 한국채권 매수
751 국내투자자의 해외주식 매수
677
해외 차입 1,162 해외투자자의 한국주식 매도
371
기타 424 외환보유고
증가
372
외화 유입 금액 외화 유출 금액
외국투자자의 한국채권 매수
180 경상수지 적자 120
해외 차입 330 직접투자수지
적자
100
부족분 400(?) 해외펀드 환헤지 관련
240
해외투자자의 한국주식 매도
350
기타 100
14
유동 외채와 외환 보유고
Source: The Bank of Korea
0 50 100 150 200 250 300
1999 2000 2001 2002 2003 2004 2005 2006 2007 1H 2008
0%
20%
40%
60%
80%
100%
Curr ent External Debt (Left) FX Reserve (Left) Ratio of Current Debt to FX Reserve (Rig ht)
15
한국 경제의 민간 부채 급증
GDP 대비 민간부문 부채, 한국 GDP 대비 민간부문 부채, 국제 비교
Source: The Bank of Korea, National Sources.
100%
110%
120%
130%
140%
150%
160%
170%
180%
190%
200%
1991 1993 1995 1997 1999 2001 2003 2005 2007 40%
50%
60%
70%
80%
90%
100%
110%
120%
130%
140%
Total ( Left) Household ( Rig ht) Corporate (Ri ght)
0%
40%
80%
120%
160%
200%
240%
Kor ea U .S. J apan U.K. Euro Area
(2006)
Taiwan (2006)
Household Corporate
16
수출 및 해외투자 헤지 관련 선물환 순매도가 주도한 외채 증가는 …
기업체의 선물환 순매도액, 해외 주식 투자액과 외채 증가액 (10억 달러)
외채 증가 추이
Source: The Bank of Korea
0 5 10 15 20 25 30 35 40 45 50
2005 2006 2007 2008
0 5 10 15 20 25 30 35 40 45 50
Overseas Equity Investment
Cor porate Sec tor's Net F orward FX Sell ing Incr eases in External Debt
0 50 100 150 200 250 300 350 400 450
1994
1995 1996 1997 1998 1999
2000
2001 2002 2003 2004 2005
2006 2007
1H 2008
Short-term Debt Long-term Debt
17
… 국내 / 민간 신용의 증가로 이어짐
은행권의 순대외채무 및 외국인 국내 채권 보유액 (조 원) 비금융 민간 부문의 이자부 부채 및 외채 증가율
Source: The Bank of Korea
- 6%
- 3%
0%
3%
6%
9%
12%
15%
18%
2001 2002 2003 2004 2005 2006 2007 2008
-20%
-10%
0%
10%
20%
30%
40%
50%
60%
Private Sector's Interes t Bearing Debt ( Left) External Debt (Right)
0 20 40 60 80 100 120 140
2Q06 3Q06 4Q06 1Q07 2Q07 3Q07 4Q07 1Q08 2Q08
Banks' Net External Bor rowing For eigner s' Hol dings on Korean Won Bonds
18
은행의 자본 시장 / 외채 의존도 상승
은행 대출 및 예금 잔고 추이 은행의 자본 시장을 통한 자금 조달 분류
CD and RP 24%
Debentures 34%
External Borrowing 30%
Others 12%
Source: The Bank of Korea
0 100 200 300 400 500 600 700 800 900
1995 1997 1999 2001 2003 2005 2007
0 100 200 300 400 500 600 700 800 900
Loan Deposit
19
외채 / 환헤지 ( 통화스왑 ) 를 통한 원화 유동성 공급 메카니즘
국내은행 수출업체
해외투자자
해외은행
W900
$1
$1 $1 W900
$1
기업 / 가계 / 정부 국내투자자
주식 W900 W900 W900
현재
미래
20
유동성 및 은행 대출의 최근 감속 기미
통화 지표 증가율 은행 대출 증가율
Source: The Bank of Korea
-5%
0%
5%
10%
15%
20%
25%
30%
35%
2001 2002 2003 2004 2005 2006 2007 2008
-5%
0%
5%
10%
15%
20%
25%
30%
35%
M1-MMF M2 Lf
-10%
0%
10%
20%
30%
40%
50%
60%
2001 2002 2003 2004 2005 2006 2007 2008
-10%
0%
10%
20%
30%
40%
50%
60%
Total Household Corporate
21
대출 태도 지수에 나타난 신용 경색 신호
Source: The Bank of Korea
대출 태도 지수 (DI)
-40 -30 -20 -10 0 10 20 30 40
2005 2006 2007 2008
-40 -30 -20 -10 0 10 20 30 40
Willingness to Lend Credit Risk Loan Demand
22
CD 및 은행채 스프레드 추이에 나타난 신용 경색
0 50 100 150 200 250 300
2001-01-02 2002-01-07 2003-01-14 2004-01-27 2005-01-25 2006-01-26 2007-02-13 2008-02-26
0 50 100 150 200 250 300
CD-콜금리 3년만기 AAA
은행채-국고채 금리23
환율 및 금리 전망
2008.10.22. 4Q08E 1Q08E 2Q09E 3Q09E
USD/KRW 1363 1250 1200 1200 1200
한국은행 정책금리 5.00% 4.50% 4.00% 3.50% 3.50%
91일 CD 금리 6.15 5.50 4.80 4.20 4.10
3년 만기 국고채 금리 4.80 4.75 4.20 3.75 3.80
5년 만기 국고채 금리 4.84 4.80 4.20 3.80 3.90
• 달러/원 환율은 당분간 1,300원대에서 높은 변동성을 유지할 것으로 예상한다.
세계 금융 시장의 점진적인 안정 회복과 외화 유동성 개선을 위한 정부의 긴급 대책은 원화를 어느 정도 지지할 것이나, 원화 유동성 문제의 지속 및 성장 전망 악화는 원화 약세 요인으로 계속 작용한다. 기존의 연말 환율 전망치인 1,250원을 유지한다.
• 우리는 한국은행이 적극적으로 금리를 인하하여 2009년 상반기엔 정책 금리가
3.5%까지 하락할 것으로 예상하고 있으며, 만약 우리의 전망치가 맞다면 지표
금리 또한 4.0%까지 하락할 것으로 본다.
24
Other Disclosures ADDITIONAL INFORMATION REGARDING THIS REPORT IS AVAILABLE ON REQUEST.
Citigroup research analysts receive compensation based on a variety of factors. Like all Citigroup employees, analysts receive compensation that is impacted by Citigroup’s overall profitability, which includes revenues from, among other things, investment banking activities. Analyst compensation is determined by Citigroup research management and other senior management (not including investment banking personnel).
ISSUER-SPECIFIC DISCLOSURES
Citigroup, its officers, directors and/or employees , may from time to time have long or short positions in, act as principal in connection with, and buy or sell securities or derivatives (including options and warrants) discussed in this report. For purposes of your review of this report, you should assume that this is the case with respect to the securities covered herein.
Citigroup does and/or seeks to do business with many issuers, including through the provision of investment banking or other services. For purposes of your review of this report, you should assume that Citigroup has acted as a manager or co-manager of an offering of securities discussed in this report within the prior 12 months or has provided other services to the issuer within the prior 12 months for which it has received or expects to receive compensation.
Citigroup is an active market maker or liquidity provider for many fixed-income securities and from time to time takes principal positions in such securities or related derivatives. For purposes of your review of this report, you should assume that this is the case with respect to the securities covered herein.
OTHER GENERAL DISCLOSURES
This research report was prepared by Citigroup Global Markets Inc. (“CGMI”) and/or one or more of its affiliates (collectively, “Citigroup”), as further detailed in the report, and is provided for information and discussion purposes only. It does not constitute an offer or solicitation to purchase or sell any securities or other financial products.
This report does not take into account the investment objectives, financial situation or particular needs of any particular person. Investing in securities and other financial products entails certain risks, including the possible loss of the entire principal amount invested. Certain investments in particular, including those involving structured products, futures, options and other derivatives, are complex, may entail substantial risk and are not suitable for all investors. The price and value of, and income produced by, securities and other financial products may fluctuate and may be adversely impacted by exchange rates, interest rates or other factors. Prior to effecting any transaction in options or options-related products, investors should read and understand the current Options Clearing Corporation Disclosure Document, a copy of which may be obtained on request from your Citigroup representative. Certain securities may not be registered with, or subject to the reporting requirements of, the US Securities and Exchange Commission or any comparable regulatory authority. Information available on such securities may be limited. Investors should obtain advice from their own tax, financial, legal and other advisors and only make investment decisions on the basis of the investor’s own objectives, experience and resources.
The information contained in this report is based on generally available information and, although obtained from sources believed to be reliable, its accuracy and completeness is not guaranteed. The analysis contained in this report is based on a number of assumptions. Changes in such assumptions could produce materially different results. This communication is not intended to forecast or predict future events. Past performance is not a guarantee or indication of future results.
Citigroup research analysts may communicate with sales and trading personnel and other Citigroup personnel for the purposes of gathering and analyzing market information and may discuss with such personnel information regarding, among other things, market trends, economic trends, the market for bonds of a specific issuer and other market information (such as current prices, spreads and liquidity), so long as such communications do not impair the analyst’s independent ability to express accurately his or her personal views about any and all of the subject securities or issuers. Other Citigroup personnel who do not function as research analysts, including sales and trading personnel, may provide oral or written market commentary or trade ideas to Citigroup’s customers or proprietary trading desks that differ from the views expressed in this report. Citigroup’s proprietary trading and asset management businesses may make investment decisions that are different from the recommendations contained in this report.
Citigroup has no duty to update this report and the opinions, estimates and other views expressed in this report may change without notice. No liability whatsoever is accepted for any loss (whether direct, indirect or consequential) that may arise from any use of the information contained in or derived from this report.
Securities recommended, offered or sold by Citigroup (unless expressly stated otherwise): (i) are not insured by the Federal Deposit Insurance Corporation or any other body; and (ii) are not deposits or other obligations of Citibank, N.A. or any other insured depository institution.
Citigroup does not provide tax advice and nothing contained herein is intended to be, or should be construed as, tax advice. Any discussion of US tax matters contained in this report was written to support the promotion or marketing of the transactions or other matters addressed herein and is not intended to be used, and must not be used by any recipient, for the purpose of avoiding US federal tax penalties. Recipients of this report should seek tax advice based on the recipient’s own particular circumstances from an independent tax adviser.
This report is intended for distribution solely to customers of Citigroup in those jurisdictions where such distribution is permitted. No part of this report may be copied or redistributed by any recipient for any purpose without Citigroup’s prior written consent.
Local law requirements may prohibit certain investors from effecting a transaction in the security or securities covered in this report. US persons wishing further information or to effect a
transaction should contact a registered representative of CGMI in the United States. Non-US persons wishing further information or to effect a transaction should contact a Citigroup entity
located in their own jurisdiction unless applicable governing law permits otherwise.
25
AUSTRALIA: T his report is made available in Australia to wholesale clients through Citigroup Global Markets Australia Pty Ltd. (ABN 64 003 114 832 and AFSL No. 240992) and to retail clients through Citigroup Wealth Advisors Pty Ltd. (ABN 19 009 145 555 and AFSL No. 240813), participants of the ASX Group, and regulated by the Australian Securities & Investments Commission. Citigroup Centre, 2 Park Street, Sydney, NSW 2000. CANADA: If this report is being made available in certain provinces of Canada by Citigroup Global Markets (Canada) Inc. (“CGM Canada”), CGM Canada has approved the Product. Citigroup Place, 123 Front Street West, Suite 1100, Toronto, Ontario M5J 2M3. CHINA:This report is made available in China through Citibank, N.A. Beijing Branch, 16F Tower 1 Bright China Chang-an Bldg., 7
Jianguomen Nei Avenue, Beijing, 100005 P.R. China. Citibank, N.A. Beijing Branch is regulated by the China Banking Regulatory Commission. CZECH REPUBLIC: This report is being distributed within the territory of the Czech Republic by Citibank a.s. Citibank a.s. is a bank and securities broker/dealer regulated by the Czech National Bank, Na Príkope 28, Prague 1, Czech Republic. Unless expressly stated otherwise, Citibank a.s. is only distributing this report and, upon its distribution, it has not changed or amended the actual content of this report in any way (as such was prepared by respective entities and/or individuals as further detailed in the report). HONG KONG:If this report is made available in Hong Kong by, or on behalf of, Citigroup Global Markets Asia Ltd., it is attributable to Citigroup Global Markets Asia Ltd., Citibank T ower, Citibank Plaza, 3 Garden Road, Hong Kong. Citigroup Global Markets Asia Ltd. is regulated by the Hong Kong Securities and Futures Commission. If this report is made available in Hong Kong by Citibank, N.A., it is attributable to Citibank, N.A., Citibank T ower, Citibank Plaza, 3 Garden Road, Hong Kong. Citibank, N.A. is regulated by the Hong Kong Monetary Authority. INDIA: The Product is made available in India by Citigroup Global Markets India Private Limited, which is regulated by Securities and Exchange Board of India. Bakhtawar, Nariman Point, Mumbai 400-021. INDONESIA:This report is made available in Indonesia through Citibank, N.A. Indonesia Branch, Citibank T ower Lt 7, Jend. Sudirman Kav 54-55, Jakarta. Citibank, N.A. Indonesia Branch is regulated by the Bank of Indonesia. JAPAN:
T his report is being distributed in Japan by Nikko Citigroup Limited. If this report was prepared by a Citigroup affiliate of Nikko Citigroup Limited, it is being distributed by Nikko Citigroup Limited under license. If this report was prepared by Nikko Citigroup Limited, it may be based in part on a report produced by one of its affiliates used under license. If this report was prepared by Nikko Citigroup Limited and is being distributed in other jurisdictions by other Citigroup affiliates, or by Nikko Cordial Securities Inc., it is being distributed by them under license. Nikko Citigroup Limited is regulated by Financial Services Agency, Securities and Exchange Surveillance Commission, Japan Securities Dealers Association, Tokyo Stock Exchange and Osaka Securities Exchange. Akasaka Park Building, 2-20, Akasaka 5-chome, Minato-ku, T okyo 107-6122. KOREA: T he Product is made available in Korea by Citibank Korea Inc., which is regulated by the Financial Supervisory Commission and the Financial Supervisory Service. Address is Dadong 39, Jung Gu, Seoul, Korea, 100-180. MEXICO: T his report is made available in Mexico by Acciones y Valores Banamex, S.A. De C. V., Casa de Bolsa, and Banco Nacional de México S.A. Acciones y Valores Banamex is regulated by Comision Nacional Bancaria y de Valores. Its address is Reforma 398, Col. Juarez, 06600 Mexico, D.F. Banco Nacional de México S.A. is regulated by the Comisión Nacional Bancaria y de Valores. Its address is Actuario Roberto Medellín 800, Col. Santa Fé, (01210) Mexico City, Mexico. NEW ZEALAND:This report is made available in New Zealand through Citigroup Global Markets New Zealand Limited (Company No. 604457), a Participant of the New Zealand Exchange Limited and regulated by the New Zealand Securities Commission. Level 11, 23 Customs Street East, Auckland, New Zealand.
PHILIPPINES: T his report is made available in the Philippines through Citibank, N.A. Philippine Branch, 8741 Paseo de Roxas, Makati City, Philippines. Citibank, N.A. Philippine Branch is regulated by the Bangko Sentral ng Pilpinas. POLAND: The Product is made available in Poland by Dom Maklerski Banku Handlowego SA, an indirect subsidiary of Citigroup Inc., which is regulated by Komisja Papierów Wartosciowych i Gield. Bank Handlowy w Warszawie S.A. ul. Senatorska 16, 00-923 Warszawa. RUSSIA: The Product is made available in the Russian Federation through ZAO Citibank, which is licensed to carry out banking activities in the Russian Federation in accordance with the general banking license issued by the Central Bank of the Russian Federation and brokerage activities in accordance with the license issued by the Federal Service for Financial Markets. Neither the Product nor any information contained in the Product shall be considered as advertising the securities mentioned in this report within the territory of the Russian Federation or outside the Russian Federation. T he Product does not constitute an appraisal within the meaning of the Federal Law of the Russian Federation of 29 July 1998 No. 135-FZ (as amended) On Appraisal Activities in the Russian Federation. 8-10 Gasheka Street, 125047 Moscow. SINGAPORE:The Product is made available in Singapore through Citigroup Global Markets Singapore Pte. Ltd. and Citicorp Investment Bank Singapore Ltd. Citigroup Global Markets Singapore Pte. Ltd. is a Capital Markets Services License holder and regulated by the Monetary Authority of Singapore. 1 Temasek Avenue, #39-02 Millenia T ower, Singapore 039192. Citicorp Investment Bank Singapore Ltd. is a Merchant Banking License holder and regulated by the Monetary Authority of Singapore. 3 Temasek Avenue, #17-00 Centennial T ower, Singapore 039190. SOUTH AFRICA:Citigroup Global Markets (Pty) Ltd. is incorporated in the Republic of South Africa (company registration number 2000/025866/07) and its registered office is at 145 West Street, Sandton, 2196, Saxonwold. Citigroup Global Markets (Pty) Ltd. is regulated by the JSE Securities Exchange South Africa, the South African Reserve Bank and the Financial Services Board. The investments and services contained herein are not available to private customers in South Africa. TAIWAN: T he Product is made available in Taiwan through Citibank, N.A., Taipei Branch, which is regulated by the Financial Supervisory Commission. No portion of the report may be reproduced or quoted in T aiwan by the press or any other person. F.8 No. 169, Section 4, Jen Ai Road, Taipei, Taiwan. UNITED KINGDOM:
T his report is being distributed in the United Kingdom by Citibank, N.A., London Branch, or Citigroup Global Markets Limited, Citigroup Centre, Canada Square, Canary Wharf, London E14 5LB, UK. T his material is directed exclusively at market professional and institutional investor customers in the United Kingdom and is not for distribution to private customers in the United Kingdom as defined by the Financial Services Authority. Any investment or service to which this material may relate will not be made available to such private customers. This material may relate to investments or services of a person outside the United Kingdom or to other matters which are not regulated by the Financial Services Authority and further details as to where this may be the case are available on request in respect of this material. UNITED STATES:
T his report is being distributed in the United States by CGMI. If this report was prepared in whole or in part by a non-U.S. affiliate of CGMI, CGMI accepts responsibility for its contents (subject to the notices above). If this report covers non-U.S. securities, U.S. investors should be aware that non-U.S. companies may not be subject to uniform audit and reporting standards, practices and requirements comparable to those in the United States. Securities of some non-U.S. companies may be less liquid and their prices may be more volatile than securities of comparable U.S. companies. Exchange rate movements may have an adverse effect on the value of an investment in non-U.S. securities and its corresponding dividend payment for U.S. investors. CGMI is a member of the Securities Investor Protection Corporation.
EUROPEAN UNION:Unless specified to the contrary, within EU Member States, the Product is made available by Citigroup Global Markets Limited, which is regulated by the Financial Services Authority. Many European regulators require that the firm must establish, implement and make available a policy for managing conflicts of interest arising as a result of publishing or distribution of investment research. The policy applicable to research analysts within Citigroup’s Fixed Income Strategy and Analysis and Economic & Market Analysis divisions, as well as the investment research they produce, can be obtained by contacting Citigroup Global Markets Inc., 388 Greenwich Street 11thfloor, NY NY 10013, Attention: Fixed Income Publishing.
© Citigroup Global Markets Inc., 2008. All rights reserved. Smith Barney is a division and service mark of Citigroup Global Markets Inc. and its affiliates and is used and registered throughout the world. Citi and Citi and Arc Design are trademarks and service marks of Citigroup Inc. or its affiliates and are used and registered throughout the world. CitiFx® is a service mark of Citicorp Inc.. Nikko is a service mark of Nikko Cordial Corporation. Any unauthorized use, duplication or disclosure is prohibited by law and may result in prosecution.
제2주제
외환시장의 불안요인 점검과 대응방안
안순권
( 한국경제연구원 연구위원)
외환시장 불안요인 점검과 대응방안
2008. 10. 27
안 순 권
- 1 -
I. 최근 외환시장 동향
□ 미국발 금융위기의 충격에 따른 환율 폭등세와 변동성 확대
• 리먼브러더스 파산보호 신청 이전 1,109원(9/16)→ 장중 1,485원(10/9)
• 극심한 쏠림현상 : 10월 2일부터 8일까지 4
거래일 연속 상승하며208
원이나 급등<그림 1> 원/달러, 원/엔, 엔/달러 환율 추이
6 0 0 7 0 0 8 0 0 9 0 0 1 , 0 0 0 1 , 1 0 0 1 , 2 0 0 1 , 3 0 0 1 , 4 0 0 1 , 5 0 0
0 1 0 2 0 3 0 4 0 5 0 6 0 7 0 8 0 9 1 0 1 1 1 2 0 1 0 2 0 3 0 4 0 5 0 6 0 7 0 8 0 9 1 0
5 0 6 0 7 0 8 0 9 0 1 0 0 1 1 0 1 2 0 1 3 0
원/달 러 환 율(좌) 원/엔 환 율(좌) 엔/달 러 환 율(우)
2 0 0 7년 2 0 0 8년
(원) (엔)
- 2 -
— 일일 변동폭이 급격히 확대하며 불안심리 고조됨
• 일일 변동 폭 지난 7~8월 7~8원, 9월에 25원, 10월 중 72.60원까지 상승.
• 원 /달러 환율의 일일변동률이 —1%~ +2%
범위 내에서—8% ~ +9%
범위로 확대<그림 2> 원/달러 환율 전일대비 증감률
-9 . 0 -7 . 0 -5 . 0 -3 . 0 -1 . 0 1 . 0 3 . 0 5 . 0 7 . 0 9 . 0
0 1 / 0 2 0 1 / 2 3 0 2 / 1 3 0 3 / 0 5 0 3 / 2 6 0 4 / 1 6 0 5 / 0 7 0 5 / 2 8 0 6 / 1 8 0 7 / 0 9 0 7 / 3 0 0 8 / 2 0 0 9 / 1 0 1 0 / 0 1 1 0 / 2 2 (% )
- 3 -
□ 원화환율 폭등세는 국가별 금융위기 유형상 통화폭락(currency crash) 1)
상황에 해당— Frankel and Rose(1996)와 Reinhart and Rogoff(2008)의 통화 폭락 사태 정의
*
통화가치가 해당 연도에25%
이상 급락하고 전년도 변동률 보다10%
포인트 이상 높을 경우 때 통화폭락 사태가 발생한 것으로 볼 수 있음2)
• 올해 초 환율은 938.20원에서 25%
이상 급등한 환율 수준은 1,172.75원 이상• 지난해 원/달러 환율의 지난해 변동률은 5.29%,
올 들어 최저 환율인934.50에 15.29%
이상의 변동률을 가진 환율은 1,077.28원— 한국은 주요국 중 캐나다 (27.2%),
인도(26.4%), 브라질(26.0%) 등과 함께 통화폭락(currency crash) 사태를 당한 국가※Reinhart and Rogoff(2008)의 지난 800년간 세계경제의 금융위기 4대 유형 분류 •은행위기 (banking crisis):
뱅크런, 은행폐쇄, 합병 및 국유화•외채위기 (external debt crisis):
국가 부도 사태•인플레이션 위기 (Inflation crisis) :
연간 소비자 물가상승률이20%
이상•통화폭락(currency crash) :
미달러화에 대한 통화가치 하락이 연간 15% 이상— 1997년 외환위기 =
통화폭락+
외채위기 + 은행위기• 통화폭락→은행위기 →외채위기로 갈 수 있는 1단계에서 외환시장을 진정시켜야 함
1) 1971~1992년 105개 개도국의 외환부족사태의 원인을 계량분석한 Frankel and Rose(1996)은 외환위기(currency crisis) 대신 외환충돌(currency crash)이라는 용어를 사용 했다.
2) 외환폭락 사 태의 정의는 Frankel and Rose(1996)는 통화가치가 해 당 연도에 25% 이상 급락 하고 전년도 변동률 보다 10% 포인트 이상 높을 때이며, Reinhart and Rogoff(2008)는 미달러화에 대한 통화가치 하락이 연간 15% 이상인 경우 를 말한다.
- 4 -
II. 최근 외환시장 불안의 원인 및 전망
1. 미국발 금융위기의 충격
□ 국내은행의 해외 자금 조달 여건 악화
— 최근 외평채 가산금리 및 한국물 CDS프리미엄 급격히 상승
<그림 3> 국내 외화 유동성 여건
0 1 0 0 2 0 0 3 0 0 4 0 0 5 0 0 6 0 0
10/22
09/22
08/25
07/28
06/30
06/02
05/05
04/04
03/07
02/08
01/09
12/07
11/08
10/11
09/10
08/13
07/16
b p
0 5 0 1 0 0 1 5 0 2 0 0 2 5 0 3 0 0 3 5 0 4 0 0 4 5 0 5 0 0 b p
외 평 채 1 4 ( b p ) , 우 C D S 한 국 ( 5 y r ) , 좌
2 0 0 7 년 2 0 0 8 년
- 5 -
— 정부의 국제금융시장 불안극복방안 발표 (10/19)
이후 외화자금시장의 불안은 진정기미• 달러화 차입여건을 나타내는 스왑베이시스 (통화스왑 -금리스왑 )와 스왑 포인트(선물 환율-현물 환율)는 급격히 확대
되었다가 소폭 축소3)
<표 1> 국내 달러화 차입여건
1.2 3.17 9.12 9.16 9.23 9.30 10.6
10.10 10.16 10.21 10.23 스왑포인트(3개월,원) △3.6 △1.2 +1.15 △2.00 △11.7 △7.0 △11.0 △29.0 △26.0 △11.0 △15.0스왑베이시스(1년,bp) △244 △376 △232 △291 △351 △301 △319 △490 △597 △438 △513
CRS(1년,bp) 353 150 349 270 240 290 274 80 0 130 35
<그림 4> 1년물 스왑베이시스-원/달러환율 추이
- 7 0 0 - 6 0 0 - 5 0 0 - 4 0 0 - 3 0 0 - 2 0 0 - 1 0 0 0
0 7 / 0 1 0 7 / 1 5 0 7 / 2 9 0 8 / 1 2 0 8 / 2 6 0 9 / 0 9 0 9 / 2 3 1 0 / 0 7 1 0 / 2 1
9 5 0
1 , 0 5 0
1 , 1 5 0
1 , 2 5 0
1 , 3 5 0
1 , 4 5 0
1년 물 스 왑 베 이 시 스 원 /달 러 환 율
( b p ) (원 )
3) 스왑 포인트의 마이너스가 커질수 록 외화자금 사정이 나쁘다 는 의미임.
- 6 -
□ 해외금융기관 및 투자자들의 유동성부족에 따른 투자자금 회수
— 외국인 투자자 ,
여전히 국내 주식 순매도가 우위<그림 5> 외국인 주식매매 월별추이
- 1 0 0 1 0 2 0 3 0 4 0 5 0
0 4 . 0 1 0 4 . 0 6 0 4 . 1 1 0 5 . 0 4 0 5 . 0 9 0 6 . 0 2 0 6 . 0 7 0 6 . 1 2 0 7 . 0 5 0 7 . 1 0 0 8 . 0 3 0 8 . 0 8
순 매 수 매 도 매 수
(조 원 )
- 7 -
— 한국,
아시아 주요국 중 외국인 주식순매도 규모가 최대• 상대적으로 큰 한국증시 규모 및 매도 물량 수용 가능한 기관투자자 존재
• 유가,
곡물가 등 원자재 가격상승으로 국내경기둔화 및 기업수익성 하락 예상<표 2> 亞 주요국 외국인 주식순매수 추이
(단위: 백만 달러)
구분 ‘06년 ‘07년 ‘08년 6월 7월 8월 9월 9월주가
한국
△12,139 △29,417 △29,259 △4,615 △4,847 △2,847 △2,371 △1.78%
대만 17,074 2,594
△10,282 △3,816 △3,608 △1,009 △2,839 △18.83%
인도 7,751 17,236
△9,127 △2,503 △455 △300 △2,052 △11.70%
태국 1,917 1,570
△3,792 △1,105 △1,071 △336 △802 △12.84%
필리핀 1,359 1,253
△651
59 4△112 △148 △4.41%
인니 1,851 3,851 412
△48 △207
50 9△15.39%
합계 18,189
△438 △52,699 △12,028 △10,184 △4,555 △8,204
자료: 국제금융센터
- 8 -
<그림 6> 월별 외국인 채권 순매수 규모
6 .8 5
2 .5 7
1 0 .4 9
5 .7 6
1 . 0 5
2 .2 1
5 .1 7
6 .2 5
3 .7 5
0 .6 6
-2 .3 1
0 .7 2
4 .7 3
-2 .3 5 -4
-2 0 2 4 6 8 1 0 1 2
0 7 0 9 0 7 1 0 0 7 1 1 0 7 1 2 0 8 0 1 0 8 0 2 0 8 0 3 0 8 0 4 0 8 0 5 0 8 0 6 0 8 0 7 0 8 0 8 0 8 0 9 0 8 1 0
( 조 원 )주: 2008.10.21 현재
자료: 한국증권업협회 채권거래센터
- 9 -
□ 글로벌신용경색은 주요국의 공조체제 강화로 진정국면을 맞고 있으나 여전히 불안한 장세
— 미국의 구제금융법안 통과와 미국과 EU의 무제한 달러공급 및 주요국 중앙은행들의 공동 금리인하 등에 힙입어
신용경색 우려는 완화되었으나 유동성 압박감은 지속<그림 7> TED 스프레드 추이
0 1 2 3 4 5 6 7
07 /07 07 /08
07/ 09 07/ 10
07/ 11 07/ 12
08/ 01 08/ 02
08/ 03 08 /0 4
08 /0 5 08 /06
08 /07 08 /08
08/ 09 08/ 10
$ L ib o r( 3 M ) U S TB ( 3 M ) L i b o r -T B
(% )자료: 국제금융센터
- 10 -
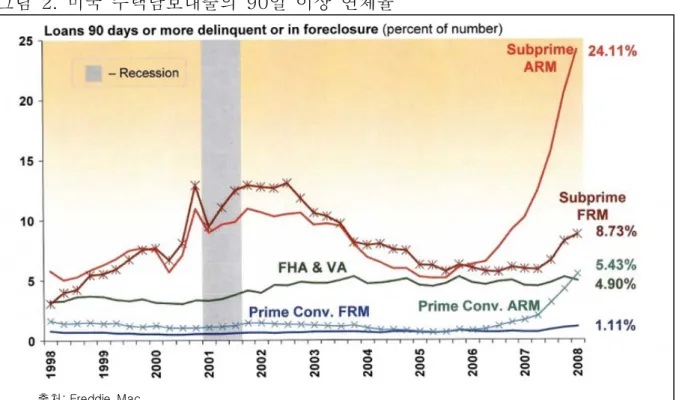
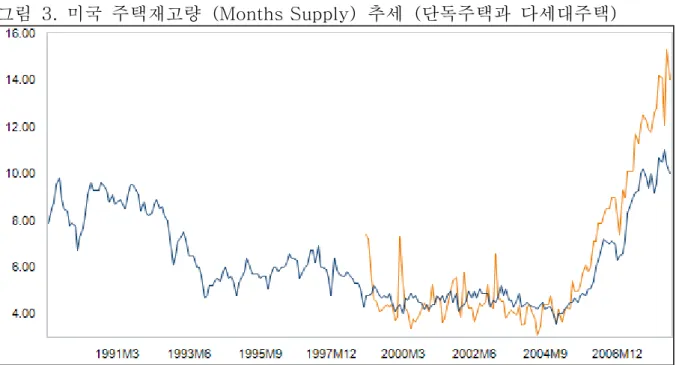
— 미국의 금융위기가 해소되는 데는 향후 1~2년이 소요될 것으로 전망
• 서브프라임 사태 해결의 관건인 미 주택경기 회복은 2009년 이후에나 가능할 것으로 예상됨
<그림 8> 미국 Fannie Mae의 주택가격 상승률 전망 변화 추이
-1 0 . 0 -8 . 0 -6 . 0 -4 . 0 -2 . 0 0 . 0 2 . 0
07 . 1 0 7 . 2 0 7 . 3 0 7 . 4 0 8 . 1 0 8 . 2 0 8 . 3 0 8 . 4 0 9 .1 0 9 . 2 0 9 .3 0 9 . 4
(% )
0 7년 1 2월 전 망
0 8년 4월 전 망
0 8년 6월 전 망
0 8년 9월 전 망
07년 9월 전 망
주: 전년 동기대비 상승률, Total Existing Home 기준 Median 자료: Fannie Mae
- 11 -
2. 경상수지와 자본수지의 동반 적자
<그림 9> 경상·자본수지와 원/달러
- 2 5 , 0 0 0 - 1 5 , 0 0 0 - 5 , 0 0 0 5 , 0 0 0 1 5 , 0 0 0 2 5 , 0 0 0 3 5 , 0 0 0 4 5 , 0 0 0
9 0 9 3 9 6 9 9 0 2 0 5 0 8 / 0 1 0 8 / 0 4 0 8 / 0 7 0 8 / 1 0
4 0 0 6 0 0 8 0 0 1 , 0 0 0 1 , 2 0 0 1 , 4 0 0 1 , 6 0 0
경 상 수 지 (좌 ) 자 본 수 지 (좌 ) 원 /미 국 달 러 (우)
(백 만 달 러 ) (원)
주: 2008.10.21현재 원/달러 평균환율 자료 : 한국은행 경제통계시스템
- 12 -
1)
경상수지 적자□ 경상수지 적자 기조와 수출둔화에 따른 달러 공급 부족은 상당기간 지속될 가능성이 높음
— 올 들어 8월까지 125.8억 달러의 경상수지 적자는 주로 국제유가 상승 지속에 따른 수입급증 및
서비스수지 적자 지속에 기인
•국제유가가 하락 기조를 보이면서 올해 4‧4분기 경상수지는 소폭 흑자 전망
<그림 10> 경상수지 요소별 추이
(단위: 억 달러)
- 3 0 - 2 0 - 1 0 0 1 0 2 0 3 0 4 0
9 5 9 6 9 7 9 8 9 9 0 0 0 1 0 2 0 3 0 4 0 5 0 6 0 7 0 8
상 품 수 지
소 득 수 지
서 비 스 수 지
(억 달 러 )
경 상 수 지
- 13 -
□ 해외수요의 침체로 내년 경상수지는 50억 달러 후반대의 적자를 기록할 전망
— 상품수지는 수출증가율이 둔화되더라도 국제유가 및 원자재 가격의 하락 및 국내경기둔화 등의 영향으로 수입증가
율이 더 하락함으로써 흑자를 기록할 전망임— 서비스수지는 환율급등으로 해외지출이 감소하면서 최근 감소하고는 있으나 ,
내년에는 해외 서비스에 대한 수요 가 증가하면서 적자확대 추세를 지속할 전망— 소득수지는 소폭의 흑자를 기록할 전망이나 아직 서비스수지 적자를 메우기에는 크게 미흡
<그림 11> 경상수지 누적액과 외환보유액 변동
- 2 0 0 - 1 0 0 0 1 0 0 2 0 0 3 0 0 4 0 0 5 0 0
9 7 9 8 9 9 0 0 0 1 0 2 0 3 0 4 0 5 0 6 0 7 0 8
- 2 0 0 - 1 0 0 0 1 0 0 2 0 0 3 0 0 4 0 0 5 0 0
(억 달 러 ) (전 년 동 월 억 달 러 )
외 환 보 유 액 증 감 (우 )
경 상 수 지 ( 1 2 개 월 누 적 치 , 좌 )
- 14 -
2)
자본수지 적자□ 글로벌 신용경색이 크게 완화되어 국내금융기관의 해외차입상의 어려움이 해소되지 않는 한
자본수지의 흑자 전환을 낙관하기 어려움
<그림 12> 자본수지 구성요소별 추이
(단위: 억 달러)
- 4 0 - 3 0 - 2 0 - 1 0 0 1 0 2 0 3 0 4 0 5 0 6 0
2 0 0 0 2 0 0 1 2 0 0 2 2 0 0 3 2 0 0 4 2 0 0 5 2 0 0 6 2 0 0 7 2 0 0 8
(억 달 러 )
기 타 투 자 수 지
직 접 투 자 수 지
포 트 폴 리 오 투 자 수 지 자 본 수 지
- 15 -
— 직접투자수지 순유출 (적자)
지속 전망• 직접투자의 해외 유출이 유입보다 압도적으로 많음
— 증권투자수지 순유출은 점차 줄어들 전망
• 신용경색에 따른 위험자산 축소와 유동성 확보가 주목적인 외국인의 주식매도는 점차 축소
• 글로벌 금융불안이 해소되기 전에는 외국인의 주식순매수 확대 본격화를 기대하기 어려움
• 내국인의 해외주식투자가 순회수되고 있는 추세는 증권투자수지의 순유출 억제에 도움
— 기타투자수지는 순유입 (흑자)
지속하나 글로벌 신용경색 지속으로 유입액이 지난해 보다 크게 줄어들 전망• 기타수지의 대부분을 차지하고 있는 해외차입은 환헤지를 위한 국내 수출기업의 달러선물환 매도와 자산운용사의
해외펀드 투자 환헤지를 위한 선물환매도 물량 감소로 크게 줄어들 전망<그림 13> 내국인의 해외투자펀드 잔액 추이
3 0 4 0 5 0 6 0 7 0 8 0 9 0
0 4 / 3 0 0 6 / 3 0 0 8 / 3 0 1 0 / 3 0 1 2 / 3 0 0 2 / 2 9 0 4 / 3 0 0 6 / 3 0 0 8 / 3 0 1 0 / 3 0
(조 원 )
2 0 0 7년 2 0 0 8년
- 16 -
3. 외환시장의 구조적 문제점 1)
대규모 환헤지의 후유증□ 지난해 4분기와 올해 1~2분기에 급증한 선물환 매도의 후유증으로 달러 네고 물량 감소 전망
— 지난 수년간 수출기업들이 선물환 매도로 미리 달러를 팔아버리면서 수년 후 수출대금이 들어와도 서울
외환시장에 실제 유입되는 달러는 적음<그림 14> 국내 기업의 선물환 거래 추이
주: 1) 월평균 환율 기준
- 17 -
—외환시장의 달러 공급 우위를 주도했던 국내 기업들의 선물환 순매도 규모도 올 1‧4분기 이후 감소세를 보이고 있음
•조선․중공업체들의 수주 감소와 무역수지 적자 확대 ,
글로벌 금융시장 불안에 따른 환율상승 기대심리 상승<표 3> 국내 기업의 선물환 거래 추이
(억달러)
2006 2007 2008.1/4 2/4 3/4 7 8 9
매 도(A)
997 1,260 518 410 297 87 108 102
매 입(B)
504 542 176 168 220 90 54 76
순매도
(A-B) 493 718 342 242 77 -3 54 26
무역수지1)
161 146 -65 -0 -77 -20 -38 -19
주
: 1)
통관기준□ 원/달러 환율 하락을 예상한 적극적인 환헤지의 반작용이 외환수급을 더욱 악화시킴 4)
— 2006년 이후 수출기업들 800원대 환율 진입가능성을 염두에 두고 적극적인 환헤지
• KIKO옵션 같은 레버리지 옵션 거래도 확대
• 환율이 상승세로 반전하자 수출기업들은 환헤지 비율을 낮추기 ,
수입기업들은 달러결제를 서두르면서외환시장 수급 역전이 가속화
4) 정미영 (2008) 참조
- 18 -
— 환율급등으로 인한 기존 손실을 덮기 위한 대규모 재헤지 또는 물타기로 환손실이 급증
• 원/달러 환율 1,400원의 경우 KIKO
피해 중소기업 손실액은4~5조원
• 기존 헤지 포지션을 정리하기 위한 달러 수요
2)
단기 외채의 만기 연장난 발생□ 글로벌 신용경색이 지속되고 있는 가운데 국내 금융기관이 보유중인 단 기외채의 만기연장에 어려움이 발생한
것이 환율 급등의 주요 요인으로 작용5)
— 경상수지 적자로 인해 달러 공급이 어려운 가운데 해외은행들이 만기로 돌아오는 외채를 회수하거나 할 가능성이
높아 금융기관들은 가격을 불문하고 달러를 구해야할 상황임• 통화스왑시장에서 1년 만기 CRS금리가 0%로 하락
• 이는 원화를 공짜로 쓰게 해 줄 테니 달러를 빌려달라는 것을 의미함
5) 전민규 ㆍ윤창용ㆍ진은정(2008a) 참조
- 19 -
□ 국내 금융기관들이 외화를 단기로 조달해 장기로 운용하는 자금의 만기 불일치가 심화되고 있음
— 글로벌 신용경색으로 빌리는 돈의 차입기간은 짧아지는 데 비해 1년 이내에 갚아야 하는 돈은 600억 달러가 넘어
자금 운용에 어려움을 겪고 있음• 1년 이내에 만기가 도래하는 장기외채와 단기외채를 합한 유동외채(6월 말 기준)는 2223억 달러
• 유동외채 가운데 은행권의 단기외화차입액은 1455억 달러,
장기외화차입액은 650억 달러<표 4> 은행부문 외채
(단위: 억 불)
04년말 05년말 06년말 07년말 08.3말 08.6말
은행부문 745 834 1,365 1,940 2,144 2,105
국내은행 506 584 821 1,102 1,221 1,274
단기 235 280 443 546 626 660
장기 271 304 379 557 595 614
외은지점 239 250 544 838 923 831
단기 210 233 518 792 875 795
장기 29 17 26 46 48 36
자료: 한국은행 경제통계시스템
- 20 -
□ 수출업체의 선물환 매도를 받아 준 국내 금융기관들의 외채 만기구조에 위험이 잠복
—장기계약인 선물환계약과 환헤지용 단기외채간의 만기가 불일치할 경우 환율상승 요인
• 단기외채를 갚아야 할 시점에 연장이 되지않을 경우 현물환 시장에서 사서 외채를 상환해야
• 국내은행들의 2006년 이후 단기 외채 증가 380억 달러 >
장기외채증가310억 달러
• 선물환계약과 외채간의 만기가 불일치할 경우가 많을 가능성
• 미국발 금융위기와 같은 외부 충격이 있을시 스왑 베이시스확대에 따른 단기수익을 노리고
들어온 외화는 언제든 회수될 수 있음
<그림 15> 단기외채 차입현황
8 6 .2 8 1 . 0
- 7 9 .9
2 8 .0
4 5 . 8 5 8 . 0
- 5 . 0
- 4 6 . 9
4 1 . 2 4 5 .3
6 6 . 4
- 1 2 0 - 9 0 - 6 0 - 3 0 0 3 0 6 0 9 0 1 2 0
0 7 . 1 0 0 7 . 1 1 0 7 .1 2 0 8 . 0 1 0 8 .0 2 0 8 . 0 3 0 8 . 0 4 0 8 .0 5 0 8 . 0 6 0 8 . 0 7 0 8 .0 8 (억 달 러 )
- 21 -
3)
환투기 세력의 발호— 외화 수급의 공백이 발생한 틈을 타고 역내외 투기세력들이 활개를 펼치면서 환율 변동성이 확대
• 환투기세력은 경제의 펀더멘털에 허점이 발견되거거나 정책당국의 경제운용 능력에 대해 시장이 불신할 경우 더
욱 기승을 부리게 됨—7월부터 국내외환시장 보다 역외선물환(NDF)시장 거래액이 커지는 기현상이 나타나고 있는 것은 투기성거래의 증
가가능성을 시사함6)
•지난해 일평균 거래액이 국내외환시장은 82.5억달러였던 반면 NDF시장은 31.2억달러에 불과
•올상반기 까지 이런 추세가 지속되다가 7월보다 국내외환시장거래액보다 NDF시장 거래액이 많아지기 시작
•10월의 경우 일평균 거래액이 NDF시장이 120억달러로 국내외환시장의 49.9억달러의 두배가 넘음
6) 국회기 획재정위원회 최경환 의원 이 국정감사 자료에서 밝힌 내용이며, 연합통 신 2008년 10.23일 보도
- 22 -
4. 당국의 외환시장 개입의 문제점
□ 글로벌 신용경색과 유가 상승 등 외생변수의 큰 흐름을 고려치 않은 환율정책과 일관성이 부족이 불신 초래
— 지난 2월 이명박 출범 후 당국은 경상수지 흑자전환을 위해 고환율을 용인하는 자세를 취함
— 5월에는 고환율정책에서 물가압력이 거세지자 물가안정을 위한 저환율정책으로 선회 함
— 리먼브러더스 파산 등 미국발 금융위기의 충격으로 9월 이후 시장개입의 효과는 기대할 수 없음
□ 당국의 시장개입은 외환보유액 감소에 대한 우려를 불러일으키며 환율변동성을 확대시킴
— 환율정책에 대한 비판여론은 정부의 경제운영능력에 대한 논란을 불러일으켜
외환시장의 불안심리를 자극함<그림 16> 원/달러 환율변동 및 외환보유액 추이
- 6 0 - 4 0 - 2 0 0 2 0 4 0 6 0 8 0 1 0 0
0 4 . 0 1 0 4 . 0 5 0 4 . 0 9 0 5 . 0 1 0 5 . 0 5 0 5 . 0 9 0 6 . 0 1 0 6 . 0 5 0 6 . 0 9 0 7 . 0 1 0 7 . 0 5 0 7 . 0 9 0 8 . 0 1 0 8 . 0 5 0 8 . 0 9 - 1 5 - 1 0 - 5 0 5 1 0 1 5 2 0
외 환 보 유 고 (우 ) 환 율 변 동 (좌 )
(백 억 달 러 )
(원 )
주: 전월대비 증감액, 월평균자료
- 23 -
5. 국내금융시장의 잠재적 불안요인 1) 내수부문의 취약성
□ 국내금융시장의 불안요인이 외환시장에 부정적인 영향을 미치고 있음
—가계부채 부실화 우려
•2008년 6월말 현재 가계신용잔액 660.3조원(
전분기 대비19.8조원 증가 )
•가계의 신용건전성 악화
*가계 금융부채 /
가계 금융자산=45.1%(2008년 3월말 44.4%) •가계의 채무부담능력 악화
**
가계 금융부채/
처분가능소득=83.5%(2008년3월말 82.8%)
•가계대출 연체율은 2008년 9월 말 현재 0.58%로 6월말 (0.52%)
보다 소폭 상승•불황에 따른 소득감소 및 금리상승으로 가계대출관리의 불안 고조
—중소기업부채 리스크
•중소기업대출 연체율은 2008년 9월 말 현재 1.50%로 6월말(1.14%)
보다 상승•중소기업대출연체율은 대기업대출연체율 ( 2008년 9월 말 현재 0.31%)이나 가계대출연체율보다 높아 지속관찰 필요
- 24 -
—부동산 프로젝트 파인낸싱 (PF)
대출 리스크•PF대출연체율은 은행은 2008년 3월말 0.83%에서 0.64%
로, 저축은행은 14.46%에서 14.28%로 낮아짐•그러나 경기침체와 아파트미분양 및 건설경기침체로 연체율 상승 우려
□ 국내은행은 경기둔화에 따라 재무건전성 저하에 대한 우려가 제기됨
—수익성 ,
자산건전성 및 자본적정성 등 은행의 재무건전성은 우려할 상황이 아님•수익성 :
상반기 당기순이익, ROA(0.9%), ROE(13.5%)
등 선진국 은행보다 양호•자산건전성 :
연체율(2008년8월말 1.0%),
부실채권비율(2008년6월말 0.7%)
등은 건전한 수준•자본적정성 : 2008년 6월말 현재 BIS비율이 11.3%(바젤II)는 선진국 수준
-
양도성예금(CD)를 포함한 예대율은 105.4%로 크게 높지않음•일본(CD포함 74%)에 비해 높으나 미국 (CD
포함100~110%)
보다 낮음•은행권이 대출 재원으로 예금보다는 은행채 발행과 외화차입에 크게 의존해 온 것은 취약점
— 국내금융기관의 재무건전성악화 가능성에 대한 외국 신용평가회사들의 부정적 견해
•국제 신용평가회사인 S&P, 10월 16일 국내 주요 은행들을 부정적 관찰대상으로 지목
- 25 -
2) 외환위기 재발 가능성에 대한 우려
□ 이번 통화폭락사태의 경우 외환위기로 비화될 가능성은 희박하다는 것이 국내외의 인식임
— 기업과 금융기관의 재무건전성이 크게 향상
— 대외결제 및 외환시장의 불안 진정에 필요한 수준의 외환보유액을 확보
— 경상수지 적자와 자본 순유출 ,
유동외채 상환 등을 감안해도 외환보유액 수준은 부족하지 않음• 유동외채(6월 말 기준)인 2223억 달러보다도 많은 수준
• 1997년 12월 외환위기 당시에도 단기외채의 32%가 만기 연장
□ 통화폭락사태 만으로도 거시경제의 운영에 미치는 악영향은 심대하다고 볼 수 있음
— 외환위기 가능성은 없어도 외환시장 불안은 장기화될 수 있음
— 외환시장 불안이 국내금융시장 경색으로 전염될 가능성
— 국내 금융시장 불안이 다시 외환시장에 악영향
- 26 -
<표 5> 1997년 외환위기와 최근 상황 비교
1997년 외환위기 당시 2008년
유사점
환율급등
1997년 1월 3일: 844.6원/달러 1997년 12월 31일: 1,415.2원/달러
(67.5% 상승)
2008년 1월 2일: 938.2원/달러 2008년 10월 10일: 1,420.3원/달러
(33.9% 상승)
경상수지적자 82.9억달러(1997년) 126억달러(2008년 1~8월)
단기외채/총외채 48.0%(1997년 6월) 41.8%(2008년 6월)
차이점
외환보유액 단기외채/외환보유액
순대외채권/GDP 유동외채/외환보유액
333억달러(1997년 6월) 264%(1997년 9월)
△
13.2%(1997년) 973.0%(1997년)2,396.7억달러(2008년 9월) 68.1%
0.3%(2008년 6월) 86.1%(2008년 6월) 고정투자/GDP
기업부채비율 기업이익/GDP
36.8%(1995~1997년 평균) 424.6%(1997년 말) 0.63%(1995~1997년 평균)
29.0%(2005~2007년 평균) 92.5%(2008년 3월) 5.12%(2002~2007년 평균)
은행BIS자기자본비율 7.0%(1997년) 11.36%(2008년 6월)
자료: 한국은행, 금융감독원
- 27 -
3)
외채 문제— 2008년 6월 말 현재 총외채 4,198억 달러 중 실제 상황보담이 있는 외채규모는 2,680억 달러
• 한국은행은 추정한 상환부담이 없는 외채는 1,518억 달러라고 추정
*
환헤지용 해외차입(938억 달러), 선박 수출선수금(509억 달러) ,
직접투자 중 대부투자(71억 달러)
—
유동외채 비율은2008년 6월말 외은지점 외채를 제외할 경우 54.4%로 하락