377
서 론어류가활동하고성장하기위해서는수십가지의필수영양소 와에너지가필요한데
,
이중에서도단백질은어류의성장에가 장큰영향을미치는필수영양소이다.
또한,
사료의영양성분 중단백질함량이차지하는비율이매우높고,
사료에배합되는 단백질원의가격이비싸기때문에,
양식대상어종의적정사료 단백질함량을구명하는것은경제적인배합사료개발에필수 적이다.
단백질뿐아니라비단백질유래의에너지함량도양어 사료설계시매우중요한역할을담당하고있다.
즉,
사료의에너지함량이낮으면어체내에서단백질을분해하여에너지원 으로사용하기때문에단백질효율이낮아지고
,
사료중에단백 질원이차지하는단가가높기때문에그만큼양식생산비용이 높아지게된다.
반대로사료의에너지가높으면,
사료섭취량이 줄어들어최적성장에필요한필수영양소의섭취가상대적으 로줄어들어성장이저해되고어체에지방축적이높아져품질이저하된다
(NRC, 2011).
이와같이사료의단백질에대한에너지의함량이나비율이맞지않으면
,
양식어류생산에소요되 는사료단가가상승할뿐아니라사료유래의수질오염원이증 가될수있기때문에사료의적정단백질과에너지함량에관한 Article history;Received 24 April 2013; Revised 15 July 2013; Accepted 22 July 2013
*Corresponding author: Tel: +82 . 33. 640. 2414 Fax: +82. 33. 640. 2955 E-mail address: [email protected]
Kor J Fish Aquat Sci 46(4) 377-383, August 2013 http://dx.doi.org/10.5657/KFAS.2013.0377 pISSN:0374-8111, eISSN:2287-8815
ⓒ The Korean Society of Fishereis and Aquatic Science. All rights reserved
배합사료의 단백질 및 지질 함량이 종어(Leiocassis longirostris Gunther) 치어의 성장과 체성분에 미치는 효과
We ran a feeding trial to determine optimal dietary protein and lipid levels for growth of juvenile long snout bullhead Leiocassis longirostris Gunther. Eight experimental diets (P20L7, P20L14, P30L7, P30L14, P40L7, P40L14, P50L7 and P50L14) were formulated to contain 20%, 30%, 40% or 50% protein combined with either 7% or 14% lipid.
Three replicate groups of fish (mean mass: 3.9 g/fish) were fed one of the experimental diets ad libitum for 8 weeks.
Survival of fish fed the P20L14 diet was lower than that of fish fed the P40L14, P50L7 and P50L14 diets. Growth of fish fed diets containing 7% lipid increased with increasing protein level (up to 50% protein); growth of fish fed diets containing 14% lipid increased with increasing protein level (up to 30% protein). The feed efficiency of fish fed a diet with 50% protein and 7% lipid was higher than that of other groups. Whole body moisture and lipid contents were affected by dietary lipid level but not by dietary protein level. The crude lipid contents of fish fed 14% lipid diets were higher than those fed 7% lipid diets across all protein levels (other than the 50% level). Thus, under our experimental conditions, an increase in dietary protein level improved growth and feed efficiency of fish; a diet containing 50%
protein with 7% lipid was optimal for growth and effective feed utilization in juvenile long snout bullhead.
Key words: Dietary protein and lipid, Leiocassis longirostris Gunther, Growth
국립수산과학원 내수면양식연구센터, 1순천향대학교 생명시스템학과, 2강릉원주대학교 해양생물공학과
Sang Gu Lim, Hyoung Kyun Han, In Chul Bang1, Jin Choi2 and Sang-Min Lee2*
임상구ㆍ한형균ㆍ방인철
1ㆍ최진
2ㆍ이상민
2*Effect of Dietary Protein and Lipid Levels on the Growth and Body Composition of Juvenile Long Snout Bullhead
Leiocassis longirostris Gunther
Inland Aquaculture Research Center, National Fisheries Research & Development Institute, Changwon 645-806, Korea
1 Department of Life Science and Biotechnology, Soonchunhyang University, Asan 336-745, Korea
2Department of Marine Bioscience and Technology, Gangneung-Wonju National University, Gangneung 210-702, Korea
연구는매우중요하다
(Hillestad et al., 2001).
사료의에너지함 량은지질이나탄수화물함량을달리첨가하여조절하는데,
어 류의식성,
사료성형등을고려하여배합사료의원료들을선정 하여조성한다.
사료단백질을절약할수있는방안은섭취된사 료의단백질이어류의성장에효율적으로사용될수있도록사 료의비단백질유래의에너지함량을적절히사료에배합하는 것이다(NRC, 2011).
즉,
어류가섭취한사료의비단백질에너지원으로지질이나탄수화물을최대로이용할수있도록하는 사료영양소조성표를제시하는것이다
.
이러한비단백질에너 지원의이용은어류의식성등에따라서달라지는데,
일반적으 로육식성이나잡식성어류들이초식성어류들보다지질이용 성높고,
초식성이강한어류는육식성이나잡식성어류보다탄 수화물이용성이높은것으로알려져있다.
종어
(Leiocassis longirostris Gunther)
는메기목동자개과종Table 1. Ingredient and proximate composition of experimental diets
Diets
P20L7 P20L14 P30L7 P30L14 P40L7 P40L14 P50L7 P50L14
Ingredients (air-dried %)
Pollack fish meal 14.0 14.0 32.0 32.0 50.0 50.0 68.0 68.0
Wheat flour 55.0 40.0 45.0 30.0 35.0 20.0 25.0 10.0
Corn gluten meal 4.0 7.0 3.0 6.0 2.0 5.0 1.0 4.0
α-Potato starch 1.0 6.0 1.0 6.0 1.0 6.0 1.0 6.0
Squid liver oil 3.0 3.0 2.0 2.0 1.0 1.0
Soybean oil 1.0 4.5 1.0 4.5 1.0 4.5 1.0 4.5
Linseed oil 1.0 4.5 1.0 4.5 1.0 4.5 1.0 4.5
α-Cellulose 18.0 18.0 12.0 12.0 6.0 6.0
Vitamin premix1 1.0 1.0 1.0 1.0 1.0 1.0 1.0 1.0
Mineral premix2 1.0 1.0 1.0 1.0 1.0 1.0 1.0 1.0
Vitamin C (50%) 0.5 0.5 0.5 0.5 0.5 0.5 0.5 0.5
Choline salt (50%) 0.3 0.3 0.3 0.3 0.3 0.3 0.3 0.3
Taurine 0.2 0.2 0.2 0.2 0.2 0.2 0.2 0.2
Nutrient content (dry matter basis)
Crude protein (%) 20.9 20.2 31.5 31.0 41.1 41.6 51.5 51.6
Crude lipid (%) 6.7 14.6 6.7 13.9 6.6 13.2 6.6 13.4
Crude fiber (%)3 18.6 18.6 12.6 12.6 6.6 6.6 0.6 0.6
Ash (%) 5.0 4.6 8.7 8.8 13.3 12.7 16.6 16.4
Carbohydrate (%)4 48.8 42.0 40.5 33.7 32.4 25.9 24.7 18.0
Energy (MJ/kg diet)5 15.9 17.7 17.0 18.5 17.8 19.4 18.9 20.4
P:E ratio (g/MJ) 13.1 11.4 18.6 16.8 23.1 21.5 27.3 25.3
Non-protein E/protein ratio (MJ/mg) 52.7 64.1 30.5 36.3 19.9 23.1 13.3 16.2
Essential amino acid composition (% inprotein)
Arg 5.1 4.9 5.7 5.9 6.3 6.1 6.5 6.4
His 2.4 2.3 2.6 2.4 2.3 2.6 2.4 2.2
Ile 3.4 3.4 2.7 2.7 3.7 3.5 3.5 3.7
Leu 8.4 8.8 8.0 8.6 8.2 8.5 8.0 8.5
Lys 5.2 5.6 6.6 6.4 6.9 7.2 7.4 7.1
Met+Cys 3.6 3.6 3.6 2.8 4.0 3.8 3.9 3.7
Phe+Tyr 7.0 7.6 6.7 7.0 7.2 7.0 6.8 7.3
Thr 4.1 3.9 4.5 4.6 4.5 4.8 4.8 4.7
Val 4.1 4.1 3.5 3.4 4.3 4.3 4.2 4.2
1 Vitamin premix contained the following amount which were diluted in cellulose (g/kg mix): DL-α-tocopheryl acetate, 18.8; thiamin hydrochloride, 2.7; riboflavin, 9.1; pyridoxine hydrochloride, 1.8; niacin, 36.4; Ca-D-pantothenate, 12.7; myo-inositol, 181.8;
D-biotin, 0.27; folic acid (98%), 0.68; p-aminobenzoic acid, 18.2; menadione, 1.8; retinyl acetate, 0.73; cholecalciferol, 0.003;
cyanocobalamin, 0.003.
2 Mineral premix contained the following ingredients (g/kg mix): MgSO4·7H2O, 80.0; NaH2PO4∙2H2O, 370.0; KCl, 130.0; Ferric citrate, 40.0; ZnSO4·7H2O, 20.0; Ca-lactate, 356.5; CuCl, 0.2; AlCl3·6H2O, 0.15; KI, 0.15; Na2Se2O3, 0.01; MnSO4∙H2O, 2.0; CoCl2·6H2O, 1.0.
3 Calculated based on the crude fiber content of ingredients.
4 Calculated, 100 - (crude protein + crude lipid + crude fiber + ash).
5 Calculated based on 23.4 MJ/kg protein, 39.2 MJ/kg lipid and 17.2 MJ/kg carbohydrate.
어속에속하는담수어류로서최근에중국을비롯하여한국에 서도고급양식대상종으로잠재력이높은종이다
(Pei et al.,
2004).
종어는육식성으로소형어류나저서갑각류를섭취하는것으로보고되어있다
(Xie et al., 1998).
이미중국의학자들 이종어사료의탄수화물과지질이용성에대해연구를수행하 였으나(Pei et al., 2004; Tan et al., 2007;),
그연구가매우제한 적이다.
육식성인종어의단백질요구는높을것으로추정되지 만,
단백질요구량과관련된연구는미비한실정이다.
또한,
육 식성어류는탄수화물보다지질의이용성이높기때문에단백 질과지질의상호적인영향을조사하는것이필요하다고판단 되어본연구를수행하였다.
재료 및 방법
실험사료
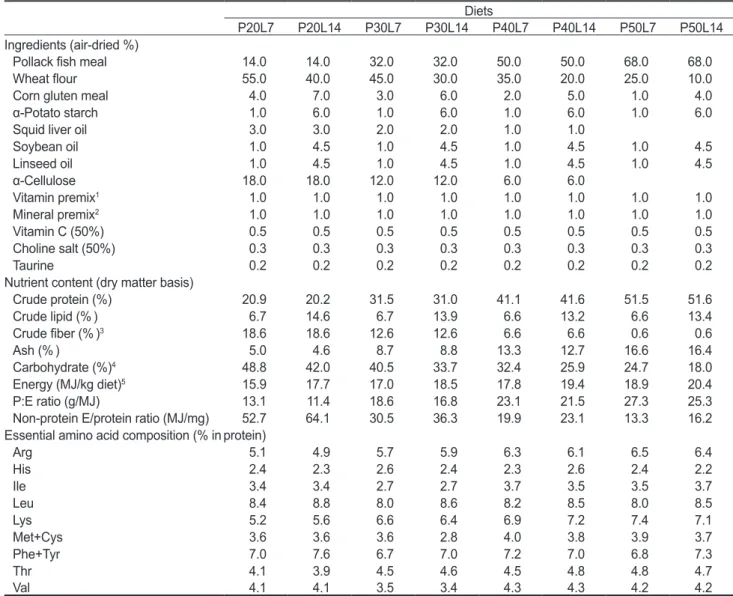
실험사료의원료조성과영양소분석결과를
Table 1
에나타 내었다. 4×2 factorial
디자인으로4
종류의단백질함량(20%, 30%, 40%
및50%)
과2
종류의지질함량(7%
및14%)
을함유 하고있는총8
종류의실험사료를제조하였다.
실험사료의단백 질원으로어분을사용하였고,
지질원으로어유,
대두유및아마 인유를각각사용하였다.
탄수화물원으로소맥분을사용하였 고,
사료의단백질과지질함량은이원료들의첨가비로조절하 였다.
이와같이설계된원료들을잘혼합한후원료100 g
당물30 g
을첨가하여moist pellet
제조기로압출성형한후,
실온에서건조시켜
-30℃
에냉동보관하면서사용하였다.
실험사료의지방산조성은
Table 2
에나타내었다. 실험어 및 사육관리
실험어는 국립수산과학원내수면양식연구소에서종묘생산 된종어치어를사용하였다
.
실험어는2
주간실험수조에순치 시킨후,
외형적으로건강한평균체중3.9±0.20 g
의종어치어를선별하여총
24
개의400 L
수조에각각20
마리씩3
반복 으로수용하여8
주간사육실험하였다.
사육수는지하수를사 용하였으며,
사육기간동안수온은24.1±0.82˚C
였고,
각수조 마다약하게폭기시켜산소를공급하였다.
실험사료는1
일2
회
(9:00, 17:00)
실험어가먹을때까지손으로만복공급하였다
.
사육기간중죽은개체는매일제거하였으며,
하루에한번(13:00)
수조청소를실시하고,
일일사료섭취량과폐사어등은매일기록하였다
. 어체측정 및 성분분석
어체측정은사육실험시작시와종료시에측정전일절식시 킨후
tricaine methanesulfonate (MS 222, Sigma, St. Louis,
MO, USA) 100 ppm
수용액에마취시켜수조에수용된실험어의무게를측정하였다
.
사육종료시에혈액성분의변화를조사하기위해헤파린이처리된
1 mL
주사기를사용하여실험어의미부혈관에서채혈하였으며
,
채혈한혈액은7,500×g
에서10
분간원심분리하여얻은혈청을동결보존
(-70˚C)
하였다.
혈액분석은임상용
kit (Asan pharmaceutical Co., Seoul, Korea)
를 사용하여total protein
은burette
법으로glucose
는효소법으로, cholesterol
은COD-POD
법을사용하여각각분석하였다.
실험 사료및어체의일반성분은AOAC (1995)
방법에따라,
조단백 질(N×6.25)
은Auto Kjeldahl system (Buchi B-324/435/412, Switzerland; Metrohm 8-719/806, Swizerland)
을 사용하여 분석하였고,
조지방은ether
로 추출하여 측정하였으며,
수분 은105˚C dry oven
에서6
시간동안건조후측정하였고,
회분 은600˚C
회화로에서4
시간동안태운후측정하였다.
지방산 분석은Folch et al. (1957)
의방법에따라총지질을추출하여14% BF
3-methanol (Sigma, USA)
용액으로지방산을meth- ylation
시킨후, capillary column (SP
TM-2560, 100 m × 0.25 mm i. d., film thickness 0.20 μm, USA)
이장착된gas chroma- tography (Perkin Elmer, Clarus 600, USA)
로지방산을분석 하였다. Carrier gas
는헬륨을사용하였으며, oven
온도는최초140˚C
에서240˚C
까지4˚C/min
증가시켰다.
이때, injector
온 도는240˚C, detector (FID)
온도는240˚C
로각각설정하였으 며,
표준지방산으로37
개지방산혼합물(PUFA 37 Component FAME Mix, USA)
을사용하였다.
아미노산은시료를6 N HCl
로110˚C sand bath
상에서24
시간가수분해한후,
감압농축 하고, Automatic amino acid analyzer (L-8800, Hitachi, Col- umn : Ion exchange, Injection Pump : Pressure 0-19.6Mpa, Flow Rate 0.05-0.99 mL/min, Column Oven : Electrothermal cooling (30-70˚C), Reaction Unit : Reaction Column (135˚C, 50˚C), Photometer : Wavelength 570 nm, 440 nm)
를사용하 여분석하였다.
통계처리
결과의통계처리는
SPSS Version 20.0 (SPSS Inc., Chicago,
Table 2. Major fatty acid composition (% of the total fatty acids)of the experimental diets Fatty
acids
Diets P20L7 P20
L14 P30 L7 P30
L14 P40 L7 P40
L14 P50 L7 P50
L14
C14:0 1.9 1.3 2.0 1.2 1.8 1.3 1.8 1.2
C16:0 17.2 13.9 17.2 13.9 17.3 14.9 17.2 14.2 C16:1n 2.5 1.7 2.7 1.7 2.8 1.9 3.1 1.9
C18:0 2.8 3.7 3.4 3.7 3.7 4.2 3.9 4.2
C18:1n-9 19.9 21.7 19.6 22.1 19.3 21.0 20.1 21.2 C18:2n-6 33.5 32.3 26.5 28.3 20.9 26.0 15.7 20.6 C18:3n-3 7.8 16.9 8.0 13.9 6.7 12.9 6.2 13.9
C20:0 0.5 1.3 0.6 1.2 0.5 1.1 0.5 1.2
C20:5n-3 4.5 2.3 5.1 2.5 6.7 4.9 7.3 5.3 C22:5n-3 0.4 0.2 0.7 0.5 0.9 0.6 1.0 0.7 C22:6n-3 4.0 1.9 5.3 4.1 8.1 6.0 9.4 6.9
IL, USA) program
을사용하여One-way ANOVA-test
를실시 한후, Duncan’s multiple range test (Duncan, 1995)
로평균간 의유의성을검정하였으며, Two-way ANOVA-test
를통해실 험사료내단백질과지질함량의상호관계를조사하였다.
결 과
8
주간의사육실험종료후,
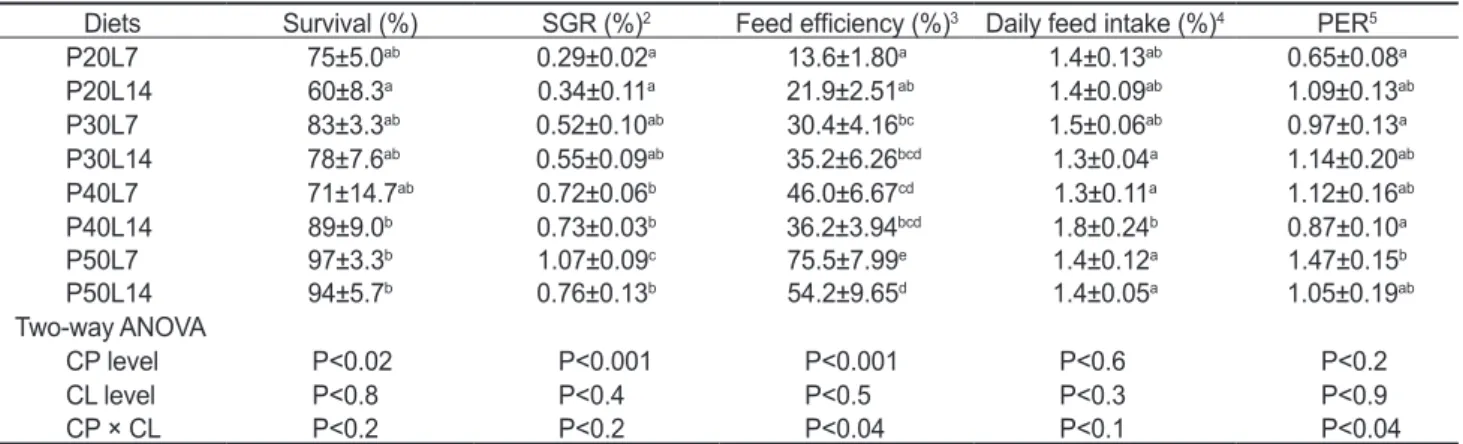
종어의성장및사료이용효율결과를
Table 3
에나타내었다.
사육기간동안에종어의생존율은사료내단백질함량에영향을받았으며
(P<0.02), P20L14
실험 구가P40L14, P50L7
및P50L14
실험구보다유의하게낮았다(P<0.05).
종어의일간성장율은사료내단백질함량에영향을받았으며
(P<0.001), P50L7
실험구가가장높은값을나타내었 다.
종어의성장은사료지질7%
실험구에서사료단백질함량이증가함에따라높아졌고
,
사료지질14%
실험구에서는사료단백질
30%
이상에서유의한차이가없었다.
사료효율은사료내단백질함량에영향을받았으며
(P<0.001), P50L7
실험구 가가장높은값을나타내었다(P<0.05).
일일사료섭취율은사 료내단백질및지질 함량에영향을받지 않았으며(P>0.05), P30L14, P40L7, P50L7
및P50L14
실험구가P40L14
실험구보다유의하게낮았다
(P<0.05).
단백질효율은사료내단백질과지질함량에영향을받지않았으며
, P50L7
실험구가P20L7, P30L7
및P40L14
실험구보다유의하게높았다(P<0.05).
전어체의일반성분분석결과를
Table 4
에나타내었다.
전어체의수분및지질함량은사료내지질함량에영향을받았지만
(P<0.01),
사료내단백질함량에는영향을받지않았다.
수분함량은사료단백질함량
40%
및50%
실험구에서차이가없었으나
,
단백질함량20%
및30%
실험구들에서는지질함량이증가함에따라낮아지는경향이나타났다
.
전어체의지질함량은사료단백질
50%
실험구에서는차이가없었으나,
단백질함량20%, 30%
및40%
실험구에서는사료지질함량이높을수록유의하게 높아지는경향을보였다
(P<0.05).
전어체의단백질함량은사료내지질함량에영향을받지않았지만
,
사료내단백 질함량이높을수록높아지는경향을보였다. P30L14, P40L7, P40L14, P50L7
및P50L14
사료를섭취한실험어의전어체단 백질함량은P20L7, P20L14
및P30L7
사료를섭취한실험어보 다유의하게높았다(P<0.05).
전어체의회분함량은사료내단 Table 3. Growth performance and feed utilization of juvenile long snout bullhead Leiocassis longirostris Gunther (initial body weight, 3.9±0.18 g/fish) fed the experimental diets containing different protein (CP) and lipid (CL) levels for 8 weeks1Diets Survival (%) SGR (%)2 Feed efficiency (%)3 Daily feed intake (%)4 PER5
P20L7 75±5.0ab 0.29±0.02a 13.6±1.80a 1.4±0.13ab 0.65±0.08a
P20L14 60±8.3a 0.34±0.11a 21.9±2.51ab 1.4±0.09ab 1.09±0.13ab
P30L7 83±3.3ab 0.52±0.10ab 30.4±4.16bc 1.5±0.06ab 0.97±0.13a
P30L14 78±7.6ab 0.55±0.09ab 35.2±6.26bcd 1.3±0.04a 1.14±0.20ab
P40L7 71±14.7ab 0.72±0.06b 46.0±6.67cd 1.3±0.11a 1.12±0.16ab
P40L14 89±9.0b 0.73±0.03b 36.2±3.94bcd 1.8±0.24b 0.87±0.10a
P50L7 97±3.3b 1.07±0.09c 75.5±7.99e 1.4±0.12a 1.47±0.15b
P50L14 94±5.7b 0.76±0.13b 54.2±9.65d 1.4±0.05a 1.05±0.19ab
Two-way ANOVA
CP level P<0.02 P<0.001 P<0.001 P<0.6 P<0.2
CL level P<0.8 P<0.4 P<0.5 P<0.3 P<0.9
CP × CL P<0.2 P<0.2 P<0.04 P<0.1 P<0.04
1 Values (mean±SE of three replications) in the same column not sharing a common superscript are significantly different (P<0.05).
2 Specific growth rate (%/day) = [ln (final fish wt.) - ln (initial fish wt.)] × 100 / days of feeding.
3 Wet weight gain × 100 / feed intake.
4 Feed intake × 100 / [(initial fish wt. + final fish wt. + dead fish wt.) × days reared/2].
5 Protein efficiency ratio = wet weight gain / protein intake.
Table 4. Proximate composition (%) of the whole body in juvenile long snout bullhead Leiocassis longirostris Gunther fed the diets containing different protein (CP) and lipid (CL) levels for 8 weeks1
Diets Moisture Crude
protein Crude lipid Ash
Initial 79.2 12.9 2.4 3.1
P20L7 77.3±0.58b 12.0±0.07a 4.0±0.35a 3.3±0.15ns P20L14 74.7±0.90a 12.4±0.13a 5.7±0.59b 3.6±0.29 P30L7 77.6±0.70b 12.4±0.38a 4.0±0.17a 3.3±0.07 P30L14 74.6±0.26a 13.6±0.21b 5.7±0.64b 3.2±0.12 P40L7 75.9±0.24ab 14.0±0.15b 4.8±0.09a 3.2±0.15 P40L14 76.2±0.87ab 13.2±0.48b 6.1±0.52b 3.0±0.03 P50L7 75.6±0.38ab 13.8±0.06b 5.8±0.35b 3.1±0.12 P50L14 75.8±0.12ab 13.8±0.12b 5.6±0.15b 3.5±0.12 Two-way ANOVA
CP level P<0.9 P<0.001 P<0.3 P<0.3 CL level P<0.01 P<0.3 P<0.001 P<0.4 CP × CL P<0.02 P<0.01 P<0.02 P<0.1
1 Values (mean±SE of three replications) in the same column not sharing a common superscript are significantly different (P<0.05).
ns: Not significant (P>0.05).
백질및지질함량에영향을받지않았다
(P>0.05).
전어체의 필수아미노산 분석 결과를
Table 5
에 나타내 었다.
전어체 단백질의histidine, leucine, lysine
및pheny lalanine +tyrosine
함량은사료내단백질함량에영향을받았 으며,
사료단백질함량이증가할수록이들아미노산의함량은 증가하는경향을보였고,
다른아미노산함량은사료내단백질 함량에영향을받지않았다.
또한,
전어체의모든필수아미노산 은사료내지질함량에는영향을받지않았다.
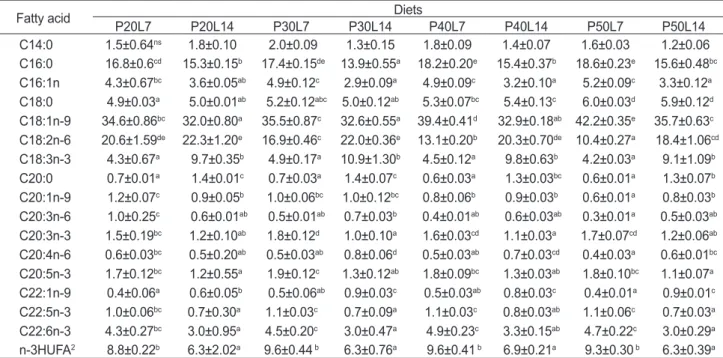
전어체지질의지방산조성을
Table 6
에나타내었다.
어체지질중의주요지방산 인C16:0, C18:1n-9, C18:2n-6, C18:3n-3, EPA
및DHA
의함 량은사료지질의지방산조성과유사한경향을보였다.
어체의 미부동맥에서채혈한혈액성상을Table 7
에나타내었다. Total protein
및glucose
는사료내단백질및지질함량에영향을받 지않아실험구간유의차가없었다(P>0.05). Cholesterol
은사 료내단백질함량에영향을받았으며(P<0.001),
사료내단백질 함량이증가함에따라높아지는경향을보였다.
Table 5. Essential amino acids (% in protein) of the whole body in juvenile long snout bullhead Leiocassis longirostris Gunther fed the diets containing different protein (CP) and lipid (CL) levels for 8 weeks1
Diets Arg His Ile Leu Lys Met + Cys Phe + Tyr Thr Val
P20L7 6.5±0.09 ns 2.3±0.01ab 3.1±0.28 ns 7.8±0.07 ns 8.4±0.06a 3.4±0.03 ns 6.8±0.24a 4.7±0.07 ns 3.5±0.25 ns P20L14 6.7±0.15 2.2±0.06a 3.0±0.32 7.7±0.10 8.3±0.01a 3.1±0.10 6.8±0.07a 4.9±0.34 3.3±0.35 P30L7 6.6±0.12 2.3±0.03ab 3.0±0.32 7.8±0.15 8.4±0.15a 3.2±0.12 7.0±0.09ab 4.7±0.09 3.3±0.29 P30L14 6.7±0.15 2.3±0.01ab 2.9±0.30 7.8±0.20 8.4±0.15a 3.3±0.03 7.0±0.06ab 4.8±0.07 3.3±0.26 P40L7 6.6±0.09 2.4±0.01b 3.1±0.24 7.9±0.09 8.6±0.09b 3.3±0.15 7.2±0.12b 5.0±0.22 3.4±0.23 P40L14 6.5±0.12 2.4±0.06b 3.0±0.36 8.1±0.12 8.8±0.12b 3.4±0.09 7.3±0.09b 5.6±0.79 3.4±0.36 P50L7 6.3±0.12 2.5±0.06b 3.5±0.21 8.2±0.10 8.7±0.09b 3.5±0.07 7.3±0.13b 4.9±0.03 3.8±0.20 P50L14 6.3±0.06 2.4±0.03b 3.5±0.22 8.0±0.03 8.7±0.01b 3.4±0.06 7.2±0.03b 4.8±0.03 3.8±0.18 Two-way ANOVA
CP level P<0.05 P<0.001 P<0.3 P<0.04 P<0.002 P<0.1 P<0.002 P<0.3 P<0.3 CL level P<0.5 P<0.1 P<0.8 P<0.7 P<0.6 P<0.4 P<0.8 P<0.3 P<0.7 CP × CL P<0.9 P<0.6 P<1.0 P<0.6 P<0.4 P<0.3 P<0.8 P<0.7 P<1.0
1 Values (mean±SE of three replications) in the same column not sharing a common superscript are significantly different (P<0.05).
ns: Not significant (P>0.05).
Table 6. Major fatty acid composition (% of the total fatty acids) of whole body in juvenile long snout bullhead Leiocassis longirostris Gunther fed the diets containing different protein and lipid levels for 10 weeks1
Fatty acid Diets
P20L7 P20L14 P30L7 P30L14 P40L7 P40L14 P50L7 P50L14
C14:0 1.5±0.64ns 1.8±0.10 2.0±0.09 1.3±0.15 1.8±0.09 1.4±0.07 1.6±0.03 1.2±0.06 C16:0 16.8±0.6cd 15.3±0.15b 17.4±0.15de 13.9±0.55a 18.2±0.20e 15.4±0.37b 18.6±0.23e 15.6±0.48bc C16:1n 4.3±0.67bc 3.6±0.05ab 4.9±0.12c 2.9±0.09a 4.9±0.09c 3.2±0.10a 5.2±0.09c 3.3±0.12a C18:0 4.9±0.03a 5.0±0.01ab 5.2±0.12abc 5.0±0.12ab 5.3±0.07bc 5.4±0.13c 6.0±0.03d 5.9±0.12d C18:1n-9 34.6±0.86bc 32.0±0.80a 35.5±0.87c 32.6±0.55a 39.4±0.41d 32.9±0.18ab 42.2±0.35e 35.7±0.63c C18:2n-6 20.6±1.59de 22.3±1.20e 16.9±0.46c 22.0±0.36e 13.1±0.20b 20.3±0.70de 10.4±0.27a 18.4±1.06cd C18:3n-3 4.3±0.67a 9.7±0.35b 4.9±0.17a 10.9±1.30b 4.5±0.12a 9.8±0.63b 4.2±0.03a 9.1±1.09b C20:0 0.7±0.01a 1.4±0.01c 0.7±0.03a 1.4±0.07c 0.6±0.03a 1.3±0.03bc 0.6±0.01a 1.3±0.07b C20:1n-9 1.2±0.07c 0.9±0.05b 1.0±0.06bc 1.0±0.12bc 0.8±0.06b 0.9±0.03b 0.6±0.01a 0.8±0.03b C20:3n-6 1.0±0.25c 0.6±0.01ab 0.5±0.01ab 0.7±0.03b 0.4±0.01ab 0.6±0.03ab 0.3±0.01a 0.5±0.03ab C20:3n-3 1.5±0.19bc 1.2±0.10ab 1.8±0.12d 1.0±0.10a 1.6±0.03cd 1.1±0.03a 1.7±0.07cd 1.2±0.06ab C20:4n-6 0.6±0.03bc 0.5±0.20ab 0.5±0.03ab 0.8±0.06d 0.5±0.03ab 0.7±0.03cd 0.4±0.03a 0.6±0.01bc C20:5n-3 1.7±0.12bc 1.2±0.55a 1.9±0.12c 1.3±0.12ab 1.8±0.09bc 1.3±0.03ab 1.8±0.10bc 1.1±0.07a C22:1n-9 0.4±0.06a 0.6±0.05b 0.5±0.06ab 0.9±0.03c 0.5±0.03ab 0.8±0.03c 0.4±0.01a 0.9±0.01c C22:5n-3 1.0±0.06bc 0.7±0.30a 1.1±0.03c 0.7±0.09a 1.1±0.03c 0.8±0.03ab 1.1±0.06c 0.7±0.03a C22:6n-3 4.3±0.27bc 3.0±0.95a 4.5±0.20c 3.0±0.47a 4.9±0.23c 3.3±0.15ab 4.7±0.22c 3.0±0.29a n-3HUFA2 8.8±0.22b 6.3±2.02a 9.6±0.44 b 6.3±0.76a 9.6±0.41 b 6.9±0.21a 9.3±0.30 b 6.3±0.39a
1 Values (mean±SE of three replications) in the same row not sharing a common superscript are significantly different (P<0.05).
2 High unsaturated fatty acid (C ≥20).
ns: Not significant (P>0.05).