371
서 론성장이빠르고건강한양식어류를생산하기위해서는먼저 대상종의필수영양소요구에대한연구를수행하여그종에적 합한배합사료를개발하여야한다
.
필수영양소중에서단백질 은어류의성장에가장많은영향을미치는중요한요소일뿐 아니라,
단백질원료가격이비싸기때문에사료단가에도영 향을미칠수있다(Lovell, 1989).
일반적으로육식성어류에서 사료내단백질함량의증가는어류생산성을향상시키지만단 백질함량이증가할수록사료단가는높아진다.
어류의성장을 위한단백질의이용성은지질이나탄수화물과같은비단백질 에너지원으로사료단백질을부분적으로대체함으로서향상될수있다
(Lee et al., 2002).
하지만,
과잉의사료에너지는사료 섭취를감소시켜성장을위한필수영양소의섭취가부족할수 있다.
이와반대로,
사료내비단백질에너지가불충분하면체 내에서단백질이에너지로사용되어단백질이낭비될수있을 뿐아니라단백질이에너지로전환될때발생되는암모니아는 수질을악화시킨다.
따라서섭취된사료단백질이체내에서단 백질합성외의목적으로사용되지않도록사료단백질이용성 을향상시키는것은중요하다.
배합사료의단백질을절약하기 위해비단백질유래의에너지함량을증가시키는연구가여러 어종에대해연구되고있다(NRC, 2011).
특히,
지질은에너지가
(value)
가높은영양소로초식성어류보다잡식성이나육식성어류들에서더쉽게이용되며
,
필수지방산공급원으로양식Article history;
Received 24 April 2013; Revised 7 June 2013; Accepted 22 July 2013
*Corresponding author: Tel: +82 . 33. 640. 2414 Fax: +82. 33. 640. 2955 E-mail address: [email protected]
Kor J Fish Aquat Sci 46(4) 371-376, August 2013 http://dx.doi.org/10.5657/KFAS.2013.0371 pISSN:0374-8111, eISSN:2287-8815
ⓒ The Korean Society of Fishereis and Aquatic Science. All rights reserved
A feeding trial was conducted to determine the optimum dietary protein and lipid levels for the growth of juvenile muddy loach Misgurnus anguillicaudatus . Eight experimental diets (designated as P20L7, P20L14, P30L7, P30L14, P40L7, P40L14, P50L7 and P50L14) were formulated to contain 20%, 30%, 40% and 50% protein with 7% and 14% lipid. Three replicate groups of muddy loach (1.5 g/fish) were fed one of the experimental diets ad libitum for 8 weeks. Survival of fish fed the P20L14 diet was lower than in other groups ( P <0.05). Specific growth rate (SGR) and feed efficiency (FE) of fish were affected by dietary protein ( P <0.05) and lipid ( P <0.005) levels. SGR and FE of fish tended to decrease with increasing dietary lipid level at the same protein level. There were no significant differences in SGR and FE among fish fed diets containing different protein levels ranging from 30% to 50% with the same lipid level. Whole body moisture and lipid contents were affected by dietary protein and lipid levels. Crude lipid content of fish fed the 14% lipid diets was higher than that of fish fed 7% lipid diets at each protein level. The results of this study indicate that a diet containing 30% protein with 7% lipid would be suitable for the optimum growth and effec- tive feed utilization of juvenile muddy loach.
Key words: Dietary protein and lipid, Misgurnus anguillicaudatus , Growth
미꾸리(Misgurnus anguillicaudatus) 치어 성장을 위한 사료의 적정 단백질 및 지질 함량
국립수산과학원 내수면양식연구센터, 1순천향대학교 생명시스템학과, 2강릉원주대학교 해양생물공학과
Kwang Seog Kim, Sang Gu Lim, In Chul Bang1, Jin Choi2 and Sang-Min Lee2*
김광석ㆍ임상구ㆍ방인철
1ㆍ최 진
2ㆍ이상민
2*Optimal Dietary Protein and Lipid Levels for Growth of Juvenile Muddy Loach Misgurnus anguillicaudatus
Inland Aquaculture Research Center, National Fisheries Research & Development Institute, Changwon 645-806, Korea
1
Department of Life Science and Biotechnology, Soonchunhyang University, Asan 336-745, Korea
2
Department of Marine Bioscience and Technology, Gangneung-Wonju National University, Gangneung 210-702, Korea
어의정상적인성장과체내대사에필수적인역할을하는영양 소이다
(Kim et al., 2002).
사료내비단백질에너지원의종류 나함량은어류의성장,
영양소이용률,
체지방조성등에영향 을미치므로,
이에대한연구가필요하다(Garling and Wilson, 1976; Daniels and Robinson, 1986; Sargent et al., 1989; Cho and Kaushik, 1990).
미꾸리
(Misgurnus anguillicaudatus)
는국내농약등록을위 한환경생물독성시험의시험종으로농촌진흥청고시를통해 지정되어있다.
미꾸리과에속하는국내토착어종인미꾸리는 동일과에속하는미꾸라지에비해몸통이가늘고원형에가까 운특징을지니고있으며,
우리나라에전국적으로분포하고있 다.
최근에미꾸리에대한수요가높아지고있지만,
미꾸리양 식에필요한자료는매우부족한실정이다.
따라서,
본연구에 서는미꾸리양식기술개발의일환으로배합사료제조에필요 한기초자료를제공하고자단백질및지질함량이다르게함유된배합사료가미꾸리치어의성장및체조성에미치는영향을 조사하였다
.
재료 및 방법
실험사료
실험사료의원료조성은
Table 1
에나타내었다. 4×2 factorial
디자인으로4
종류의단백질함량(20%, 30%, 40%
및50%)
과2
종류의지질함량
(7%
및14%)
을함유하고있는총8
종류의 실험사료를제조하였다.
실험사료의단백질원으로어분을지 질원으로어유,
대두유및아마인유를그리고탄수화물원으로 소맥분을각각사용하였고,
사료의단백질과지질함량은배합 되는원료들의비율에따라조절되었다.
이와같이설계된원 료들을잘혼합한후원료100 g
당물30 g
을첨가하여moist pellet
제조기로압출성형한후,
실온에서24
시간건조하였다.
Table 1. Ingredient and proximate composition of experimental dietsDiets
P20L7 P20L14 P30L7 P30L14 P40L7 P40L14 P50L7 P50L14
Ingredients (air-dried %)
Fish meal 14.0 14.0 32.0 32.0 50.0 50.0 68.0 68.0
Wheat flour 53.0 34.0 43.0 24.0 33.0 14.0 23.0 4.0
Corn gluten meal 4.0 7.0 3.0 6.0 2.0 5.0 1.0 4.0
α-potato-starch 0.0 9.0 0.0 9.0 0.0 9.0 0.0 9.0
Brewer yeast 3.0 3.0 3.0 3.0 3.0 3.0 3.0 3.0
Fish oil 3.0 3.0 2.0 2.0 1.0 1.0 0.0 0.0
Soybean meal 1.0 4.5 1.0 4.5 1.0 4.5 1.0 4.5
Linseed oil 1.0 4.5 1.0 4.5 1.0 4.5 1.0 4.5
α-Cellulose 18.0 18.0 12.0 12.0 6.0 6.0 0.0 0.0
Vitamin premix1 1.2 1.2 1.2 1.2 1.2 1.2 1.2 1.2
Mineral premix2 1.0 1.0 1.0 1.0 1.0 1.0 1.0 1.0
Vitamin C (50%) 0.5 0.5 0.5 0.5 0.5 0.5 0.5 0.5
Choline salt (50%) 0.3 0.3 0.3 0.3 0.3 0.3 0.3 0.3
Nutrient content (dry matter basis)
Crude protein (%) 19.9 19.8 30.5 30.4 41.0 40.9 51.5 51.4
Crude lipid (%) 6.8 13.9 6.9 14.0 6.9 14.0 7.0 14.1
Crude fiber (%)3 18.6 18.6 12.6 12.6 6.6 6.6 0.6 0.6
Ash (%) 4.8 6.3 8.2 9.8 11.7 13.2 15.1 16.7
Carbohydrate (%)4 49.9 41.3 41.8 33.3 33.8 25.3 25.8 17.2
Energy (MJ/kg diet)5 15.9 17.2 17.0 18.3 18.1 19.4 19.2 20.5
P:E ratio (g/MJ) 12.5 11.5 17.9 16.6 22.6 21.1 26.8 25.1
n-3HUFA(%)6 0.84 1.15 1.29 1.94 1.77 2.56 1.97 3.12
1 Vitamin premix contained the following amount which were diluted in cellulose (g/kg mix): DL-α-tocopheryl acetate, 18.8; thiamin hy- drochloride, 2.7; riboflavin, 9.1; pyridoxine hydrochloride, 1.8; niacin, 36.4; Ca-D-pantothenate, 12.7; myo-inositol, 181.8; D-biotin, 0.27;
folic acid (98%), 0.68; p-aminobenzoic acid, 18.2; menadione, 1.8; retinyl acetate, 0.73; cholecalciferol, 0.003; cyanocobalamin, 0.003.
2 Mineral premix contained the following ingredients (g/kg mix): MgSO4·7H2O, 80.0; NaH2PO4∙2H2O, 370.0; KCl, 130.0; Ferric citrate, 40.0; ZnSO4·7H2O, 20.0; Ca-lactate, 356.5; CuCl, 0.2; AlCl3·6H2O, 0.15; KI, 0.15; Na2Se2O3, 0.01; MnSO4∙H2O, 2.0; CoCl2·6H2O, 1.0.
3 Calculated based on the crude fiber content of ingredients.
4 Calculated, 100 - (crude protein + crude lipid + crude fiber + ash).
5 Calculated based on 23.4 MJ/kg protein, 39.2 MJ/kg lipid and 17.2 MJ/kg carbohydrate.
6 Highly unsaturated fatty acids (C≥20), calculated (dietary total lipid % × area % × 0.892). (Yoshimatsu et al., 1997).
그리고실험사료를실험어가섭취할수있는크기의
pellet size
로절단하여
-30℃
에보관하면서공급하였다.
실험사료의지방산조성은
Table 2
에나타내었다. 실험어 및 사육관리
실험어로국립수산과학원내수면양식연구센터에서종묘생산 된미꾸리치어를사용하였다
. 2
주간실험수조에서실험어를순 치시킨후,
외형적으로건강한평균체중1.49±0.10 g
의미꾸리 치어를선별하여총24
개의20 L
사각수조에각각30
마리씩3
반복으로 수용하여
8
주간사육하였다.
사육기간 동안수온은24.5±0.2˚C
였으며,
각수조마다약하게폭기시켜산소를공급하였다
.
실험사료는1
일2
회(9:00, 17:00)
실험어가먹을때까 지손으로만복공급하였다.
사육기간중죽은개체는매일제거하였으며
,
하루에한번(13:00)
환수하면서실험수조를청소하였다
.
일일사료섭취율과폐사어등은매일기록하였다. 어체측정 및 성분분석
어체측정은사육실험시작시와종료시에측정전일절식시 킨후
tricaine methanesulfonate (MS 222, Sigma, St. Louis,
MO, USA) 100 ppm
수용액에마취시켜실험어전체무게를측정하였다
.
실험사료,
어체의일반성분은AOAC (1990)
의방 법에따라조단백질(N×6.25)
은Auto Kjeldahl system (Buchi B-324/435/412, Switzerland; Metrohm 8-719/806, Swizer- land)
을사용하여분석하였고,
조지방은ether
추출법을사용하 였으며,
수분은105˚C dry oven
에서6
시간동안건조후측정하였고회분은
600˚C
회화로에서4
시간동안태운후측정하였다
.
지방산분석은Folch et al. (1957)
의방법에따라클로로 포름과메탄올혼합액(2:1)
으로총지질을추출하여14% BF
3- methanol (Sigma, USA)
용액으로지방산을methylation
시킨 후, capillary column (SP
TM-2560, 100 m×0.25 mm i. d., film thickness 0.20 um, USA)
이장착된gas chromatography (Per- kin Elmer, Clarus 600, USA)
로 지방산을 분석하였다. Car- rier gas
는헬륨을사용하였으며, oven
온도는최초140˚C
에서240˚C
까지4˚C/min
증가시켰다.
이때, injector
온도는240˚C, detector (FID)
온도는240˚C
로각각설정하였으며,
표준지방 산으로37
개지방산혼합물(PUFA 37 Component FAME Mix, USA)
을사용하였다.
Table 2. Fatty acid composition (% of the total fatty acids) of the experimental diets
Fatty acid Diets
P20L7 P20 L14 P30
L7 P30 L14 P40
L7 P40 L14 P50
L7 P50 L14 C14:0 2.4 1.5 2.4 1.7 2.4 1.6 2.0 1.7 C16:0 16.3 13.0 17.1 13.5 17.9 14.1 18.7 15.2 C18:0 4.0 3.3 4.7 4.2 6.0 5.5 7.8 6.2 C18:1n-9 16.3 17.2 15.0 15.9 14.1 15.2 13.5 15.1 C18:2n-6 28.6 29.9 21.8 23.4 14.8 18.6 10.1 14.4 C18:3n-6 0.4 1.0 0.4 1.0 0.2 0.8 0.2 0.2 C18:3n-3 8.2 18.0 7.3 16.3 5.4 14.3 3.9 12.6 C20:0 0.7 1.2 0.6 1.5 0.1 1.3 0.1 0.1 C21:0 1.3 0.9 1.0 0.8 0.8 0.6 0.8 0.6 C20:1n 0.5 0.3 0.4 0.3 0.4 0.3 0.3 0.3 C20:4n-6 0.3 0.1 0.3 0.2 0.4 0.3 0.4 0.3 C20:5n-3 4.4 2.9 5.3 3.8 6.2 4.5 6.3 5.1 C22:5n-3 0.8 0.5 1.5 1.1 2.1 1.5 2.4 1.9 C22:6n-3 8.7 5.9 14.1 10.6 20.4 14.5 22.9 17.8 n-3HUFA1 13.9 9.3 20.9 15.5 28.7 20.5 31.6 24.8
1 Highly unsaturated fatty acids (C≥20).
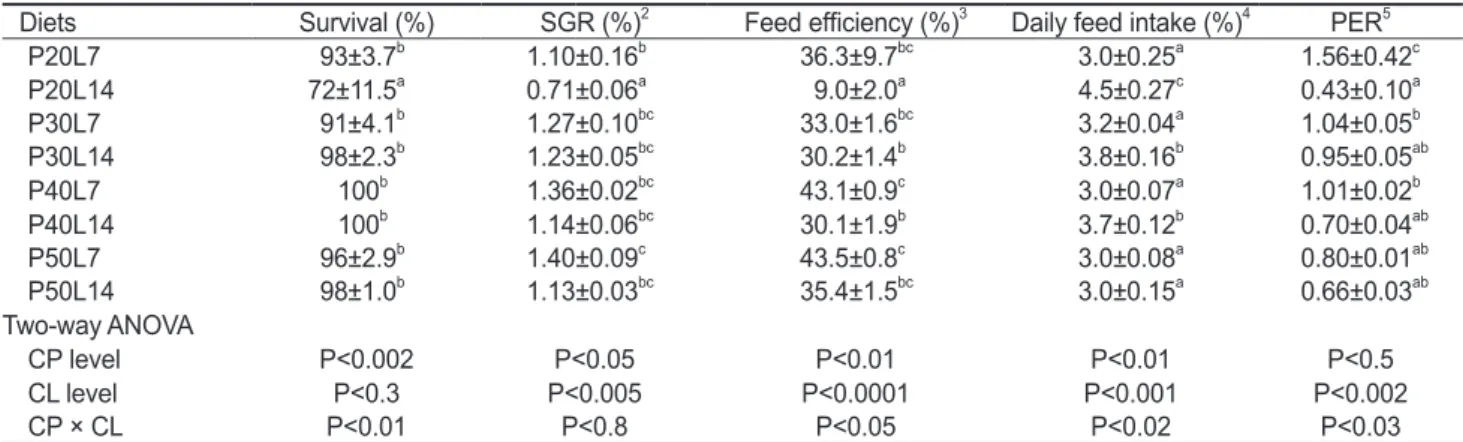
Table 3. Growth performance of juvenile muddy loach Misgurnus anguillicaudatus (initial body weight, 1.49±0.10 g/fish) fed the experimental diets containing different protein (CP) and lipid (CL) levels for 8 weeks1
Diets Survival (%) SGR (%)2 Feed efficiency (%)3 Daily feed intake (%)4 PER5
P20L7 93±3.7b 1.10±0.16b 36.3±9.7bc 3.0±0.25a 1.56±0.42c
P20L14 72±11.5a 0.71±0.06a 9.0±2.0a 4.5±0.27c 0.43±0.10a
P30L7 91±4.1b 1.27±0.10bc 33.0±1.6bc 3.2±0.04a 1.04±0.05b
P30L14 98±2.3b 1.23±0.05bc 30.2±1.4b 3.8±0.16b 0.95±0.05ab
P40L7 100b 1.36±0.02bc 43.1±0.9c 3.0±0.07a 1.01±0.02b
P40L14 100b 1.14±0.06bc 30.1±1.9b 3.7±0.12b 0.70±0.04ab
P50L7 96±2.9b 1.40±0.09c 43.5±0.8c 3.0±0.08a 0.80±0.01ab
P50L14 98±1.0b 1.13±0.03bc 35.4±1.5bc 3.0±0.15a 0.66±0.03ab
Two-way ANOVA
CP level P<0.002 P<0.05 P<0.01 P<0.01 P<0.5
CL level P<0.3 P<0.005 P<0.0001 P<0.001 P<0.002
CP × CL P<0.01 P<0.8 P<0.05 P<0.02 P<0.03
1Values (mean±SE of three replications) in the same column not sharing a common superscript are significantly different (P<0.05).
2Specific growth rate = [ln (final fish weight) – ln (initial fish weight)]×100/days reared.
3Wet weight gain×100 / feed intake.
4Feed intake×100 / [(initial fish wt. + final fish wt. + dead fish wt.)×days reared / 2].
5Protein efficiency ratio = (wet weight gain / protein intake).
통계처리
결과의통계처리는
SPSS Version 20.0 (SPSS Inc., Chicago, IL, USA) program
을사용하여One-way ANOVA-test
를실시 한후, Duncan’s multiple range test (Duncan, 1995)
로평균 간의유의성(P<0.05)
을검정하였으며, Two-way ANOVA-test
를통해실험사료내단백질과지질의상호관계를조사하였다.
결과 및 고찰
사육실험이끝난후
, 8
주간의성장및사료이용효율을Table 3
에나타내었다.
사육기간동안의생존율은사료내단백질함 량(P<0.002)
에영향을받았으며, P20L14
실험구가다른모든 실험구보다유의하게낮았다(P<0.05).
일일성장율은사료내 단백질(P<0.05)
및 지질 함량(P<0.005)
에 영향을 받았으며,
같은단백질함량에서지질함량이증가할때감소하는 경향이나타났다
. P50L7
실험구가가장높은일일성장율값을나타내었지만
, P30L7, P30L14. P40L7, P40L14
및P50L14
실험 구와는유의차가없었다.
사료효율은사료내단백질(P<0.01)
및지질함량(P<0.001)
에영향을받았으며,
같은단백질함량 에서지질함량이증가하면사료효율이감소하는경향을보였 다.
사료효율은P50L7
실험구가가장높은값을나타내었지만, P20L7, P30L7, P40L7
및P50L14
실험구와유의차는없었다(P<0.05).
일일사료섭취율은사료내단백질(P<0.01)
및지질 함량(P<0.001)
에영향을받았으며,
사료단백질함량50%
실험구에서는차이가없었으나
,
단백질20-40%
실험구에서는사료지질
7%
실험구가14%
실험구보다유의하게낮았다(P<0.05).
단백질효율은사료내지질함량
(P<0.002)
에영향을받았으며,
같은단백질함량에서지질함량이증가할때감소하는경향이 나타났다.
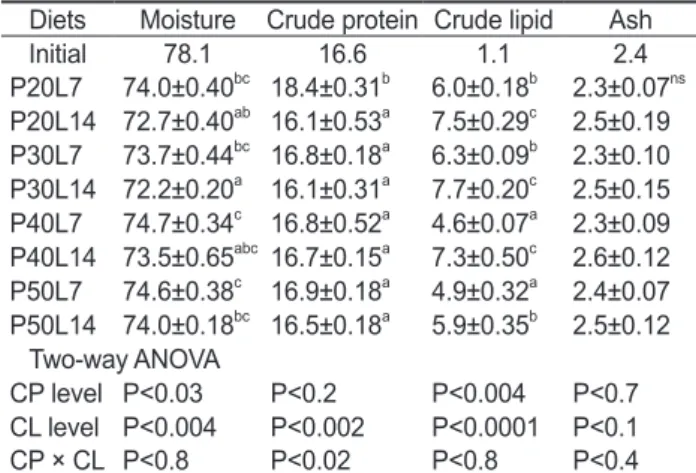
전어체의일반성분분석결과를
Table 4
에나타내었다.
전어체의수분및지질함량은사료내단백질및지질함량에영향 을받았고
,
단백질은사료지질함량에영향을받았다.
전어체 의수분함량은같은단백질함량에서지질함량이증가할때감 소하는경향이나타났으며, P40L7
및P50L7
실험구가P20L14
와
P30L14
실험구보다유의하게 높았다.
전어체의단백질은P20L7
실험구가가장높은값을나타내었다(P<0.05).
전어체의 지질함량은모든실험구에서사료지질14%
실험구가7%
실 험구보다유의하게높았다(P<0.05).
회분은사료내단백질및 지질에영향을받지않았다(P>0.05).
전어체의지방산조성변화를
Table 5
에나타내었다. C16:0, C18:1n-9, C18:2n-6, C18:3n-3
및n-3HUFA (highly unsatu- rated fatty acids)
의함량은사료의C16:0, C18:1n-9, C18:2n-6, C18:3n-3
및n-3HUFA
와비슷한경향으로조성되어있는것 으로보아미꾸리체내지방산조성은실험사료지방산조성 에직접적인영향을받는것으로나타났다.
동일한사료단백질함량에서
,
사료내지질함량이증가함에따라C18:2n-6
및C18:3n-3
의함량은증가한반면, C20:5n-3
및C22:6n-3
과같 은n-3HUFA
의함량은감소하는경향이나타났다.
본 연구에서는 사료 지질
14%
실험구의 성장율은 단백질30%
까지는유의하게증가하였으나그이상에서는더이상증 가하지않았고,
사료지질7%
실험구의성장율도단백질30%
이상에서유의한차이가없었다
.
따라서,
미꾸리치어양식을위 한배합사료에는단백질을30%
함유시키는것이바람직할것 으로판단된다.
이와같은미꾸리단백질요구량이30%
로비교 적낮은것은미꾸리의식성이잡식성임을암시한다.
또한,
미 꾸리의성장과사료효율을고려하여볼때,
미꾸리치어용배합 사료의지질함량은14%
보다7%
로함유시키는것이더좋을 것으로판단된다.
미꾸리는논두렁이나늪같은곳에주로서식 하면서실지렁이,
곤충의유충,
식물의어린싹,
녹조류및부식 유기물등을섭취한다.
이처럼미꾸리가섭취하는먹이의지질 함량이높지않은것으로미루어보아미꾸리의지질이용성은 높지않음을알수있고,
본연구결과도이를뒷받침하고있다.
어류의단백질요구량은어종에따라서달라질뿐아니라,
어체 의크기,
수온,
사료급여방법,
사료단백질의품질및에너지함 량등여러요인에영향을받을수있는것으로보고되어있다(NRC, 2011).
타담수어종의단백질요구량을살펴보면,
송어(Salmo gairdneri )
는40%
내외(Beamish and Medland, 1986;
Zeitoun et al., 1973; Ogino et al., 1976),
잉어는(Cyprinus car- pio) 31-38% (Ogino and Saito, 1970; Takeuchi et al., 1979),
틸 라피아(Tilapia nilotica)
는28-35% (Santiago et al., 1982; De Silva and Perera, 1985),
차넬메기(Ictalurus punctatus)
는32%
(Garling and Wilson, 1976),
은연어(Oncorhynchus kisutch)
는40% (Zeitoun et al., 1974),
뱀장어(Anguilla japonica)
는45%
Table 4. Proximate composition (%) of the whole body in juvenile muddy loach Misgurnus anguillicaudatus fed the diets containing different protein (CP) and lipid (CL) levels for 8 weeks1
Diets Moisture Crude protein Crude lipid Ash
Initial 78.1 16.6 1.1 2.4
P20L7 74.0±0.40bc 18.4±0.31b 6.0±0.18b 2.3±0.07ns P20L14 72.7±0.40ab 16.1±0.53a 7.5±0.29c 2.5±0.19 P30L7 73.7±0.44bc 16.8±0.18a 6.3±0.09b 2.3±0.10 P30L14 72.2±0.20a 16.1±0.31a 7.7±0.20c 2.5±0.15 P40L7 74.7±0.34c 16.8±0.52a 4.6±0.07a 2.3±0.09 P40L14 73.5±0.65abc 16.7±0.15a 7.3±0.50c 2.6±0.12 P50L7 74.6±0.38c 16.9±0.18a 4.9±0.32a 2.4±0.07 P50L14 74.0±0.18bc 16.5±0.18a 5.9±0.35b 2.5±0.12
Two-way ANOVA
CP level P<0.03 P<0.2 P<0.004 P<0.7 CL level P<0.004 P<0.002 P<0.0001 P<0.1 CP × CL P<0.8 P<0.02 P<0.8 P<0.4
1 Values (mean±SE of three replications) in the same column not sharing a common superscript are significantly different (P<0.05).
(Nose and Arai, 1972)
로보고되고있다.
이러한연구결과들과 비교하여보면,
본실험에서추정된미꾸리치어의단백질요구 량30%
는틸라피아및차넬메기와유사한수준을보이고있다.
본연구에서사료효율이예상보다낮게나타났는데,
이러한 현상에대한정확한원인을현재로서규명할수는없지만,
아마 도본연구에사용된미꾸리의생리적인특성에의한것으로보 인다.
예를들어,
미꾸리는바닥에쌓인부식유기물을쉽게섭 취할수있도록진화된입의구조와소화기관등에의한특성때 문에나타나는현상일수있다고판단된다.
본연구에서배합사료의지질함량증가에의한단백질절약 효과는나타나지않았는데
,
이러한현상은미꾸리의경우사료 지질이용성이타어류에비해낮거나,
사료에첨가된지질의종 류가이어종의기호성에맞지않았을수도있었기때문으로판 단된다.
다른어종의연구에서도사료의지질함량증가에의 한단백질절약효과가없었다는결과들이보고된바있다(Berge and Storebakken 1991; Lee and Kim, 2005; Regost et al.,
2001).
또한,
사료내과잉의지질함량은지방산합성을억제시킬뿐아니라성장을감소시킬수있고
(Sargent et al., 1989),
여분의에너지가체내지질로축적되어어체품질에영향을줄 수있으므로,
이를고려하여야한다(Lee and Kim, 2005).
본연 구에서도사료의지질함량이높은실험구의전어체지질함량 이낮은지질함유사료실험구보다유의하게높았다.
이러한 경향은사료의에너지함량과밀접하게관련되어있는것으로 보이며,
고에너지사료를공급한어류의지질함량이저에너지 사료를공급한어류보다더높았던다른연구결과와일치한다(Lie et al., 1988; Hillestad and Johnsen, 1994; Catacutan and
Coloso, 1995).
일반적으로사료내지질종류또는함량은대상생물의지 방산조성에영향을미친다고보고되어 있다
(Geurden et al., 1997; Lee and Lim, 2005).
동일한사료단백질함량에서사료 내지질함량이증가함에따라18:2n-6
과18:3n-3
의함량은증 가한반면, 20:5n-3
및22:6n-3
과같은n-3HUFA
함량은낮아졌 다.
이러한결과는실험사료의지질함량을높이기위해18:2n- 6
및18:3n-3
이많이함유된대두유및아마인유첨가에따른결 과로보이며,
다른어종에서도유사한경향을보이고있다(Lee et al. 2000; Bowden et al., 2004; Piedecausa et al., 2007).
미 꾸리의필수지방산요구량은알려지지않았지만,
본연구에있어
n-3HUFA
요구량을고려하여사료내어분및어유를사용하였으며
,
본연구에서사용된실험사료의n-3HUFA
함량은0.8-3.1%
으로대부분의담수어류의적정성장에필요한사료의지방산요구량의범위내에있다
(NRC, 2011).
금후에미꾸리의필수지방산요구에관한상세한연구가계속수행되어야 할것으로판단된다
.
본연구의결과로볼때
,
미꾸리의경우사료의지질함량의증 가는사료단백질절약에대한효과를나타내지않았으며,
단백 질30%
와지질7%
가함유된배합사료가미꾸리치어의성장에 적합할것으로전망된다.
사 사
본연구는국립수산과학원경상과제
(RP-2013-AQ-103)
와한국 연구재단 지역대학우수과학자지원사업(NRF-2012R1A1A4A 01010504)
의지원에의해수행되었으며,
이에감사드립니다.
Table 5. Fatty acid composition of whole body in juvenile muddy loach Misgurnus anguillicaudatus fed the diets containing different protein and lipid levels for 8 weeks1Fatty acids Diets
P20L7 P20L14 P30L7 P30L14 P40L7 P40L14 P50L7 P50L14
C14:0 1.7±0.50ab 1.4±0.18a 1.9±0.06ab 1.4±0.12a 2.2±0.16b 1.7±0.10ab 2.2±010b 1.5±0.22a C16:0 20.3±1.08bc 17.5±0.69a 18.8±0.23ab 16.4±0.61a 21.5±0.65c 20.9±1.07bc 22.5±0.53c 18.9±1.04ab C16:1n 6.6±0.54ab 5.7±0.35a 8.3±0.27b 5.4±0.32a 10.1±0.70c 6.9±0.33ab 12.0±0.49d 7.0±1.11ab C18:0 5.8±0.35ns 5.7±0.09 4.9±0.03 5.3±0.16 5.6±0.07 5.7±0.43 5.7±0.09 5.7±0.18 C18:1n-9 27.9±3.09ns 25.8±1.50 24.2±0.10 25.7±1.34 26.4±1.38 30.7±0.36 28.8±0.41 27.7±2.36 C18:2n-6 17.6±3.20cde 21.2±0.32e 16.6±0.27bcd 20.4±0.53de 12.4±0.47ab 14.7±1.06bc 9.3±0.43a 16.6±2.65bcd C18:3n-3 5.1±1.83ab 7.2±0.33bc 5.2±0.09ab 8.4±0.82c 4.1±0.42a 5.4±0.70ab 3.9±0.41a 5.7±0.71bc
C20:0 0.9±0.02bc 1.5±0.13cd 1.0±0.03bcd 1.6±0.12d 0.4±0.23ab 0.5±0.07ab 0.1±0.03a 0.7±0.38b C21:0 1.9±0.17a 1.8±0.09a 2.9±0.10b 2.0±0.08a 3.6±0.20c 2.5±0.09b 4.1±0.04c 2.6±0.39b C20:4n-6 0.9±0.23ns 1.0±0.27 1.1±0.09 0.8±0.08 0.9±0.14 0.6±0.08 0.9±0.05 1.0±0.34 C20:5n-3 1.4±0.28ab 0.9±0.50a 2.6±0.03c 1.5±0.33ab 2.0±0.50bc 0.8±0.01a 1.8±0.12ab 1.3±0.43ab C22:5n-3 0.8±0.20ab 0.4±0.42a 1.3±0.04b 0.8±0.17ab 0.9±0.29ab 0.3±0.16a 0.8±0.11ab 0.6±0.38ab C22:6n-3 2.4±0.70ab 1.9±0.55a 4.4±0.15b 2.8±0.63ab 3.5±0.99ab 1.6±0.03a 2.8±0.22ab 2.6±0.76ab n-3HUFA2 4.5±1.17ab 3.3±1.46a 8.3±0.20b 5.1±1.11ab 6.4±1.78ab 2.7±0.17a 5.1±0.44ab 4.5±1.55ab
1 Values (mean±SE of three replications) in the same row not sharing a common superscript are significantly different (P<0.05).
2 Highly unsaturated fatty acids (C≥20).
참고문헌
AOAC, 1990. Official Methods of Analysis. 15th edition.
Association of Official Analytical Chemists. Arlington, Virginia, U.S.A., 1298.
Beamish FWH and Medland TE. 1986. Protein sparing effects in large rainbow trout,
Salmo gairdneri
. Aquaculture 55, 35- Berge GM and Storebakken T. 1991. Effect of dietary fat 42.level on weight gain, digestibility and fillet composition of Atlantic halibut. Aquaculture 99, 331-338.
Bowden LA, Weitzel B, Ashton IP, Secombes CJ, Restall CJ, Walton TJ, Bell JG, Henderson RJ, Tocher DR and Sargent JR. 2004. Replacement of dietary fish oil with increasing levels of linseed oil: modification of flesh fatty acid compositions in Atlantic salmon
Salmo salar
using a fish oil finishing diet. Lipids 39, 223-232.Catacutan, MR and Coloso TMT. 1995. Effect of dietary protein to energy ratios on growth, survival, and body composition of juvenile Asian seabass,
Lates calcarifer
. Aquaculture 131, 125-133.Cho CY and Kauskik SJ. 1990. Nutritional energetics in fish:
Energy and protein utilization in rainbow trout
Salmo gairdneri
. World Rev Nutr Diet 61, 131-172.Daniels WH and Robinson EH. 1986. Protein and energy requirements of juvenile red drum
Sciaenops ocellatus
. Aquaculture 53, 243-242.De Silva SS and Perera MK. 1985. Effects of dietary protein level on growth, food conversion, and protein use in young
Tilapia nilotica
at four salinities. Trans Am Fish Soc 114, 584-589.Duncan DB. 1955. Multiple-range and multiple F tests.
Biometrics 11, 1-42.
Folch J, Lees M and Sloane-Stanley GH. 1957. A simple method for the isolation and purification of total lipids from animal tissues. J Biol Chem 226, 497-509.
Garling DL and Wilson RP. 1976. Optimum dietary protein to energy ratio for channel catfish fingerlings
Ictalurus punctatus
. J Nutr 106, 1368-1375.Geurden, I, Coutteau P and Sorgeloos P. 1997. Effect of a dietary phospholipid supplementation on growth and fatty acid composition of European sea bass
Dicentrarchus labrax
L. and turbotScophthalmus maximus
L. juveniles from weaning onwards. Fish Phy Biochem 16, 259-272.Hillestad M and Johnsen FT. 1994. High-energy/low-protein diets for Atlantic salmon: Effects on growth, nutrient retention and slaughter quality. Aquaculture 124, 109-116.
Kim KD, Lee SM, Park HG, Bai SC and Lee YH. 2002.
Essentiality of dietary n-3 highly unsaturated fatty acids in juvenile flounder
Paralichihys olivaceus
. J World Aaqucult Soc 33, 432-440.Lee SM and Kim KD. 2005. Effect of various levels of lipid exchanged with dextrin at different protein level in diet on growth and body composition of juvenile flounder
Paralichthys olivaceus . Aquacult Nutr 11, 435-442.
Lee SM and Lim TJ. 2005. Effects of dietary protein and evergy
levels on growth and lipid composition of juvenile snail
Semisulcospira gottschei
. J Shell Res 24, 99-102.Lee SM, Cho SH and Kim KD, 2000. Effects of dietary protein and energy levels on growth and body composition of juvenile flounder
Paralichthys olivaceus
. J World Aquacult Soc 31, 306-315.Lee SM, Jeon IG and Lee JY. 2002. Effects of digestible protein and lipid levels in practical diets on growth, protein utilization and body composition of juvenile rockfish
Sebastes schlegeli
. Aquaculture 211, 227-239.Lie O, Lied E and Lambertsen G. 1988. Feed optimization in Atlantic cod
Gadus morhua
: fat versus protein content in the feed. Aquaculture 69, 333-341.Lovell RT. 1989. Nutrition and feeding of fish. Van Nostrand Reinhold. New York, USA, 260.
NRC (National Research Council). 2011. Nutrient requirements of fish and shrimp. National Academy Press, Washington, DC, USA.
Nose T and Arai S. 1972. Optimum level of protein in purified test diet for eel,
Anguilla japonica
. Bull. Freshw Fish Res Lab Tokyo 22, 145-155.Ogino C, Chiou, JY and Takeuchi T. 1976. Protein nutrition in fish Ⅵ. Effects of dietary energy sources on the utilization of proteins by rainbow trout and carp. Bull Jap Soc Sci Fish 42, 213-218.
Ogino C and Saito K. 1970. Protein nutrition in fish. I. The utilization of dietary protein by young carp. Bull Jap Soc Sci Fish 36, 250-254.
Piedecausa MA, Mazón MJ, García BG and Hernández MD.
2007. Effects of total replacement of fish oil by vegetable oils in the diets of sharpsnout seabream
Diplodus puntazzo
. Aquaculture 263, 211-219.Regost C, Arzel J, Cardinal M, Robin J, Laroche M and Kaushik SJ. 2001. Dietary lipid level, hepatic lipogenesis and flesh quality in turbot
Psetta maxima
. Aquaculture 193, 291-309.Santiago, CB, Banes-Aldaba, M and Laron MA. 1982. Dietary crude protein requirement of
Tilapia nilotica
fry. Kalikasan 11, 255-265.Sargent JR, Henderson RJ and Tocher DR. 1989. The lipids.
In: Halver, J.E. (Ed/), Fish Nutrition. Academic Press, San Diego, CA, U.S.A. 153-218.
Takeuchi T, Watanabe T and Ogino C. 1979. Optimum ratio of dietary energy to protein for carp. Bull Jap Soc Sci Fish 45, 983-987.
Yoshimatsu, T., H. Imoto, M. Hayash, K. Toda and K.
Yoshimura.1997. Preliminary results in improving essential fatty acids enrichments of rotifer cultured in high density.
Hydrobiologia 358, 153-157.
Zeitoun IH, Tack PI, Halver JE and Ullery DE. 1973. Influence of salinity on protein requirements of rainbow trout
Salmo gairdneri fingerlings. J Fish Res Board Can 30, 1867-1873.
Zeitoun IH, Ullery DE, Halver JE, Tack PI and Magee WT.
1974. Influence of salinity on protein requirements of coho salmon