308
Copyright © 2015 The Korean Society of Fisheries and Aquatic Science pISSN:0374-8111, eISSN:2287-8815
서 론
양식어종에적합한배합사료를 개발하기위해서는 우선적
으로대상어종의필수영양소에대한요구량이조사되어야하 며
,
각각의대상어종에적합한배합사료의단백질/
에너지비율(P/E ratio)
에대한연구가이루어져야한다.
단백질과지방은사료 내 단백질과 지방 수준이 참돔(Pagrus major) 치어의 성장, 사료효율 및 비특이적 면역력에 미치는 영향
김성삼·오대한
1·최세민
1·김강웅·김경덕·이봉주·한현섭·이경준
2*
국립수산과학원 사료연구센터, 1CJ 제일제당 생물자원연구소, 2제주대학교 해양생명과학과
Effects of Dietary Protein and Lipid Levels on the Growth Performance, Feed Utilization and Innate Immunity of Juvenile Red Seabream
Pagrus major
Sung-Sam Kim, Dae-Han Oh
1
, Se-Min Choi1
, Kang-Woong Kim, Kyoung-Duck Kim, Bong-Joo Lee, Hyon-Sob Han and Kyeong-Jun Lee2
*Aquafeed Research Center, National Fisheries Research and Development Institute, Pohang 791-923, Korea
1
Animal Bioscience Research Institute, CJ CheilJedang Corporation, Incheon 400-103, Korea
2
Department of Marine Life Sciences, Jeju National University, Jeju 690-756, Korea
A 3×3 factorial study was conducted to investigate the effects of dietary protein and lipid levels on the growth, feed utilization and innate immunity of red seabream Pagrus major . Nine diets consisting of three protein levels (42%, 46% and 50% crude protein) and three lipid levels (10%, 14% and 18% crude lipid) were formulated. Triplicate groups of red seabream were fed the experimental diets to apparent satiation (5-6 times a day, from 08:00 to 18:00 h at 2-h intervals) for 10 weeks. At the end of the feeding trial, the weight gain and specific growth rate of fish fed P46L14 (46% protein and 14% lipid), P50L10 (50% protein and 10% lipid) and P50L14 (50% protein and 14% lipid) were significantly ( P <0.05) higher than those of fish fed P42L18 (42% protein and 18% lipid). The feed conver- sion ratios (FCR) of the fish were affected by dietary lipid levels ( P <0.039), but not dietary protein levels. The FCR tended to increase with increasing dietary lipid levels from 10% to 18% with the 46% and 50% protein levels. The weight gain, protein efficiency ratio, specific growth rate, feed intake and survival of fish were not affected by either dietary protein or lipid levels. Myeloperoxidase activity in the group fed P50L14 (50% protein and 14% lipid) was significantly higher than that in the group fed P42L10 (42% protein and 10% lipid) or P50L18 (50% protein and 18%
lipid). However, the myeloperoxidase activity of fish was not affected by either dietary protein or lipid level. The fish fed P46L14 (46% protein and 14% lipid) and P46L18 (46% protein and 18% lipid) showed significantly higher superoxide dismutase activity than did the fish fed P46L10 (46% protein and 10% lipid), P50L10 (50% protein and 10% lipid) of P50L18 (50% protein and 18% lipid). In conclusion, the optimum protein and lipid levels for the growth and feed utilization of juvenile red seabream were 46% and 14%, respectively, and the optimum dietary protein to energy ratio was 27.4 g/MJ.
Key words: Red seabream, Optimum protein to energy ratio, Protein level, Lipid level, Innate immunity
This is an Open Access article distributed under the terms of the Creative Commons Attribution Non-Commercial Licens (http://creativecommons.org/licenses/by-nc/3.0/)which permits unrestricted non-commercial use, distribution, and reproduction in any medium, provided the original work is properly cited.
http://dx.doi.org/10.5657/KFAS.2015.0308 Korean J Fish Aquat Sci 48(3) 308-313, June 2015
Received 29 October 2014; Revised 16 December 2014; Accepted 6 February 2015
*Corresponding author: Tel: +82. 64. 754. 3423 Fax: +82. 64. 756. 3493
E-mail address: [email protected]
생체구성과에너지대사에필수적요소이며
,
동물의성장과사 료가격을결정짓는중요한역할을한다(Lee and Kim, 2005).
단백질이용효율은지방
,
탄수화물과같은비단백질성물질의 이용성및사료내단백질수준과밀접한관련이있다(Wang et al., 2014).
최근여러어종의배합사료내에지방함량을증가시 키고있는추세이며,
충분한지방함량은사료내단백질을절약 하는단백질절약효과(protein sparing effect)
가있다는것이증 명되고있다(Ng et al., 2008).
지방함량의증가는단백질절약효 과(Cho and Kaushik, 1985; Ogata and Shearer, 2000; Sargent et al., 2002)
뿐아니라총질소배출을감소시키고(Yigit et al.,
2002),
사료효율및성장을증가시키는것으로보고되고있다(Hillestad and Johnsen, 1994; Einen and Roem, 1997).
하지만 사료내과다한지방함량은어체와복강내지방을증가시켜어 체의품질을감소시키고(Einen and Skrede, 1998; Helland and Grisdale-Helland, 1998; Company et al., 1999),
사료섭취율 과성장을저하시킬수있다(Shearer et al., 1997; Silverstein et al., 1999).
고지방사료의효과는환경적인요인과어종,
어류의 크기,
사료내단백질함량,
사료공급률등여러요인들에의해 다르게나타난다(Kim et al., 2006). Maris and Kissil (1979)
은gilthead seabream
을대상으로한연구에서사료내단백질함 량이44%
일때지방9%
가최대성장에필요한함량이라고보 고하였다.
이함량은참돔사료내최적의지방함량이8-10%
라 고보고한값과유사하다(Yone et al., 1971).
하지만Takeuchi et al. (1991)
은참돔치어의배합사료내최적의단백질및지 방함량은각각52%
와15%
로보고하였다.
또한Vergara et al.
(1996)
은gilthead seabream
사료내지방함량이15%
일때가9%
보다유의적으로높은성장률을보인다고 서술하였다.
이 와같이어종및성장단계에따라차이를보이고있어단백질 과지방수준에따른P/E ratio
설정은효율적인배합사료설계 에있어매우중요하다.
따라서이연구는치어기참돔의효율적 인성장을위한사료내적정P/E ratio
를설정및단백질과지방 함량의수준에따른성장과비특이적면역반응을알아보기위 해수행되었다.
재료 및 방법
실험사료
실용 사료원료를 기초로총
9
개의 실험사료를 제작하였다(Table 1).
실험사료디자인은3×3 factorial design
으로3
단계 의조단백질(CP; 42%, 46% and 50%)
과3
단계의조지방함량(CL; 10%, 14%, and 18%)
을조합하여제작되었다(P42L10, 42%CP+10%CL; P42L14, 42%CP+14%CL; P42L18, 42%CP+18%CL; P46L10, 46%CP+10%CL; P46L14, 46%CP+14%CL; P46L18, 46%CP+18%CL; P50L10, 50%CP+10%CL; P50L14, 50%CP+14%CL; P50L18, 50%CP+18%CL).
실험구간에적정P/E ratio
규명을위해동일어종의각사료원료의소화율을참고하여실험사료의단백 질
/
에너지비율을설정하였다(NRC, 2011).
실험사료는우선 사료원들을혼합기에넣어완전히섞은다음,
어유를첨가한뒤 사료원총중량의30%
에해당하는증류수를첨가하여혼합및 반죽하였다.
혼합반죽물은 소형초파기(SMC-12, Kuposlice, Busan, Korea)
를이용하여알맞은크기로뽑아내었다.
실험사 료는동결건조기로24
시간건조시켜사료공급전까지-20°C
에 보관하면서사용하였다.
실험어 및 사육관리
실험에사용된참돔치어는경상남도고성군에위치한종묘배 양장에서구입하여제주대학교소속해양과환경연구소로이송 하였다
.
실험어류는2
주동안시판배합사료를공급하면서실 험환경에적응할수있도록순치하였다.
예비사육후참돔치어(
초기평균무게: 7.66±0.03 g)
는총27
개의150 L
원형플라스 틱수조에각수조당30
마리씩무작위로선택하여배치하였다.
사육수는모래여과해수를사용하여2-3 L/min
의유수량이공 급되도록조절하였고모든실험수조에용존산소유지를위하 여 에어스톤을설치하였다.
사육수온은자연수온(21-27°C)
에 의존하였으며광주기는형광등을이용하여12L:12D
로유지 되었다.
실험사료공급은1
일5-6
회(08:00 h - 18:00 h)
에걸쳐 만복공급하였으며,
실험은총10
주간진행되었다.
샘플수집 및 분석
실험어의무게는
3
주마다측정하였으며,
측정24
시간전에실 험어류의스트레스를줄이기위해모든실험어류를절식시켰 다.
사료공급실험후,
어류의최종평균무게를측정하여증체 율(weight gain),
사료전환효율(feed conversion ratio),
일간성 장률(specific growth rate),
단백질이용효율(protein efficiency ratio),
사료섭취율(feed intake)
및생존율(survival)
을계산하였 다.
최종무게측정후수조당6
마리의어류를무작위로선별하 여2-phenoxyethanol (200 ppm)
용액으로마취시킨후주사기 를이용하여미부동맥에서채혈하였다.
채혈된혈액은상온에 서60
분간방치시킨후원심분리기로(5,000 g)
혈청을분리하 였다.
분리된혈청은비특이적면역분석에사용되었다.
실험사료의일반성분분석은
AOAC (1995)
방법에따라수 분은상압가열건조법(125℃, 3 h),
회분은직접회화법(550°C, 6 h),
조단백질은 자동조단백질분석기(Kejltec system 2300, Sweden)
로분석하였으며,
조지방은Folch et al. (1957)
의방법 에따라Soxhlet
추출장치(Soxhlet heater system C-SH6, Ko- rea)
를이용하여분석하였다.
혈청내
myeloperoxidase (MPO)
활성은Kumari and Sahoo
(2005)
의방법을기초로분석하였다.
먼저HBSS (Hanks bal-
anced salt solution)
를96-well plates
에80 μL
씩분주한후혈 청20 μL
을넣는다. 20 mM TMB (3,3'5,5'-tetramethyllbenzi-
dine hydrochloride)
용액과5 mM H
2O
2 용액을넣는다. 2
분 간반응시킨후4 M H
2SO
4용액을35 μL
첨가한후microplate
reader (Thermo, USA)
를이용하여450 nm
에서흡광도를측 정하였다.
혈청내
lysozyme
분석은Sankaran and Gurnani (1972)
의 분석방법으로분석하였다. Sodium citrate buffer (0.02 M, pH 5.52)
에동결건조된Micrococcus lysodeikticus (Sigma, USA)
를첨가하여0.2 mg/mL
농도의현탁액을제조하였다.
현탁액 과혈청을10:1
의비율로혼합시킨후,
최초450 nm
에서흡광 도값을측정하고24℃
에서한시간반응시킨후최종흡광도 값을측정하였다. Lyophilized hen egg white lysozyme (sigma, USA)
를이용하여standard curve
를구하고μg/mL
로표시하 였다.
혈청내
Superoxide dismutase (SOD)
활성은superoxide dis- mutase assay kit (Sigma, USA)
를이용하여분석되었다. 통계학적 분석
실험사료의배치는완전확률계획법
(Completely randomized design)
을실시하였으며,
분석결과는SPSS (Version 12.0)
프 로그램을이용하여One-way ANOVA
로통계분석되었으며데이터값의유의차는
Duncan's multiple test (P<0.05)
로비교되 었다.
실험사료의단백질과지방수준에따른상호관계는Two- way ANOVA
로분석하였다.
백분율데이터는arcsine
변형값 으로계산하여통계분석되었다.
결과 및 고찰
10
주간실시된사료공급실험의성장결과는Table 2
에나타내 었다.
사육기간 동안의증체율,
단백질이용효율,
일간성장률,
사료섭취율및생존율은사료내단백질및지방함량에영향 을받지않았다.
증체율및일간성장률은P46L14, P50L10
및P50L14
실험구가P42L18
실험구보다유의적으로높은값을 나타내었지만, P42L10, P42L14, P46L10, P46L18
및P50L18
실험구와는 유의차가 없었다.
같은 단백질 함량에서는 지방14%
함유된실험구의증체율이다른실험구에비해다소높은경향을나타내었으며
, 18%
의고지방첨가실험구는감소되는 경향을보였다.
사료계수는사료내지방함량(P<0.039)
에영향 을받았으며,
같은단백질함량에서지방함량이증가함에따라 Table 1. Formulation of the experimental diet for red seabream Pagrus majorIngredients (% DM) P42L10 P42L14 P42L18 P46L10 P46L14 P46L18 P50L10 P50L14 P50L18
P/E ratio (g/MJ) 27.4 25.3 23.5 29.6 27.4 25.5 32.1 29.7 27.6
Fish meal 44.0 44.0 44.0 46.0 46.0 46.0 48.0 48.0 48.0
Soybean meal 6.0 6.0 6.0 8.0 8.0 8.0 10.0 10.0 10.0
Corn gluten meal 6.0 6.0 6.0 8.0 8.0 8.0 10.0 10.0 10.0
Wheat flour 15.5 15.5 15.5 15.5 15.5 15.5 15.5 15.5 15.5
Dextrin 12.0 10.0 8.0 8.0 6.0 4.0 4.5 2.5 0.5
Cellulose 8.0 6.0 4.0 6.0 4.0 2.0 4.0 2.0 0.0
Fish oil 5.5 9.5 13.5 5.5 9.5 13.5 5.0 9.0 13.0
Mineral mix1 1.0 1.0 1.0 1.0 1.0 1.0 1.0 1.0 1.0
Vitamin mix2 1.0 1.0 1.0 1.0 1.0 1.0 1.0 1.0 1.0
CMC 1.0 1.0 1.0 1.0 1.0 1.0 1.0 1.0 1.0
Proximate composition
Protein (%) 42.0 42.0 42.1 45.3 45.2 45.3 50.4 50.2 50.2
Lipid (%) 10.6 14.3 17.8 10.2 13.8 18.3 10.1 14.2 18.4
Ash (%) 8.8 9.2 9.2 9.6 9.8 9.5 10.2 10.2 9.9
Fiber (%) 10.51 8.51 6.51 8.73 6.73 4.73 6.95 4.95 2.95
Carbohydrate (%)3 38.6 34.5 30.9 34.9 31.2 26.9 29.3 25.4 21.5
Energy (MJ/kg)4 15.4 16.5 17.7 15.7 16.8 18.0 15.8 17.0 18.2
1 MgSO4.7H2O, 80.0; NaH2PO4.2H2O, 370.0; KCl, 130.0; Ferric citrate, 40.0; ZnSO4.7H2O, 20.0; Ca-lactate, 356.5; CuCl, 0.2; AlCl3. 6H2O, 0.15; Na2Se2O3, 0.01; MnSO4.H2O, 2.0; CoCl2.6H2O, 1.0.
2 L-ascorbic acid, 121.2; DL-α tocopheryl acetate, 18.8; thiamin hydrochloride, 2.7; riboflavin, 9.1; pyridoxine hydrochloride, 1.8; niacin, 36.4; Ca-D-pantothenate, 12.7; myo-inositol, 181.8; D-biotin, 0.27; folic acid, 0.68; p-aminobezoic acid, 18.2; menadione, 1.8; retinyl acetate, 0.73; cholecalficerol, 0.003; cyanocobalamin, 0.003.
3Carbohydrate (%) = 100-(protein+lipid+fiber+ash).
4Calculated based on 4 kcal/g protein, 9 kcal/g lipid, 4 kcal/g carbohydrate.
사료계수도증가하는경향을보였다
.
사료계수는P46L18
실 험구가P42L10, P42L14, P42L18, P46L10, P46L14, P50L10
및P50L14
보다유의하게높았지만, P50L18
실험구와는유의 한차이가없었다.
단백질이용효율은P42L18
실험구가가장높 은값을 나타내었지만, P42L10, P42L14, P46L10, P46L14, P50L10
및P50L10
실험구와는유의차가없었다.
생존율은고 지방실험구인P46L18
실험구가가장낮은값을나타내었지만,
P50L18
실험구와 유의차는없었다.
이렇게고지방실험구에서낮은생존율을보인것은산화적스트레스에의한것으로 판단된다
.
사료내높은수준의지방첨가는산화적스트레스를 일으켜면역력및생존율을저하시킬수있다고보고되고있 다(Wang et al., 2014).
본연구에서 참돔치어의성장은사료 내단백질함량에관계없이모든실험구에서14%
지방수준까 지증가하다18%
에서감소되었다.
이로미루어볼때치어기참 돔(7.7 g)
의지방요구량은14%
내외가적절할것으로사료된 다.
이는참돔(
초기무게: 30-40 g)
사료내최적의지방함량이8-10%
라고보고된결과와다르다(Yone et al., 1971).
지방요 구량은수온,
지방의형태,
사료내단백질및에너지수준에따 라다르게나타날수있으며(Wang et al., 2013)
적정요구량에 비해높은수준의지방첨가는단백질과아미노산같은필수영 양소의결핍으로인한성장률감소를야기시킬수있는것으로 보고되고있다(Daniels and Robinson, 1986; Mohanta et al., 2009).
지방이10%
첨가된실험구의증체율은단백질이50%
까지증가할수록높아지는경향을보였으나지방이
14%, 18%
첨가된실험구의증체율은단백질
46%
까지높아지다50%
수준에서는더이상증가하지않고정체되는경향을보였다
.
지방 함량증가에따른단백질절약효과는자바틸라피아(red tilapia, De Silva et al., 1991),
귀족돔(gilthead sea bream, Vergara et al., 1996),
조피볼락(rockfish, Lee et al., 2002)
과같은육식성 어류에서보고된바있다.
단백질절약효과는사료내단백질,
지 방,
탄수화물함량차이에따른상호작용에의해다르게나타날 수있다(Lim et al., 2013).
이러한결과로미루어보아본연구 에서는치어기참돔사료내단백질이46%
일때14-18%
수준 의지방첨가가단백질절약효과를가져올수있는것으로사료 된다.
성장결과를종합해보면,
참돔치어의사료내단백질함 량46%,
에너지가16.8 MJ/kg
이최적의성장을나타낼것으로 예상된다.
본연구에서참돔의최대성장에해당하는사료의단 백질에대한에너지비인27.4 g/MJ
의값은대부분어류의적정 성장에필요한사료의단백질에대한에너지비(19-27 g/MJ)
범위내에있다(NRC, 1993).
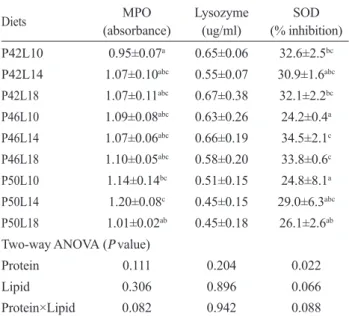
사료내단백질과지방함량에따른비특이적면역반응을알아 보기위한분석결과는
Table 3
에나타내었다.
비특이적면역반 응(MPO
활성, Lysozyme
활성, SOD
활성)
들은사료내단백질 과지방함량에영향을받지않았다. MPO
활성은P50L10
실험 구가가장높은값을나타내었지만, P42L14, P42L18, P46L10, P46L14, P46L18
및P50L10
실험구와유의차는없었다.
이것 Table 2. Growth performance of red seabream Pagrus major (initial body weight, 7.66±0.03 g) fed the nine experimental diets for 10 weeks1Diets FMB (g) WG (%)2 FCR3 PER4 SGR (%)5 FI (g)6 Survival (%)
P42L10 35.3±3.7 360±49ab 1.18±0.05a 2.02±0.08bc 2.18±0.15ab 46.1±4.6 86.7±5.8b P42L14 36.7±1.7 382±28ab 1.15±0.06a 2.08±0.12bc 2.24±0.08ab 46.9±0.6 85.6±1.9b P42L18 33.8±1.2 341±15a 1.13±0.01a 2.11±0.01c 2.12±0.05a 43.6±3.5 92.5±5.1b P46L10 36.7±0.3 377±2ab 1.10±0.02a 1.98±0.04bc 2.23±0.01ab 45.4±2.7 90.0±3.3b P46L14 37.9±1.9 395±26b 1.13±0.23a 1.98±0.36bc 2.28±0.08b 48.0±4.7 87.8±8.4b P46L18 36.7±1.8 382±22ab 1.45±0.24b 1.52±0.23a 2.22±0.07ab 50.0±1.1 76.7±9.4a P50L10 38.4±1.4 403±23b 1.00±0.05a 1.99±0.09bc 2.31±0.06b 45.4±1.6 87.8±6.9b P50L14 38.3±2.9 399±40b 1.05±0.12a 1.93±0.23bc 2.29±0.11b 49.3±2.9 84.4±3.8b P50L18 35.7±1.2 366±20ab 1.22±0.24ab 1.69±0.35ab 2.20±0.06ab 46.9±7.3 77.8±13.9ab Two-way ANOVA (P value)
Protein 0.066 0.090 0.177 0.055 0.078 0.470 0.437
Lipid 0.080 0.113 0.039 0.056 0.112 0.430 0.424
Protein×Lipid 0.782 0.711 0.191 0.204 0.697 0.628 0.197
1Mean values of triplicate groups, values are presented as mean±SD. Values in the same column having different superscript letters are significantly different (P<0.05).
2Weight gain (%) = 100 × (final mean body weight – initial mean body weight)/initial mean body weight.
3Feed conversion ratio = dry feed fed/wet weight gain.
4Protein efficiency ratio = wet weight gain/total protein given.
5Specific growth rate (%) = [(ln final body weight – ln initial body weight)/days] × 100.
6Feed intake (g) = dry feed fed/fish.
은적절한영양소및에너지함량이아닌사료의설계는어류 의면역력을떨어뜨릴수있음을시사한다
.
다시말해영양소요 구량에맞게사료의조성이설계되지않거나,
오히려과영양으 로설계된다면어류의면역력에부정적인영향을끼칠수있음 을의미한다. SOD
활성분석결과는P46L14
와P46L18
실험구 가P46L10, P50L10
및P50L18
실험구와비교하여유의적으 로높은값을나타내었다.
성장률의결과에서알수있듯이적 절한영양소및에너지가포함되도록설계된실험구에서비특 이적면연력이증가하는것을알수있었다. Lysozyme
활성분 석결과는모든실험구에서유의적인차이를관찰할수없었다. Rawles et al. (2011)
은sunshine bass (Morone × M. saxatilis)
사료내단백질함량이47.3-34.7%
까지감소함에따라비특이 적면역반응이감소하는추세를보이며,
단백질과지방함량은 어류의비특이적면역력에영향을줄수있다고서술하였다.
또 한Wang et al. (2014)
은사료내높은수준의지방첨가는산화 적스트레스에의한면역력저하를야기할수있으며,
자가사리(yellow catfish)
의정상적인생리활성을위한적정지방수준은6-8%
범위라고서술하고있다.
본연구의경우단백질과지방수준에따른면역력변화에대한명확한차이는보이지않으나 전체적인경향을살펴볼때단백질함량이동일한실험구내에 서지방이
14%
함유된실험구들과단백질이46%
함유된실험 구들의면역활성이다소높은경향을보였다.
결론적으로이상의모든결과를종합해볼때
,
치어기참돔(7.7 g)
의성장과면역력향상을위해서사료내최적의단백질에대한에너지비는
27.4 g/MJ,
에너지는16.8 MJ/kg
이적절 할것으로조사되었으며,
적정단백질과지방함량은각각46%
와
14%
일때가장효율적일것으로사료된다.
사 사
이연구는국립수산과학원
(
친환경실용배합사료개발및품질 관리연구, RP-2014-AQ-300)
의지원에의해연구되었습니다.
References
AOAC (Association of Official Analytical Chemists). 1995. Of- ficial Methods of Analysis. 16th edn. Association of Official Analytical Chemists, Arlington, Virginia.
Cho CY and Kaushik SJ. 1985. Effects of protein intake on me- tabolizable and net energy values of fish diets. In: Cowey CB, Mackie AM, Bell JG. (Eds.), Nutrition and feeding in fish. Academic Press, London, 95-117.
Company R, Calduch-Giner JA, Kaushik S and Perez-Sanchez J. 1999. Growth performance and adiposity in gilthead sea bream (Sparus aurata): risks and benefits of high energy diets. Aquaculture 171, 279-292. http://dx.doi.org/10.1016/
S0044-8486(98)00495-5.
Daniels WH and Robinson EH. 1986. Protein and energy re- quirements of juvenile red drum (Sciaenops ocellatus).
Aquaculture 53, 243-252. http://dx.doi.org/10.1016/0044- 8486(86)90354-6.
De Silva SS, Gunasekera RM and Shim KF. 1991. Interactions of varying dietary protein and lipid levels in young red tila- pia: Evidence of protein sparing. Aquaculture 95, 305-318.
http://dx.doi.org/10.1016/0044-8486(91)90096-P.
Einen O and Roem AJ. 1997. Dietary protein/energy ratios for Atlantic salmon in relation to fish size: growth, feed utiliza- tion and slaughter quality. Aquacult Nutr 3, 115-126. http://
dx.doi.org/10.1046/j.1365-2095.1997.00084.x.
Einen O and Skrede GG. 1998. Quality characteristics in raw and smoked fillets of Atlantic salmon, Salmo salar, fed high-energy diets. Aquacult Nutr 4, 99-108. http://dx.doi.
org/10.1046/j.1365-2095.1998.00053.x.
Folch J, Lees M and Sloane-Stanley GH. 1957. A simple method for the isolation and purification of total lipids from animal tissues. J Biol Chem 226, 497-509.
Helland SJ and Grisdale-Helland B. 1998. Growth, feed utili- zation and body composition of juvenile Atlantic halibut (Hippoglossus hippoglossus) fed diets differing in the ratio between the macronutrients. Aquaculture 166, 49-56. http://
dx.doi.org/10.1016/S0044-8486(98)00273-7.
Hillestad M and Johnsen F. 1994. High-energy/low-protein diets for Atlantic salmon: effects on growth, nutrient retention and slaughter quality. Aquaculture 124, 109-116. http://dx.doi.
org/10.1016/0044-8486(94)90366-2
Kim KD, Kim KM, Kim KW, Kang YJ and Lee SM. 2006.
Table 3. Myeloperoxidase (MPO) activity, lysozyme activity, and superoxide dismutase (SOD) activity of fish fed the nine experi- mental diets in red seabream Pagrus major for 10 weeks1
Diets MPO
(absorbance) Lysozyme
(ug/ml) SOD
(% inhibition) P42L10 0.95±0.07a 0.65±0.06 32.6±2.5bc P42L14 1.07±0.10abc 0.55±0.07 30.9±1.6abc P42L18 1.07±0.11abc 0.67±0.38 32.1±2.2bc P46L10 1.09±0.08abc 0.63±0.26 24.2±0.4a P46L14 1.07±0.06abc 0.66±0.19 34.5±2.1c P46L18 1.10±0.05abc 0.58±0.20 33.8±0.6c P50L10 1.14±0.14bc 0.51±0.15 24.8±8.1a P50L14 1.20±0.08c 0.45±0.15 29.0±6.3abc P50L18 1.01±0.02ab 0.45±0.18 26.1±2.6ab Two-way ANOVA (P value)
Protein 0.111 0.204 0.022
Lipid 0.306 0.896 0.066
Protein×Lipid 0.082 0.942 0.088
1Mean values of triplicate groups, values are presented as mean±SD. Values in the same column having different superscript letters are significantly different (P<0.05).
Influence of lipid level and supplemental lecithin in diet on growth, feed utilization and body composition of juve- nile flounder (Paralichthys olivaceus) in suboptimal wa- ter temperatures. Aquaculture 251, 484-490. http://dx.doi.
org/10.1016/j.aquaculture.2005.06.020.
Kumari J and Sahoo PK. 2005. Effects of cyclophosphamide on the immune system and disease resistance of Asian cat- fish Clarias batrachus. Fish Shellfish Immun 19, 307-316.
http://dx.doi.org/10.1016/j.fsi.2005.01.008.
Lee SM and Kim KD. 2005. Effect of various levels of lipid exchanged with dextrin at different protein level in diet on growth and body composition of juvenile flounder Parali-
chthys olivaceus. Aquacult Nutr 11, 435-442. http://dx.doi.
org/10.1111/j.1365-2095.2005.00372.x.
Lee SM, Jeon IG and Lee JY. 2002. Effects of digestible pro- tein and lipid levels in practical diets on growth, protein utilization and body composition of juvenile rockfish (Se-
bastes schlegelii). Aquaculture 211, 227-239. http://dx.doi.
org/10.1016/S0044-8486(01)00880-8.
Lim SG, Han HK, Bang IC, Choi J and Lee SM. 2013. Effect of dietary protein and lipid levels on the growth and body com- position of juvenile long snout bullhead Leiocassis longiros-
tris Günther. Korean J Fish Aquat Sci 46, 377-383. http://
dx.doi.org/10.5657/KFAS.2013.0377.
Marais J.F.K and Kissil G.W. 1979. The influence of energy level on the feed intake, growth, food conversion and body composition of Sparus aurata. Aquaculture 17, 203-219.
http://dx.doi.org/10.1016/0044-8486(79)90124-8.
Mohanta KN, Mohanty SN, Jena J and Sahuz NP. 2009. A di- etary energy level of 14.6 MJ kg-1 and protein-to-energy ra- tio of 20.2 g MJ-1 results in best growth performance and nutrient accretion in silver barb Puntius gonionotus finger- lings. Aquacult Nutr 15, 627-637. http://dx.doi.org/10.1111/
j.1365-2095.2008.00632.x.
Ng WK, Abdullah N and De Silva SS. 2008. The dietary pro- tein requirement of the Malaysian mahseer, Tor tambroides (Bleeker), and the lack of protein-sparing action by dietary lipid. Aquaculture 284, 201-206. http://dx.doi.org/10.1016/j.
aquaculture.2008.07.051.
Ogata HY and Shearer KD. 2000. Influence of dietary fat and adiposity on feed intake of juvenile red sea bream Pagrus
major. Aquaculture 189, 237-249. http://dx.doi.org/10.1016/
S0044-8486(00)00374-4.
Rawles SD, Thompson KR, Brady YJ, Metts LS, Aksoy MY, Gannam AL, Twibell RG, Ostrand S and Webster CD. 2011.
Effects of replacing fish meal with poultry by-product meal and soybean meal and reduced protein level on the perfor- mance and immune status of pond-grown sunshine bass (Mo-
rone chrysops × M. saxatilis). 2011. Aquacult Nutr 17, 708-
721. http://dx.doi.org/10.1111/j.1365-2095.2010.00831.x Sankaran K and Gurnani S. 1972. On the variation in catalyticactivity of lysozyme in fishes. Indian J Biochem Biophys
91, 162-165.
Sargent JR, Tocher DR and Bell JG. 2002. The lipids, In: Halver JE, Hardy RW. (Eds.), Fish Nutrition, 3rd edition. Academic Press, San Diego California, 181-257.
Shearer KD, Silverestein JT and Plisetskaya EM. 1997. Role of adiposity in food intake control of juvenile chinook salmon (Oncorhynchus tshawytscha). Comp Physiol Bio- chem 118A, 1209-1215. http://dx.doi.org/10.1016/S0300- 9629(97)86801-6.
Silverstein JT, Shearer KS, Dickhoff WW and Plisetskaya EM. 1999. Regulation of nutrient intake and energy bal- ance in salmon. Aquaculture 177, 161-169. http://dx.doi.
org/10.1016/S0044-8486(99)00076-9.
Takeuchi T, Shiina Y and Watanabe T. 1991. Suitable protein and lipid levels in diet for fingerlings of red sea bream
Pagrus major. Nipp Suis Gakk 57, 293-299.
Vergara JM, Robaina L, De Izquierdo M and La Higuera M.
1996. Protein sparing effect of lipids in diets for fingerlings of gilthead sea bream. Fish Sci 62, 620-623.
Wang LN, Liu WB, Zhang CN, Li XF, Xu WN, Cai DS and Tian HY. 2014. Effects of dietary non-protein energy sources on growth, physiology and biochemistry of yellow catfish (Pel-
teobagrus fulvidraco). J Nanjing Agric Univ 37, 108-114.
Wang YY, MA GJ, Shi Y, Liu DS, Guo XJ, Yang YH and Chen CD. 2013. Effects of dietary protein and lipid levels on growth, feed utilization and body composition in Pseudo-
bagrus ussuriensis fingerlings. Aquacult Nutr 19, 390-398.
http://dx.doi.org/10.1111/j.1365-2095.2012.00972.x.
Yigit M, Yardim O and Koshio S. 2002. The protein spar- ing effects of high lipid levels in diets for rainbow trout (Oncorhynchus mykiss, W. 1792) with special reference to reduction of total nitrogen excretion. Isr J Aquaculture- Bamidgeh 54, 79-88.
Yone Y, Furuichi M and Sakamoto S. 1971. Studies on nutrition of red sea bream. III. Nutritive value of optimum content of lipids in diet. Rep Fish Res Lab Kyushu Univ 1, 49-60.