pISSN 1229-3008 eISSN 2287-6251
Progress in Superconductivity and Cryogenics
Vol.16, No.2, (2014), pp.36~41 http://dx.doi.org/10.9714/psac.2014.16.2.036
```
1. INTRODUCTION
Since MgB
2has a high superconducting critical temperature (T
c) of 39 K [1], MgB
2is considered as a promising material for the applications of superconductor magnets operating without a use of liquid helium [2]. In addition to the high T
c, MgB
2has many other merits [3-6].
They are the low isotropic current flow in the crystal structure of MgB
2, the strongly coupled grain boundary, the low material cost, and the simple fabrication method into a wire [4-6]. Because of the advantages, MgB
2is expected to replace NbTi which is the conventional superconducting wire using liquid helium as a coolant in near future [2, 3].
Two different well-known fabrication methods, an in situ process [7-9] and an ex-situ process [10, 11], are widely used to fabricate MgB
2bulk materials and superconducting wires. In the in situ process magnesium (Mg) and boron (B) powders are used as raw materials [7], whereas in the ex situ process the readily synthesized MgB
2powder is used [10]. In the in situ processed MgB
2, the MgB
2formed via the solid or liquid reaction between Mg and B and the resulting microstructure was very porous [12-15]. In comparison with the in situ processed MgB
2, a few pores was present in the microstructure of the ex situ processed MgB
2. The critical current density (J
c) of the in situ processed MgB
2was higher than that of the ex situ processed MgB
2[9]. The high J
cof the in situ processed MgB
2seems to be attributed to the lattice distortion, strongly-coupled grain boundaries and defects present inside MgB
2grains, which act as flux pinning sites for the applied magnetic fields [6, 16-18]. The impurity additions such as silicon carbide [6], carbon (C) [16] and organic
materials including carbon to MgB
2[17-19] were effective in enhancing the current properties at the high magnetic fields. For the commercial use of MgB
2superconductors to the magnet applications, the long length MgB
2wires with a high T
cand J
cshould be fabricated. The superconducting properties of MgB
2are fairly dependent on the fabrication process [20-23]. To improve the J
cof the in situ processed MgB
2, processing parameters such as initial size and composition of raw materials, a type of dopants, and reaction temperature should be optimized. Additionally, reliable current properties should be achieved.
In this study, MgB
2bulk superconductors with/without C doping were prepared through the in situ reaction process using Mg and B powder. To understand the property reliability of MgB
2bulk superconductors, ten test samples were taken from the MgB
2bulk superconductors and their superconducting properties were examined.
2. EXPERIMENTS
Mg (purity of 99.7 %, particle size of 4-6 µm, Tangshan Weihao Co. Ltd., China) and B (purity of 95-97 %, particle size less than 1 µm, Tangshan Weihao Co. Ltd., China) were used as raw powders to prepare MgB
2bulk pellets.
To enhance of the J
cof MgB
2through grain refinement, B powder was ball-milled at 200 rpm for 2 h using ZrO
2balls (2 mm in diameter). Toluene (C
7H
8, 99.5%) was used as a solvent for milling. The ball-milled B powder was dried at 100 ℃ in a vacuum oven. Two different batches of undoped MgB
2and C-doped MgB
2were prepared. The C doping to MgB
2was known to be effective to increase the J
c[16-19]. C was added to MgB
2samples through the glycerin (C
3H
8O
3) treatment for B powder, which was
T c and J c distribution in in situ processed MgB 2 bulk superconductors with/without C doping
C.-J. Kim
*, Y. J. Kim, C.-Y. Lim, B.-H. Jun, S.-D. Park, and K. N. Choo .
Neutron Utilization Technology Division, Korea Atomic Energy Research Institute, Daejeon, Korea (Received 9 June 2014; revised or reviewed 17 June 2014; accepted 18 June 2014)
Abstract
Temperature dependence of magnetic moment (m−T) and the magnetization (M−𝐻) at 5 K and 20 K of the in situ processed MgB
2bulk pellets with/without carbon (C) doping were examined. The superconducting critical temperature (T
c), the superconducting transition width (∆T) and the critical current density (J
c) were estimated for ten test samples taken from the MgB
2bulk pellets. The reliable m−T characteristics associated with the uniform MgB
2formation were obtained for both MgB
2pellets.
The T
cs and ∆Ts of all test samples of the undoped MgB
2were the same each other as 37.5 K and 1.5 K, respectively. The T
cs and
∆Ts of the C-doped MgB
2were 36.5 K and 2.5 K, respectively. Unlike the m−T characteristics, there existed the difference among the M−H curves of the test samples, which might be caused by the microstructure variation. In spite of the slight T
cdecrease, the C doping was effective in enhancing the J
cat 5 K.
Keywords: Superconducting critical temperature, critical current density, in situ process MgB
2bulk, property reliability
* Corresponding author: [email protected]
C.-J. Kim, Y. J. Kim, C.-Y. Lim, B.-H. Jun, S.-D. Park, and K. N. Choo
already reported in our previous work [24, 25]. B powder was mixed with a liquid glycerin, heated to 100 ℃, maintained at this temperature for appropriate time periods and dried at 200℃ for 20 h in a vacuum oven. The B powders with/without the glycerin treatment were mixed with Mg powder to a composition ratio of Mg:B=1:2. The powder mixtures were uniaxially pressed in a steel mold into pellets (15 mm in diameter and 12 mm in thickness).
The prepared MgB
2pellets were encapsulated using titanium (Ti) tube to suppress the possible oxidation of Mg during heat treatment. The Ti-encapsulated pellets were heated at 850℃ at a heating rate of 5℃/min in flowing Ar gas in a tubular furnace, maintained at this temperature for 0.5 h and then furnace-cooled. Since a melting point (m. p.) of Mg is 649 ℃, Mg powders in the (Mg+B) pellet melts during the heat treatment and the Mg melt reacts with B to form MgB
2through the liquid-solid reaction of eq. (1).
When the glycerin-treated B powder is used as a raw material, a small amount of C is included in glycerin substitutes for boron sites and then the C is incorporated with MgB
2according to eq. (2).
Mg(l) + 2B(s) → MgB
2(s) (1) Mg(l) + 2B
1-xC
x(s) → Mg(B
1-xC
x)
2(s) (2) where l and s denote a liquid and a solid, respectively.
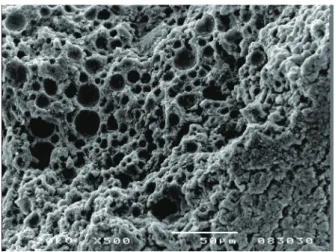
After the heat treatment, the phase formation in MgB
2pellets was analyzed using a powder X-ray diffraction (XRD) method. Microstructure for fracture surfaces of MgB
2pellets was examined using a scanning electron microscope (SEM). Not illustrated here, the XRD results for the undoped MgB
2and C-doped MgB
2showed that the main formed phase was MgB
2and the minor impurity phase was MgO in both MgB
2pellets.
Ten rectangular samples with a dimension of 3×3×3 mm
3(approximate values) were taken from the heat-treated undoped and C-doped MgB
2pellets for the superconducting property measurement (see Fig. 1). The MgB
2pellets were cut into several pieces using a diamond saw. To understand the T
cand J
cdistribution of MgB
2pellets, the temperature dependence of magnetic moment ( m−T ) and magnetization (M−H) for applied magnetic field up to 7 T at 5 K and 20 K were measured for the ten test samples using a Magnetic Property Measurement System (MPMS, Quantum Design). The magnetic J
cwas calculated from the width of ∆M of the M−H loops using an extended Bean’s critical model [26] for a rectangular sample given by eq. (3).
] 3 [ 1
] / )[
( ] 20 / )[
(
2 3b cm a a
cm emu H cm M
A H J
c
−
= ∆ (3)
Where a and b (b≥a) are the lengths of sides of a rectangular sample used for the M−H measurement. The average J
cand the standard deviation were also calculated from the data estimated for the ten test samples.
(a) (b)
Fig. 1. (a) photo of the in situ processed MgB
2pellet, heat-treated at 850℃ for 0.5 h and (b) schematics of ten samples (1-10) taken from sample (a) for magnetization measurement.
3. RESUTLS AND DISCUSSION
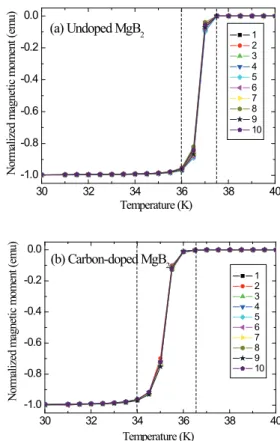
Figure 2 shows the m−T curves of the ten test samples of (a) undoped MgB
2and (b) C-doped MgB
2, heat-treated at 850℃ for 0.5 h, respectively. As can be seen in Fig. 2(a), the m−T curves of the ten test samples are similar each other in shape. The ten test samples show the same superconducting transition temperature (T
onset) of 37.5 K as well as the same transition width (∆T) of 1.5 K (from 37.5 K to 36 K). The T
onsetof 37.5 K of the undoped MgB
2samples is slightly lower than 39 K that was reported in other study [1], which seems to be attributed to the impurity elements included in the low purity raw materials (Mg: 99.7% and B: 95−97%) of this study.
30 32 34 36 38 40
-1.0 -0.8 -0.6 -0.4 -0.2 0.0
1 2 3 4 5 6 7 8 9 10
(a) Undoped MgB
2Temperature (K)
Normalized magnetic moment (emu)
30 32 34 36 38 40
-1.0 -0.8 -0.6 -0.4 -0.2
0.0
(b) Carbon-doped MgB
2Normalized magnetic moment (emu)
Temperature (K)
1 2 3 4 5 6 7 8 9 10
Fig. 2. Normalized m−T curves for ten test samples of (a) undoped MgB
2and (b) C-doped MgB
2.
37
T
cand J
cdistribution in in situ processed MgB
2bulk superconductors with/without C doping
The ten test samples of the C-doped MgB
2also show the similar m−T characteristic behavior with the same T
onsetand the same ∆T (see Fig. 2(b)). The T
onsetis 36.5 K and the ∆T of 2.5 K (from 36.5 K to 34 K), which is lower or larger than that of the undoped MgB
2. The lower T
onsetand the larger ∆T are attributed to the C incorporation with MgB
2[16, 24]
from the glycerin treated B power which was used as a raw material.
The m−T curves of each ten test samples of the undoped MgB
2and the C-doped MgB
2pellets also showed the reliable m−T characteristics with the same T
onsetand the same ∆T. The results indicates that the in site reaction process using Mg and B powders leads to the homogeneous reaction to form the superconducting MgB
2phase in the MgB
2pellets.
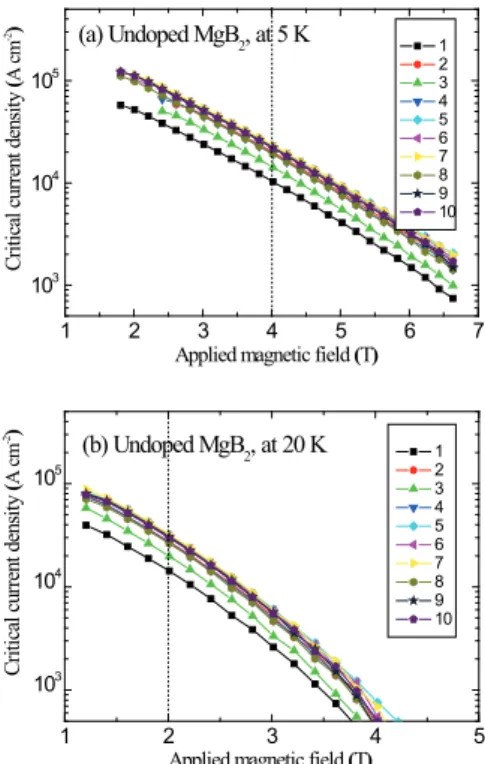
Figure 3 shows the critical current density vs. magnetic field (J
c−H) curves at (a) 5 K and (b) 20 K of the ten samples of the undoped MgB
2, calculated using a Bean model. It was difficult to get the reliable J
cdata at the magnetic fields below 2 T at 5 K and below 1 T at 20 K owing to the data scattering by flux jump. Therefore, only the J
cdata at 2-7 T, 5 K are shown here. The J
c−H curves at 5 K up to 7 T and 20 K (1−5 T) show the typical magnetic field (H) dependence of J
c. As H increases, the J
cdecreases monotonically. The J
cdecrease at 20 K with increasing H is more rapid than at 5 K. There exist differences in J
c−H curves among the test ten samples. This is comparable to the m−T curves of the same samples with the same T
onsetand the same ∆T observed in Fig. 2. The J
cdifferences among samples indicate that the current-carrying capacity of a part of the MgB
2sample is different from that of other parts. The J
cdifference among the ten test samples seems to be associated with the microstructural variation regarding the current flow, which will be mentioned later.
1 2 3 4 5 6 7
103 104 105
1 2 3 4 5 6 7 8 9 10
(a) Undoped MgB
2, at 5 K
Critical current density (A cm-2)
Applied magnetic field (T)
1 2 3 4 5
103 104
105 1 2 3
4 5 6 7 8 9 10
(b) Undoped MgB
2, at 20 K
Critical current density (A cm-2)
Applied magnetic field (T)
Fig. 3. J
c−H curves at (a) 5 K and (b) 20 K estimated for ten test samples of undoped MgB
2.
Figure 4 shows the J
c−H curves at (a) 5 K and (b) 20 K of the ten test samples of the C-doped MgB
2. The J
c−B curves at 5 K, (2−7 T) and 20 K, (1−5 T) are also characterized by the J
cdecrease with increasing H. There also exist differences in J
camong the ten test samples.
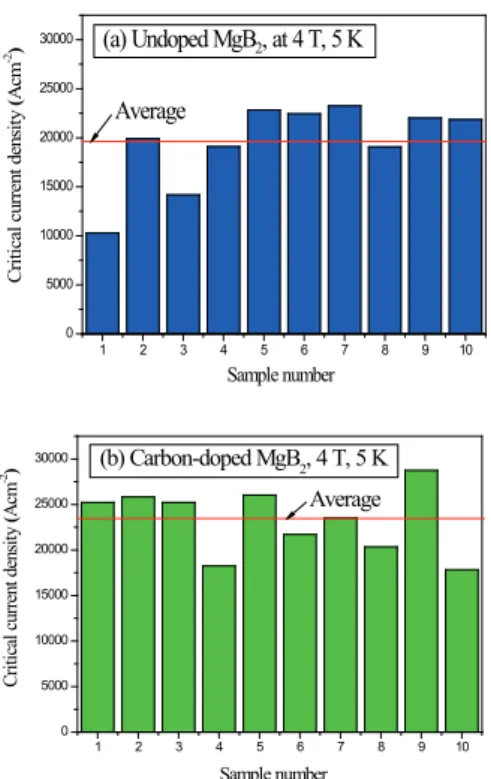
The J
c−H data at 5 K of the undoped MgB
2was compared with that of the C-doped MgB
2. Figure 5 shows the J
chistogram of the ten test samples at 5 K, 4 T of (a) undoped MgB
2and (b) C-doped MgB
2. The J
cs at 4 T of the undoped MgB
2and the C-doped MgB
2are similar each other as about 10
5A/cm
2. As H increases, the J
cdifference of between two MgB
2pellets becomes large. The J
cs at high fields of the C-doped MgB
2are relatively higher than those of the undoped MgB
2. For example, the average J
cat 5 T of the undoped MgB
2, calculated from the ten test samples, is 1.95×10
4A/cm
2and the standard deviation is 4.2×10
3A/cm
2(21% of the average J
c). In comparison with the undoped MgB
2, the average J
cat 5 T of the C-doped MgB
2is 2.32 × 10
4A/cm
2and the standard deviation is 3.6×10
3A/cm
2(15% of the average J
c). The standard deviation data indicates that the C-doped MgB
2is more reliable than that of the undoped MgB
2in current-carrying capacity. The J
cenhancement in the C-doped MgB
2attributed to the microstructural defects induced by the C incorporation with the MgB
2lattices [17, 18, 24].
1 2 3 4 5 6 7
103 104
105 1 2 3
4 5 6 7 8 9 10
Applied magnetic field (T) Critical current density (Acm-2)
(a) Carbon-doped MgB
2, at 5 K
1 2 3 4 5
103 104 105
1 2 3 4 5 6 7 8 9 10
(b) Carbon-doped MgB
2, at 20K
Applied magnetic field (T) Critical current density (Acm-2)
Fig. 4. J
c−H curves at (a) 5 K and (b) 20 K estimated for ten test samples of C-doped MgB
2.
The J
c−H data at 20 K of the undoped MgB
2and the
C-doped MgB
2were also analyzed and the result was shown
in Fig. 6. The histogram shows the J
cdistribution of the ten
test samples at 20 K, 2 T of (a) undoped MgB
2and (b)
C-doped MgB
2. Unlike the J
cdata at 5 K, 4 T, the J
cat 20 K,
2 T of the undoped MgB
2is higher than that of the C-doped
38
C.-J. Kim, Y. J. Kim, C.-Y. Lim, B.-H. Jun, S.-D. Park, and K. N. Choo
1 2 3 4 5 6 7 8 9 10
0 5000 10000 15000 20000 25000 30000
Average
(a) Undoped MgB
2, at 4 T, 5 K
Sample number Critical current density (Acm-2)
1 2 3 4 5 6 7 8 9 10
0 5000 10000 15000 20000 25000
30000 (b) Carbon-doped MgB2, 4 T, 5 K
Sample number Critical current density (Acm-2)
Average
Fig. 5. Histogram of the J
cof the ten test samples at 5 K, 4 T of (a) undoped MgB
2and (b) C-doped MgB
2.
1 2 3 4 5 6 7 8 9 10
0 5000 10000 15000 20000 25000 30000 35000 40000
Sample number Critical current density(Acm-2)
(a) Undoped MgB
2, 2 T, 20 K
Average
1 2 3 4 5 6 7 8 9 10
0 5000 10000 15000 20000 25000 30000 35000 40000
Sample number Critical current density (Acm-2)